Production Deployments
This document shows some of the Production options that may be useful. We will continue to add to this document and welcome users of Gloo Gateway to send PRs to this as well.
Safeguarding the control plane configuration
Enable replacing invalid routes
In some cases it may be desirable to update a virtual service even if its config becomes partially invalid. This is particularly useful when delegating to Route Tables as it ensures that a single Route Table will not block updates for other Route Tables which share the same Virtual Service. More information on why and how to enable this can be found here
Example:
gloo:
  settings:
    invalidConfigPolicy:
      invalidRouteResponseBody: Gloo Gateway has invalid configuration. Administrators
        should run `glooctl check` to find and fix config errors.
      invalidRouteResponseCode: 404
      replaceInvalidRoutes: true
OpenAPI schema validation on CRDs
CRDs are given OpenAPI schemas. This way, the kube api-server (validation webhook) will refuse Custom Resources with invalid definitions.
More validation hooks
In addition to the CRD schemas, Gloo can perform a deeper inspection of the Custom Resources.
You can use these flags:
gloo:
  gateway:
    validation:
      allowWarnings: false # reject if warning status or rejected status
      alwaysAcceptResources: false # reject invalid resources
      warnRouteShortCircuiting: true
      failurePolicy: Fail # failure policy mode for the validation webhook (default is "Ignore")
Safeguarding the data plane configuration
Create secrets in the same namespace as upstreams
When you use header manipulation to add headers to or from requests and responses, you might use the headerSecretRef field. However, referencing a secret in a different namespace than the upstream is not recommended. Instead, ensure secrets are in the same namespace as the upstream. You can additionally set the gloo.headerSecretRefNsMatchesUs Helm field to true, which requires any secrets that are sent in headers to come from the same namespace as the destination upstream.
Performance tips
Disable Kubernetes destinations
When you install Gloo Gateway, the Settings resource is configured with disableKubernetesDestinations: false by default. This setting allows you to use both a Kubernetes service (routeAction.single.kube) or Upstream (routeAction.single.upstream) as a routing destination in your VirtualService. To enable routing to a Kubernetes service destination, Gloo Gateway must scan all services in the cluster to create in-memory Upstream resources to represent them. Gloo Gateway uses these in-memory resources to validate that the destination is valid and returns an error if the specified Kubernetes service cannot be found.
The in-memory Upstream resources are included in the API snapshot. If you have a large number of services in your cluster, the API snapshot increases as each Kubernetes destination is added as an Envoy cluster to each proxy in the cluster. Because of that, the API snapshot and proxy size increase, which can have a negative impact on the Gloo Gateway translation and reconciliation time.
In production deployments, it is therefore recommended to remove in-memory Upstream resources by setting disableKubernetesDestinations: true in your Gloo Gateway deployment. This setting decreases the size of the API snapshot and proxy, and improves translation and reciliation time in Gloo Gateway.
When setting disableKubernetesDestinations: true, Kubernetes service destinations (routeAction.single.kube) cannot be used as the in-memory Upstream resources that represent the Kubernetes service do not exist in your cluster. You must use Upstream destinations in your VirtualService instead (routeAction.single.upstream).
You can set disableKubernetesDestinations: true in the default Settings CR by adding the following content:
apiVersion: gloo.solo.io/v1
kind: Settings
metadata:
  name: default
  namespace: gloo-system
spec:
  gloo:
    disableKubernetesDestinations: true
    ...
You can set disableKubernetesDestinations: true in your Helm overrides file by adding the following setting:
settings:
  disableKubernetesDestinations: true
In your VirtualService make sure to use Upstreams as your routing destination:
routes:
- matchers:
   - prefix: /petstore
  routeAction:
    single:
      upstream:
        name: petstore
        namespace: gloo-system
Configure appropriate resource usage
Before running in production it is important to ensure you have correctly configured the resources allocated to the various components of Gloo Gateway. Ideally this tuning will be done in conjunction with load/performance testing.
These values can be configured via helm values for the various deployments, such as
gloo.deployment.resources.requests.*gatewayProxies.gatewayProxy.podTemplate.resources.requests.*
See the helm chart value reference for a full list.
Transformations
- Disabling transformation validation can drastically improve the CPU usage on the control-plane side.
gloo:
  gateway:
    validation:
      disableTransformationValidation: true # better performances but more risky
Discovery
If you have hundreds of Kubernetes services, you can get better performances on the control-plane if you disable the Upstream and Function discovery.
gloo:
  discovery:
    enabled: false
You can also patch the default Settings CR with this value and delete the discovery deployment.
Enable Envoy’s gzip filter
Optionally, you may choose to enable Envoy’s gzip filter through Gloo Gateway. More information on that can be found here.
Set up an EDS warming timeout
Set up the endpoints warming timeout to a non-zero value. More details here.
Access Logging
Envoy provides a powerful access logging mechanism which enables users and operators to understand the various traffic flowing through the proxy. Before deploying Gloo Gateway in production, consider enabling access logging to help with monitoring traffic as well as to provide helpful information for troubleshooting. The access logging documentation should be consulted for more details.
Make sure you have the %RESPONSE_FLAGS% item in the log pattern.
Horizontally scaling the data plane
Gateway proxy
You can scale up the gateway-proxies Envoy instances by using a Deployment or a DeamonSet. The amount of requests that the gateway-proxies can process increases with the amount of CPU that the gateway-proxies have access to.
Pod Disruption Budget
To configure a Pod Disruption Budget (PDB) for the gateway-proxy deployment when you install Gloo Gateway via Helm, set values for the gatewayProxies.NAME.PodDisruptionBudget fields in your values override file.
For example, consider the following snippet of a values override files, which defines minAvailable as 2.
gatewayProxies:
  gatewayProxy:
    podDisruptionBudget:
      minAvailable: 2
As a result, the following pod disruption budget policy is created:
apiVersion: policy/v1
kind: PodDisruptionBudget
metadata:
  name: gateway-proxy-pdb
  namespace: gloo-system
spec:
  minAvailable: 2
  selector:
    matchLabels:
      gateway-proxy-id: gateway-proxy
You can read more about pod disruption budgets in the Kubernetes documentation
Affinity/Anti-Affinity
To configure affinity and anti-affinity rules for the gateway-proxy deployment when you install Gloo Gateway via Helm, set values for the gatewayProxies.NAME.affinity and gatewayProxies.NAME.antiAffinity fields, respectively, in your values override file.
For example, the following snippet of a values override file sets affinity rules on the gateway-proxy deployment:
gatewayProxies:
  gatewayProxy:
    affinity:
      nodeAffinity:
        requiredDuringSchedulingIgnoredDuringExecution:
          nodeSelectorTerms:
          - matchExpressions:
            - key: kubernetes.io/e2e-az-name
              operator: In
              values:
              - e2e-az1
              - e2e-az2
You can read more about affinity and anti-affinity in the Kubernetes documentation.
Ext-Auth
You can also scale up the ExtAuth service. Typically, one to two instances are sufficient.
If you have multiple instances of the ExtAuth server, you might want to use the same JWT signing key in the OIDC policy for each instance. To reuse the JWT signing key, you must update your Helm configuration file with the following global extension.
global:
  extensions:
    extAuth:
      signingKey:
        key: abcdef
Pod Disruption Budgets and Affinity/Anti-Affinity rules
To configure a pod disruption budget for the ExtAuth service when you install Gloo Gateway via Helm, set the global.extensions.extAuth.deployment.podDisruptionBudget field in your values override file.
By default, the following podAffinity rule is configured for the ExtAuth service:
global:
  extensions:
    extAuth:
      affinity:
        podAffinity:
          preferredDuringSchedulingIgnoredDuringExecution:
          - weight: 100
            podAffinityTerm:
              labelSelector:
                matchLabels:
                  gloo: gateway-proxy
              topologyKey: kubernetes.io/hostname
The default ExtAuth service affinity settings can be overwritten during installation by setting global.extensions.extAuth.affinity in your Helm configuration file. Additionally, anti-affinity rules for the ExtAuth service can be configured by setting global.extensions.extAuth.antiAffinity.
Rate Limit
To configure a pod disruption budget for the rate-limit deployment when you install Gloo Gateway via Helm, set the global.extensions.rateLimit.deployment.podDisruptionBudget field in your values override file.
Affinity settings for the rate-limit deployment can be overwritten during installation by setting global.extensions.rateLimit.affinity in your Helm configuration file. Additionally, anti-affinity rules for the rate-limit deployment can be configured by setting global.extensions.rateLimit.antiAffinity.
Horizontally scaling the control plane
You can increase the number of pods that the gloo deployment runs in the gloo.deployment.replicas Helm setting. Leave the gloo.disableLeaderElection Helm field set to the default value of false when you have multiple replicas of the gloo deployment. Gloo Gateway elects a leader from the replicas, while the other replicas remain on standby to become the leader if the elected leader pod fails or restarts.
Enhancing the data-plane reliability
Downstream to Envoy health checks
Liveness/readiness probes on Envoy are disabled by default. This is because Envoy’s behavior can be surprising: When there are no routes configured, Envoy reports itself as un-ready. As it becomes configured with a nonzero number of routes, it will start to report itself as ready.
- Enable liveness/readiness probes for Envoy
- To enable liveness and readiness probes, specify
gatewayProxies.gatewayProxy.podTemplate.probes=truein your Helm installation. If you are running Gloo Gateway Enterprise, you’ll need to prefix that Helm values key with"gloo."; e.g.gloo.gatewayProxies.gatewayProxy.podTemplate.probes=true.
- To enable liveness and readiness probes, specify
- Configure your load balancer correctly
- If you are running Gloo Gateway behind a load balancer, be sure to configure your load balancer properly to consume the Envoy health check filter.
Upstream health checks
In addition to defining health checks for Envoy, you should strongly consider defining health checks for your Upstreams.
These health checks are used by Envoy to determine the health of the various upstream hosts in an upstream cluster, for example checking the health of the various pods that make up a Kubernetes Service. This is known as “active health checking” and can be configured on the Upstream resource directly.
See the documentation for additional info.
Other considerations
Additionally, “outlier detection” can be configured which allows Envoy to passively check the health of upstream hosts.
A helpful overview of this feature is available in Envoy’s documentation.
This can be configured via the outlierDetection field on the Upstream resource. See the API reference for more detail
.
Also, consider using retries on your routes. The default value for this attribute is 1, which you can increase to 3 for better results.
Metrics and monitoring
Proxy latency filter
In the httpGateway.options section of your Gateway resource, you can enable the proxy latency filter. This Envoy filter measures the request and response latency incurred by the filter chain in additional histograms and access log parameters. For more information about the proxyLatency section, see the API reference.
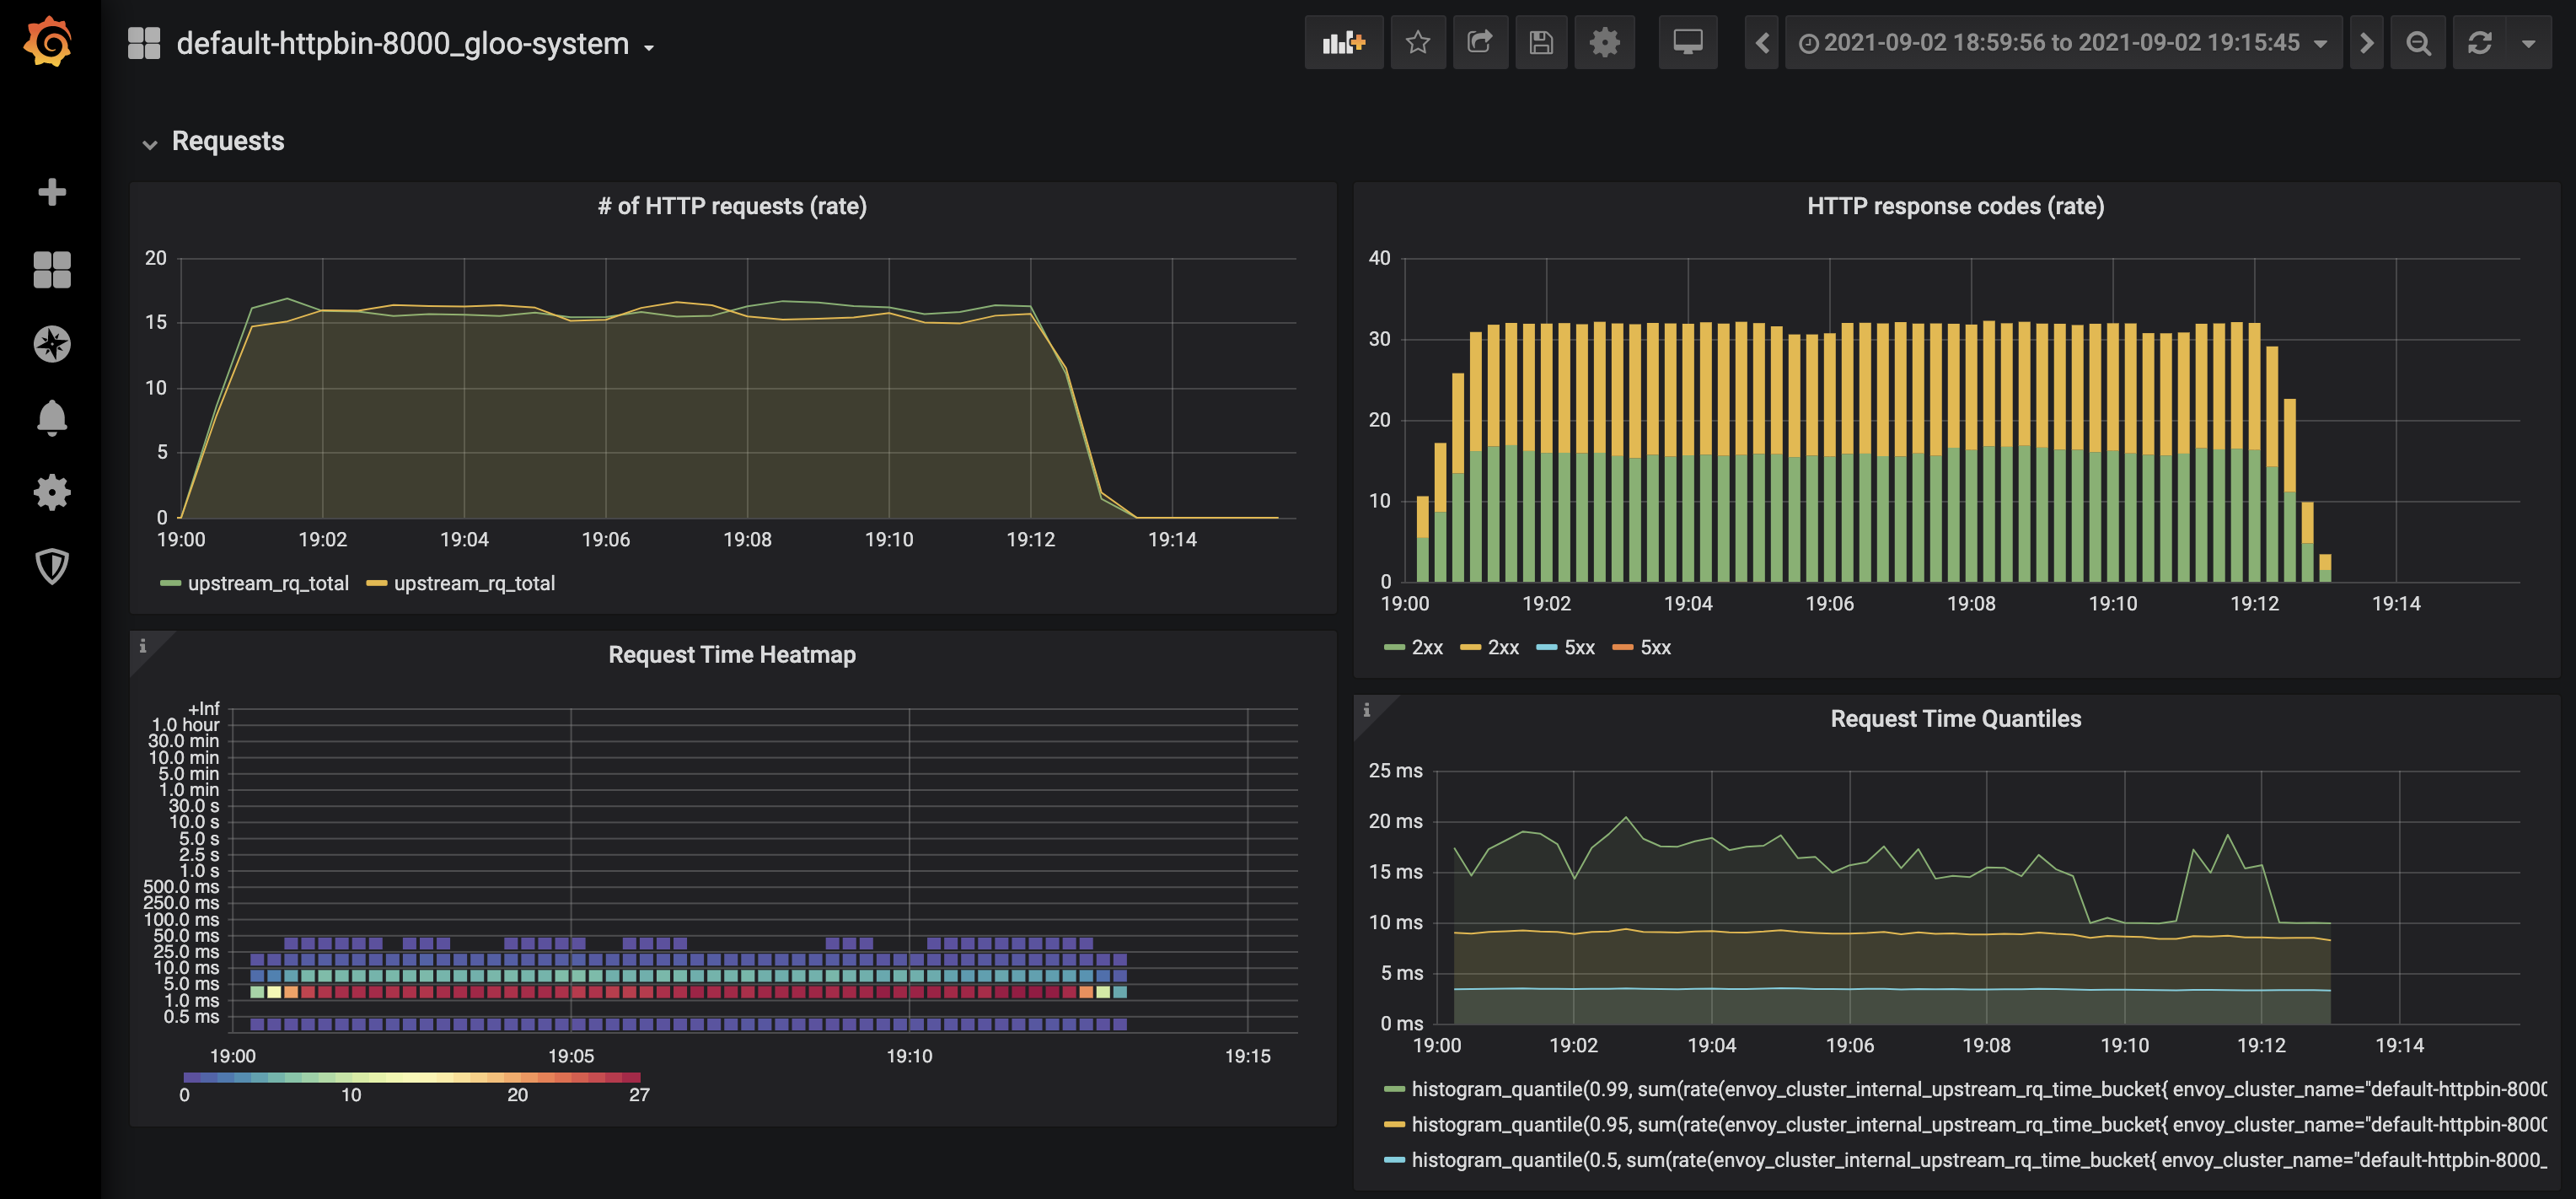
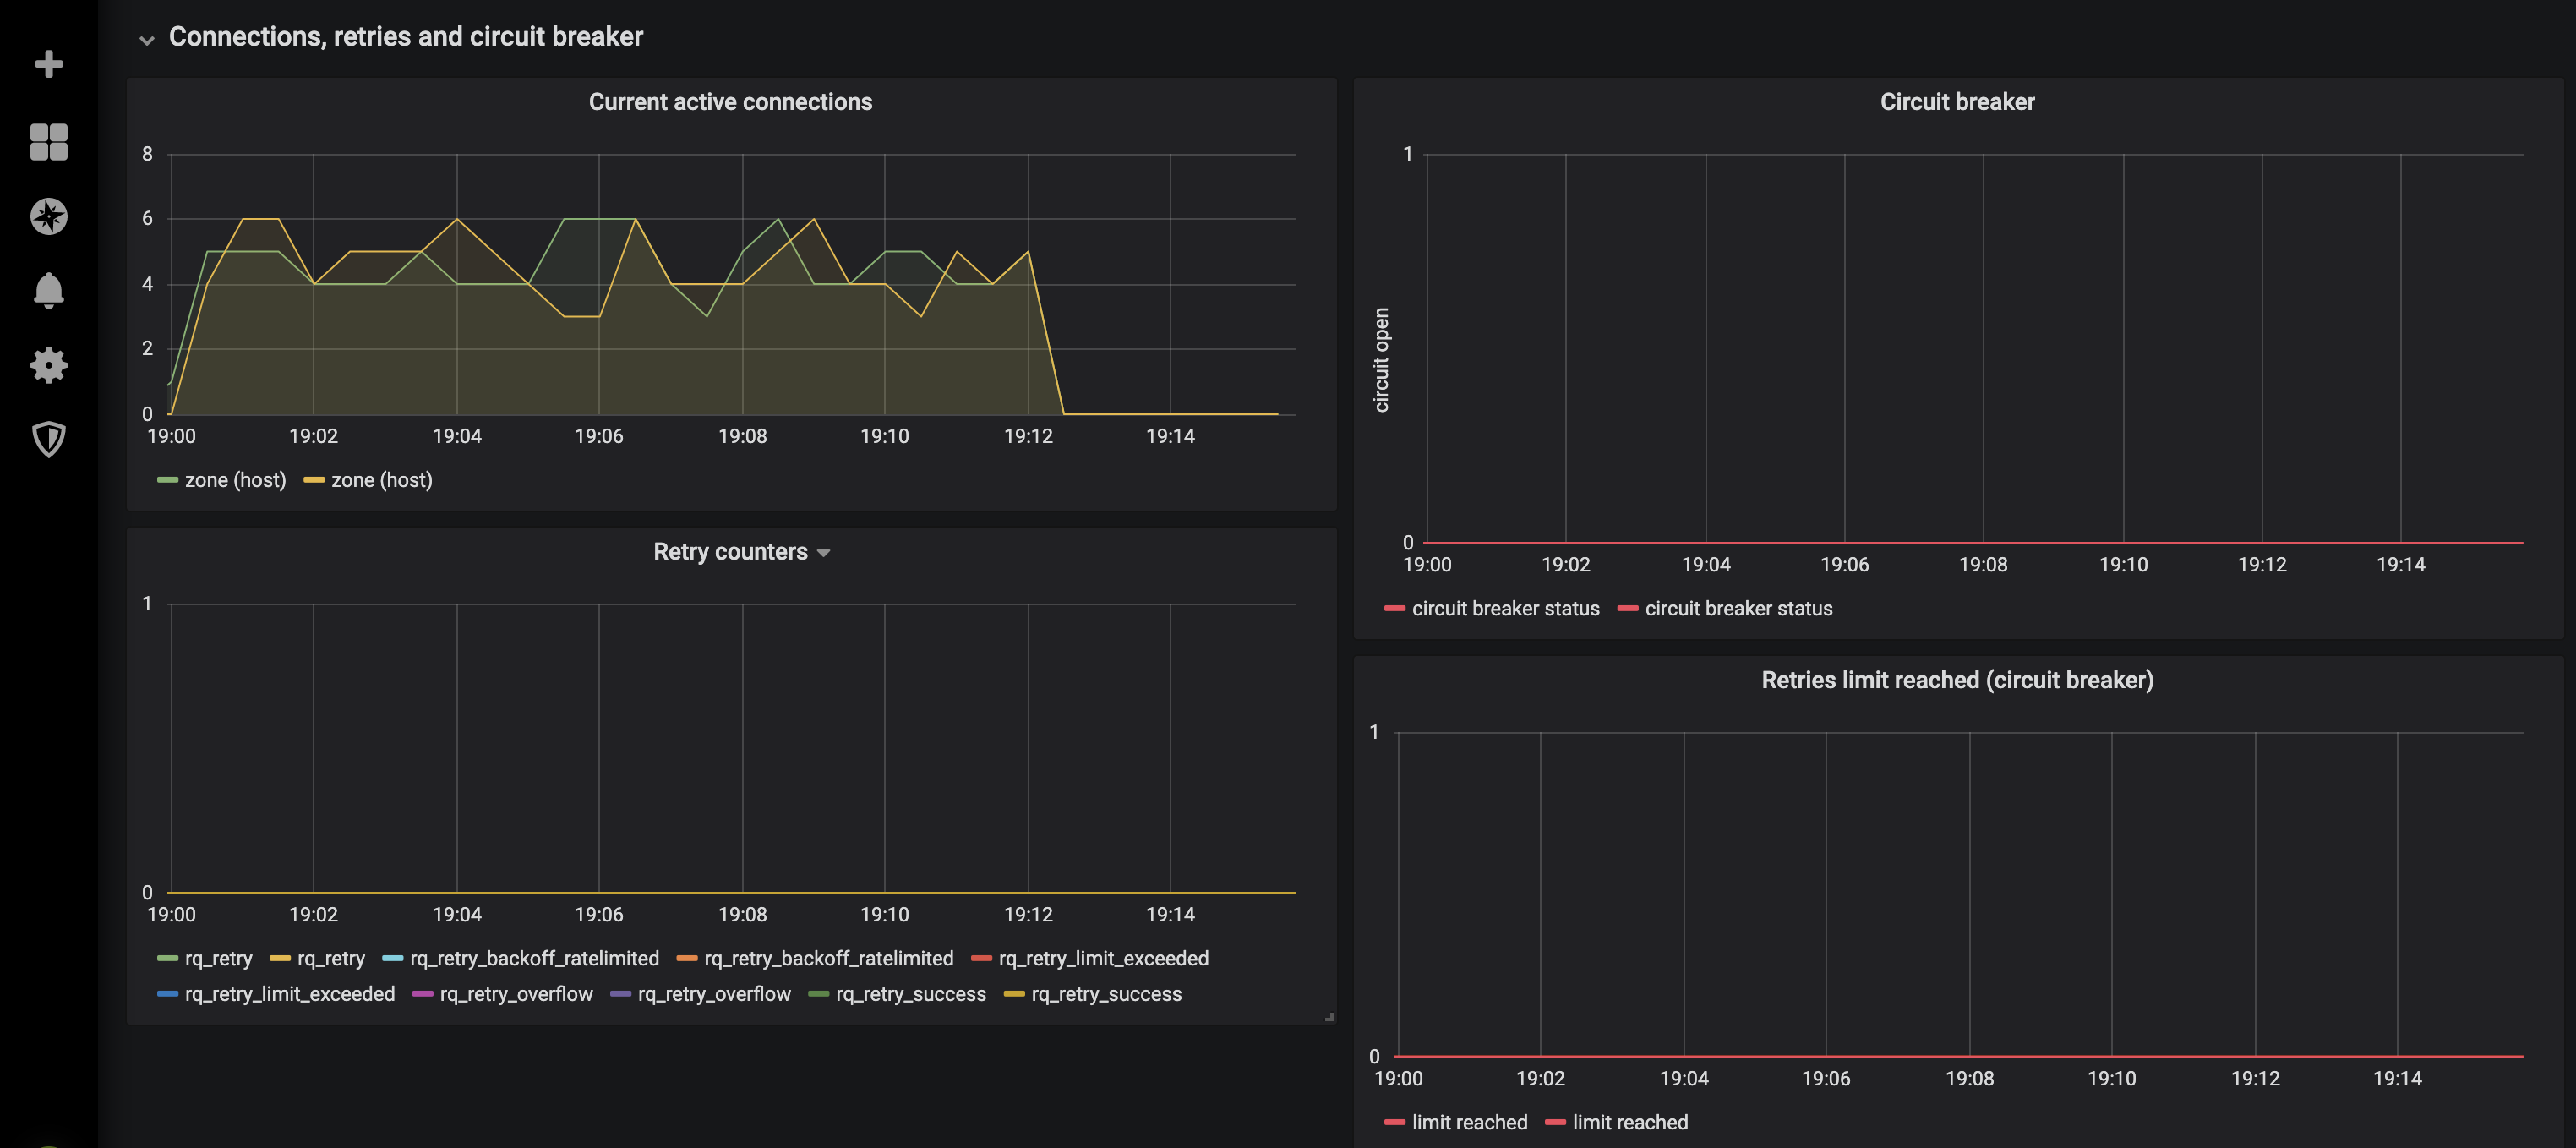
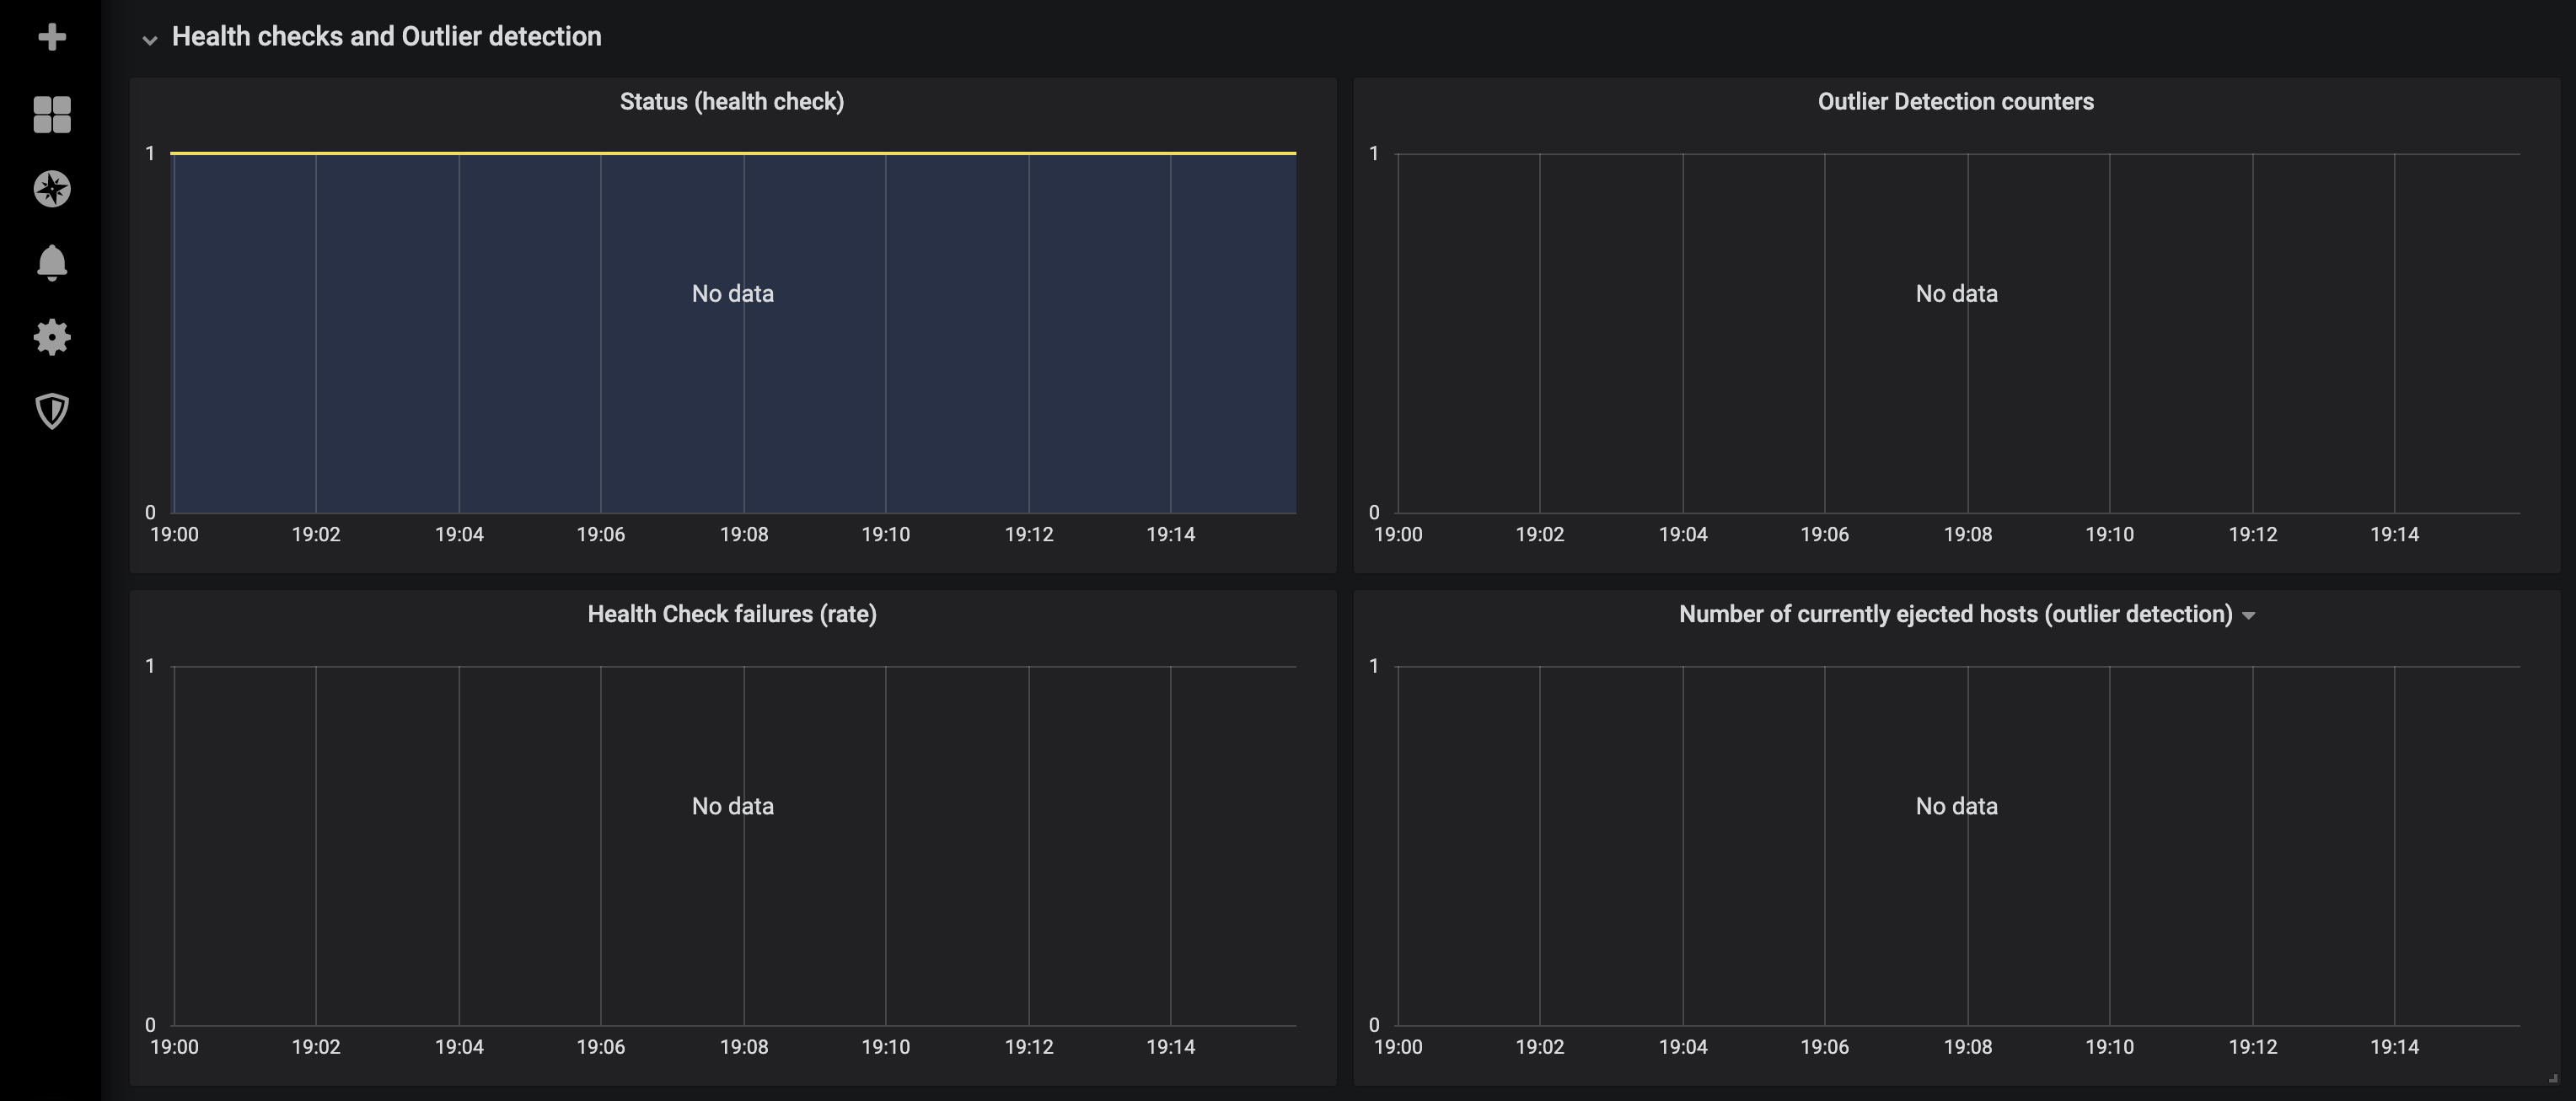
Grafana dashboards
A dedicated Grafana dashboard exists for each Upstream Custom Resource. These dashboards can help you verify whether your active/passive health checks are working, as well as provide insight into retries, requests rate and latency, responses codes, number of active connections, and more.
Prometheus
Gloo Gateway default prometheus server and grafana instance are not meant to be used as-is in production. Please provide your own instance or configure the provided one with production values
When running Gloo Gateway (or any application for that matter) in a production environment, it is important to have a monitoring solution in place. Gloo Gateway Enterprise provides a simple deployment of Prometheus and Grafana to assist with this necessity. However, depending on the requirements on your organization you may require a more robust solution, in which case you should make sure the metrics from the Gloo Gateway components (especially Envoy) are available in whatever solution you are using. The general documentation for monitoring/observability has more info.
Some metrics that may be useful to monitor (listed in Prometheus format):
envoy_control_plane_connected_state– This metric shows whether or not a given Envoy instance is connected to the control plane, i.e. the Gloo pod. This metric should have a value of1otherwise it indicates that Envoy is having trouble connecting to the Gloo pod.container_cpu_cfs_throttled_seconds_total / container_cpu_cfs_throttled_periods_total– This is a generic expression that will show whether or not a given container is being throttled for CPU, which will result is performance issues and service degradation. If the Gloo Gateway containers are being throttled, it is important to understand why and given the underlying cause, increase the resources allocated.
Troubleshooting monitoring components
A common issue in production (or environments with high traffic) is to have sizing issues. This will result in an abnormal number of restarts like this:
$ kubectl get all -n gloo-system
NAME                                                          READY   STATUS             RESTARTS   AGE
pod/discovery-9d4c7fb4c-5wq5m                                 1/1     Running            13         35d
pod/extauth-77bb4fc79b-dsl6q                                  1/1     Running            0          35d
pod/gateway-f774b4d5b-jfhwn                                   1/1     Running            0          35d
pod/gateway-proxy-7656d9df87-qtn2s                            1/1     Running            0          35d
pod/gloo-db4fb8c4-lfcrp                                       1/1     Running            13         35d
pod/glooe-grafana-78c6f96db-wgl5k                             1/1     Running            0          41d
pod/glooe-prometheus-kube-state-metrics-v2-5dd77b76fc-s8prb   1/1     Running            0          41d
pod/glooe-prometheus-server-59dcf7bc5b-jt654                  1/2     CrashLoopBackOff   10692      41d
pod/observability-656d47787-2fskq                             0/1     CrashLoopBackOff   9558       33d
pod/rate-limit-7d6cf64fbf-ldgbp                               1/1     Running            0          35d
pod/redis-55d6dbb6b7-ql89p                                    1/1     Running            0          41d
Looking at the cause of these restarts, we can see that the PV is exhausted:
kubectl logs -f pod/glooe-prometheus-server-59dcf7bc5b-jt654 -n gloo-system -c glooe-prometheus-server
evel=info ts=2021-07-07T05:12:29.474Z caller=main.go:574 msg="Stopping scrape discovery manager..."
level=info ts=2021-07-07T05:12:29.474Z caller=main.go:588 msg="Stopping notify discovery manager..."
level=info ts=2021-07-07T05:12:29.474Z caller=main.go:610 msg="Stopping scrape manager..."
level=info ts=2021-07-07T05:12:29.474Z caller=manager.go:908 component="rule manager" msg="Stopping rule manager..."
level=info ts=2021-07-07T05:12:29.474Z caller=manager.go:918 component="rule manager" msg="Rule manager stopped"
level=info ts=2021-07-07T05:12:29.474Z caller=notifier.go:601 component=notifier msg="Stopping notification manager..."
level=info ts=2021-07-07T05:12:29.474Z caller=main.go:778 msg="Notifier manager stopped"
level=info ts=2021-07-07T05:12:29.474Z caller=main.go:604 msg="Scrape manager stopped"
level=info ts=2021-07-07T05:12:29.474Z caller=main.go:570 msg="Scrape discovery manager stopped"
level=info ts=2021-07-07T05:12:29.474Z caller=main.go:584 msg="Notify discovery manager stopped"
level=error ts=2021-07-07T05:12:29.474Z caller=main.go:787 err="opening storage failed: open /data/wal/00000721: no space left on device"
Next step is to check the pv size and the retention time:
kubectl get deploy/glooe-prometheus-server -n gloo-system -oyaml|grep "image: prom/prometheus" -C 10
        - mountPath: /etc/config
          name: config-volume
          readOnly: true
      - args:
        - --storage.tsdb.retention.time=15d
        - --config.file=/etc/config/prometheus.yml
        - --storage.tsdb.path=/data
        - --web.console.libraries=/etc/prometheus/console_libraries
        - --web.console.templates=/etc/prometheus/consoles
        - --web.enable-lifecycle
        image: prom/prometheus:v2.21.0
        imagePullPolicy: IfNotPresent
        livenessProbe:
          failureThreshold: 3
          httpGet:
            path: /-/healthy
            port: 9090
            scheme: HTTP
          initialDelaySeconds: 30
          periodSeconds: 15
          successThreshold: 1
kubectl get pv -oyaml|grep "glooe-prometheus-server" -C 10
    selfLink: /api/v1/persistentvolumes/pvc-a616d9c6-9733-428f-bac5-c054ca8a025b
    uid: 816c7e99-55e3-4888-83f0-2f31a8314b47
  spec:
    accessModes:
    - ReadWriteOnce
    capacity:
      storage: 16Gi
    claimRef:
      apiVersion: v1
      kind: PersistentVolumeClaim
      name: glooe-prometheus-server
      namespace: gloo-system
      resourceVersion: "36337"
      uid: a616d9c6-9733-428f-bac5-c054ca8a025b
    gcePersistentDisk:
      fsType: ext4
      pdName: gke-jesus-lab-observability-9bc1029-pvc-a616d9c6-9733-428f-bac5-c054ca8a025b
    nodeAffinity:
      required:
        nodeSelectorTerms:
        - matchExpressions:
In this case, 16Gi volume size and 15d retention is not working well, so we must tune one or both parameters using these helm values:
prometheus.server.retention
prometheus.server.persistentVolume.size
Choosing the right values requires some business knowledge, but as a rule of thumb a fair approach is:
persistentVolume.size = retention_in_seconds * ingested_samples_per_second * bytes_per_sample
Security concerns
One of the more important (and unique) things about Gloo Gateway is the ability to significantly lock down the edge proxy. Other proxies require privileges to write to disk or access the Kubernetes API, while Gloo Gateway splits those responsibilities between control plane and data plane. The data plane can be locked down with zero privileges while separating out the need to secure the control plane differently.
For example, Gloo Gateway’s data plane (the gateway-proxy pod) has ReadOnly file system. Additionally it doesn’t require any additional tokens mounted in or OS-level privileges. By default some of these options are enabled to simplify developer experience, but if your use case doesn’t need them, you should lock them down.
- Disable service account token mount
- For example, when integrating with Istio’s SDS (see integration with Istio), you need to have a service account token mounted. If you’re not integrating with Istio, you can eliminate the need for the service account token. When installing Gloo Gateway, set the
gateway.proxyServiceAccount.disableAutomountfield.
- For example, when integrating with Istio’s SDS (see integration with Istio), you need to have a service account token mounted. If you’re not integrating with Istio, you can eliminate the need for the service account token. When installing Gloo Gateway, set the