Metrics (Enterprise)
In this guide, you use the rate limiting service’s default Prometheus metrics to alert when rules are near breach or broken.
For Gloo Gateway Enterprise, you will need to enable rate-limit metrics using the following helm values:
rateLimit:
  deployment:
    stats:
      enabled: true
Prior versions of Gloo Gateway Enterprise published rate-limit metrics to port 16070, which isn’t scraped by the default prometheus installation included with Gloo Gateway Enterprise.
Rate limit metrics
The available rate limit metrics are shown in the following table.
| Metric | Description | Aggregation | Tag |
|---|---|---|---|
ratelimit.solo.io/over_limit |
The number of hits over the limit | Sum | descriptor |
ratelimit.solo.io/near_limit |
The number of hits near the limit (near limit is > 80% allowed by rule) | Sum | descriptor |
ratelimit.solo.io/total_hits |
The total number of hits | Sum | descriptor |
ratelimit.solo.io/descriptor_miss |
The number times a descriptor was ignored as it did not match the configuration | Count | N/A |
ratelimit.solo.io/errors |
The number of errors encountered by the rate-limit server | Count | type |
The descriptor tag (i.e., a prometheus label) corresponds to
the rule being referenced.
In this way, you can monitor and alert based on rate-limit rules/breaches, and quickly determine which rule was triggered (and by how much).
Example metric configuration
Follow along with this guide to learn about basic Prometheus and Grafana features that you can use with the rate limiting metrics. If you are already familiar with Prometheus and Grafana, you won’t get much out of this tutorial.
The examples in this guide demonstrate how metric alerting can work, but are not intended for production. For example, the over_limit alert shows how an alert is triggered when a threshold is exceeded. Because the over_limit metric is a sum, it does not reset to zero after reaching the threshold. Therefore, the alert continues, which is not a production use case.
Setup
Let’s start by setting up the virtual service and settings resources to match the rule priority example.
Triggering limits
Run the following; you should get HTTP 429 Too Many Requests on the second request.
curl -H "x-type: Whatsapp" -H "x-number: 311" --head $(glooctl proxy url)
curl -H "x-type: Whatsapp" -H "x-number: 311" --head $(glooctl proxy url)
Now let’s take a look at the published metrics.
Port-forward the Gloo Gateway Enterprise’s Prometheus installation to port 9090:
kubectl port-forward -n gloo-system deployment/glooe-prometheus-server 9090
And open the Prometheus UI at localhost:9090.
In the dropdown, you can select the rate-limit metric you’d like to investigate. Let’s investigate
ratelimit_solo_io_over_limit.
Add a PromQL query (prometheus query language) for ratelimit_solo_io_over_limit, choose the appropriate time window,
and execute. If you click the graph tab, you should see a spike in queries over limit (click to enlarge):
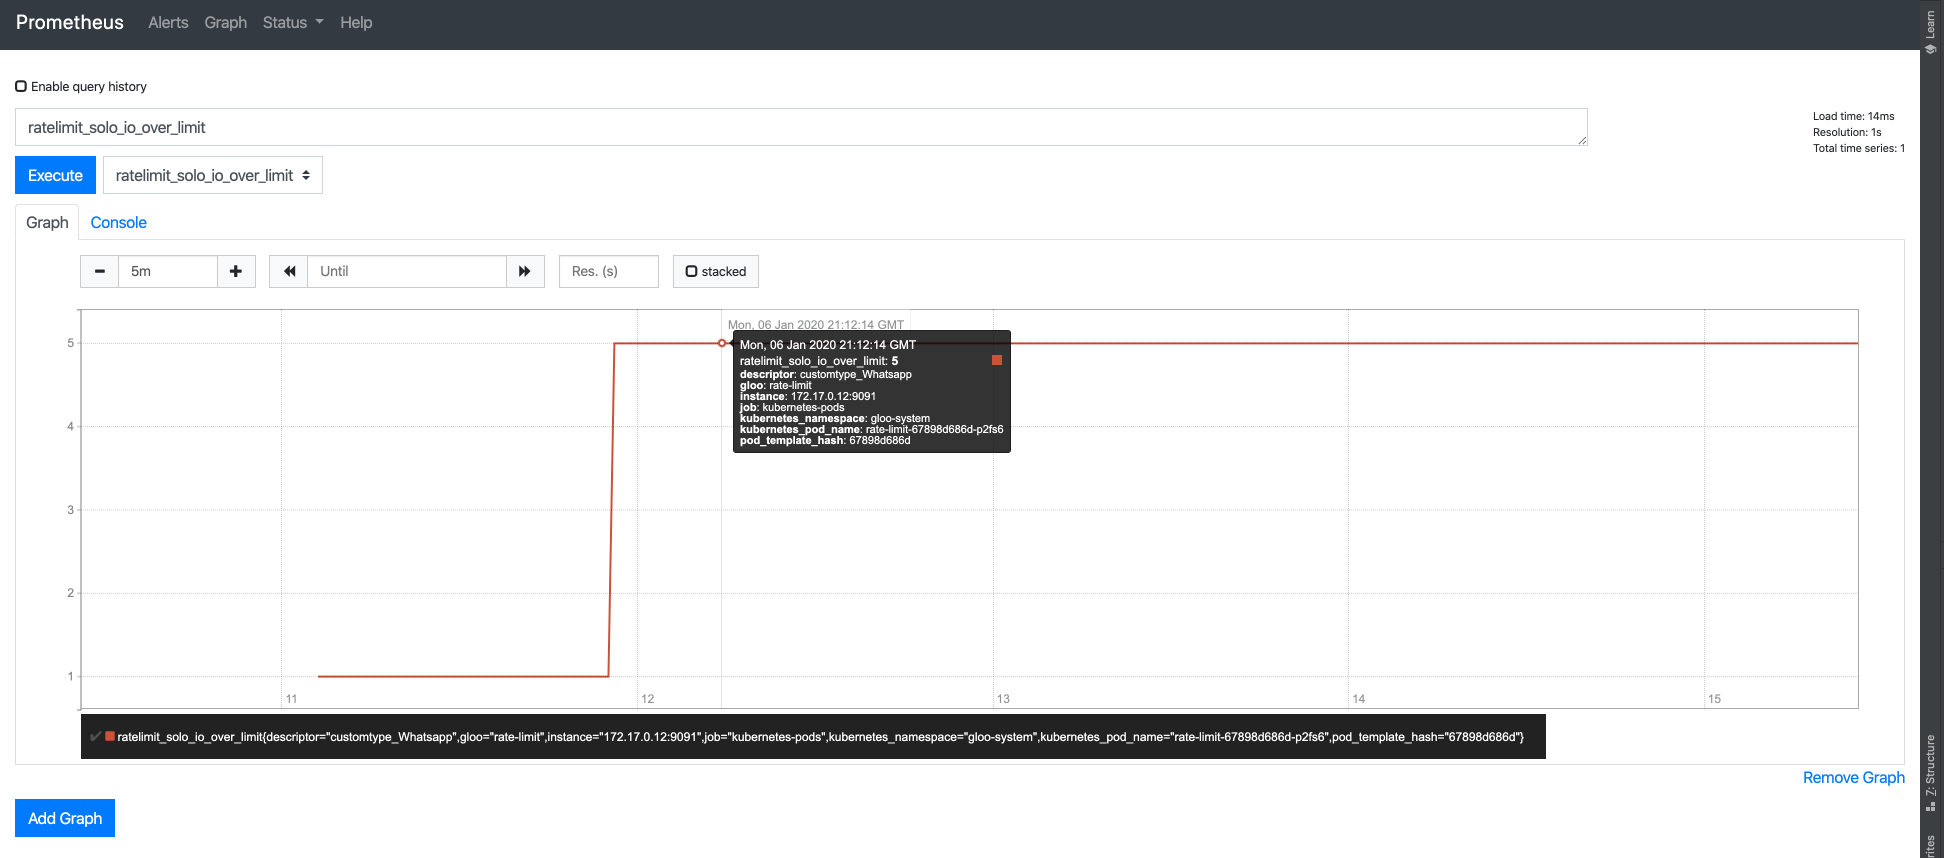
Note that the metric is labeled with descriptor: customtype_Whatsapp. This is saying that our request was over the
limit associated with the custom descriptor Whatsapp (Rule 2, limit all Whatsapp requests to 1/min). Note that I
actually made 5 requests over the limit – if you followed this tutorial exactly you should see 1 request.
Alerting
The prometheus alerting docs can be leveraged for customized setups.
Alternatively, we can take any of our PromQL queries (e.g., ratelimit_solo_io_over_limit) and create an alert for
this in Gloo Gateway’s Grafana installation.
Port-forward the Gloo Gateway Enterprise’s Grafana installation to port 3000:
kubectl port-forward deployment/glooe-grafana 3000 -n gloo-system
And open the Prometheus UI at localhost:3000.
Enter the Grafana credentials (by default, admin/admin).
On the left side there is a bell, hover on it and select alerting -> notification channels. This should show the following:
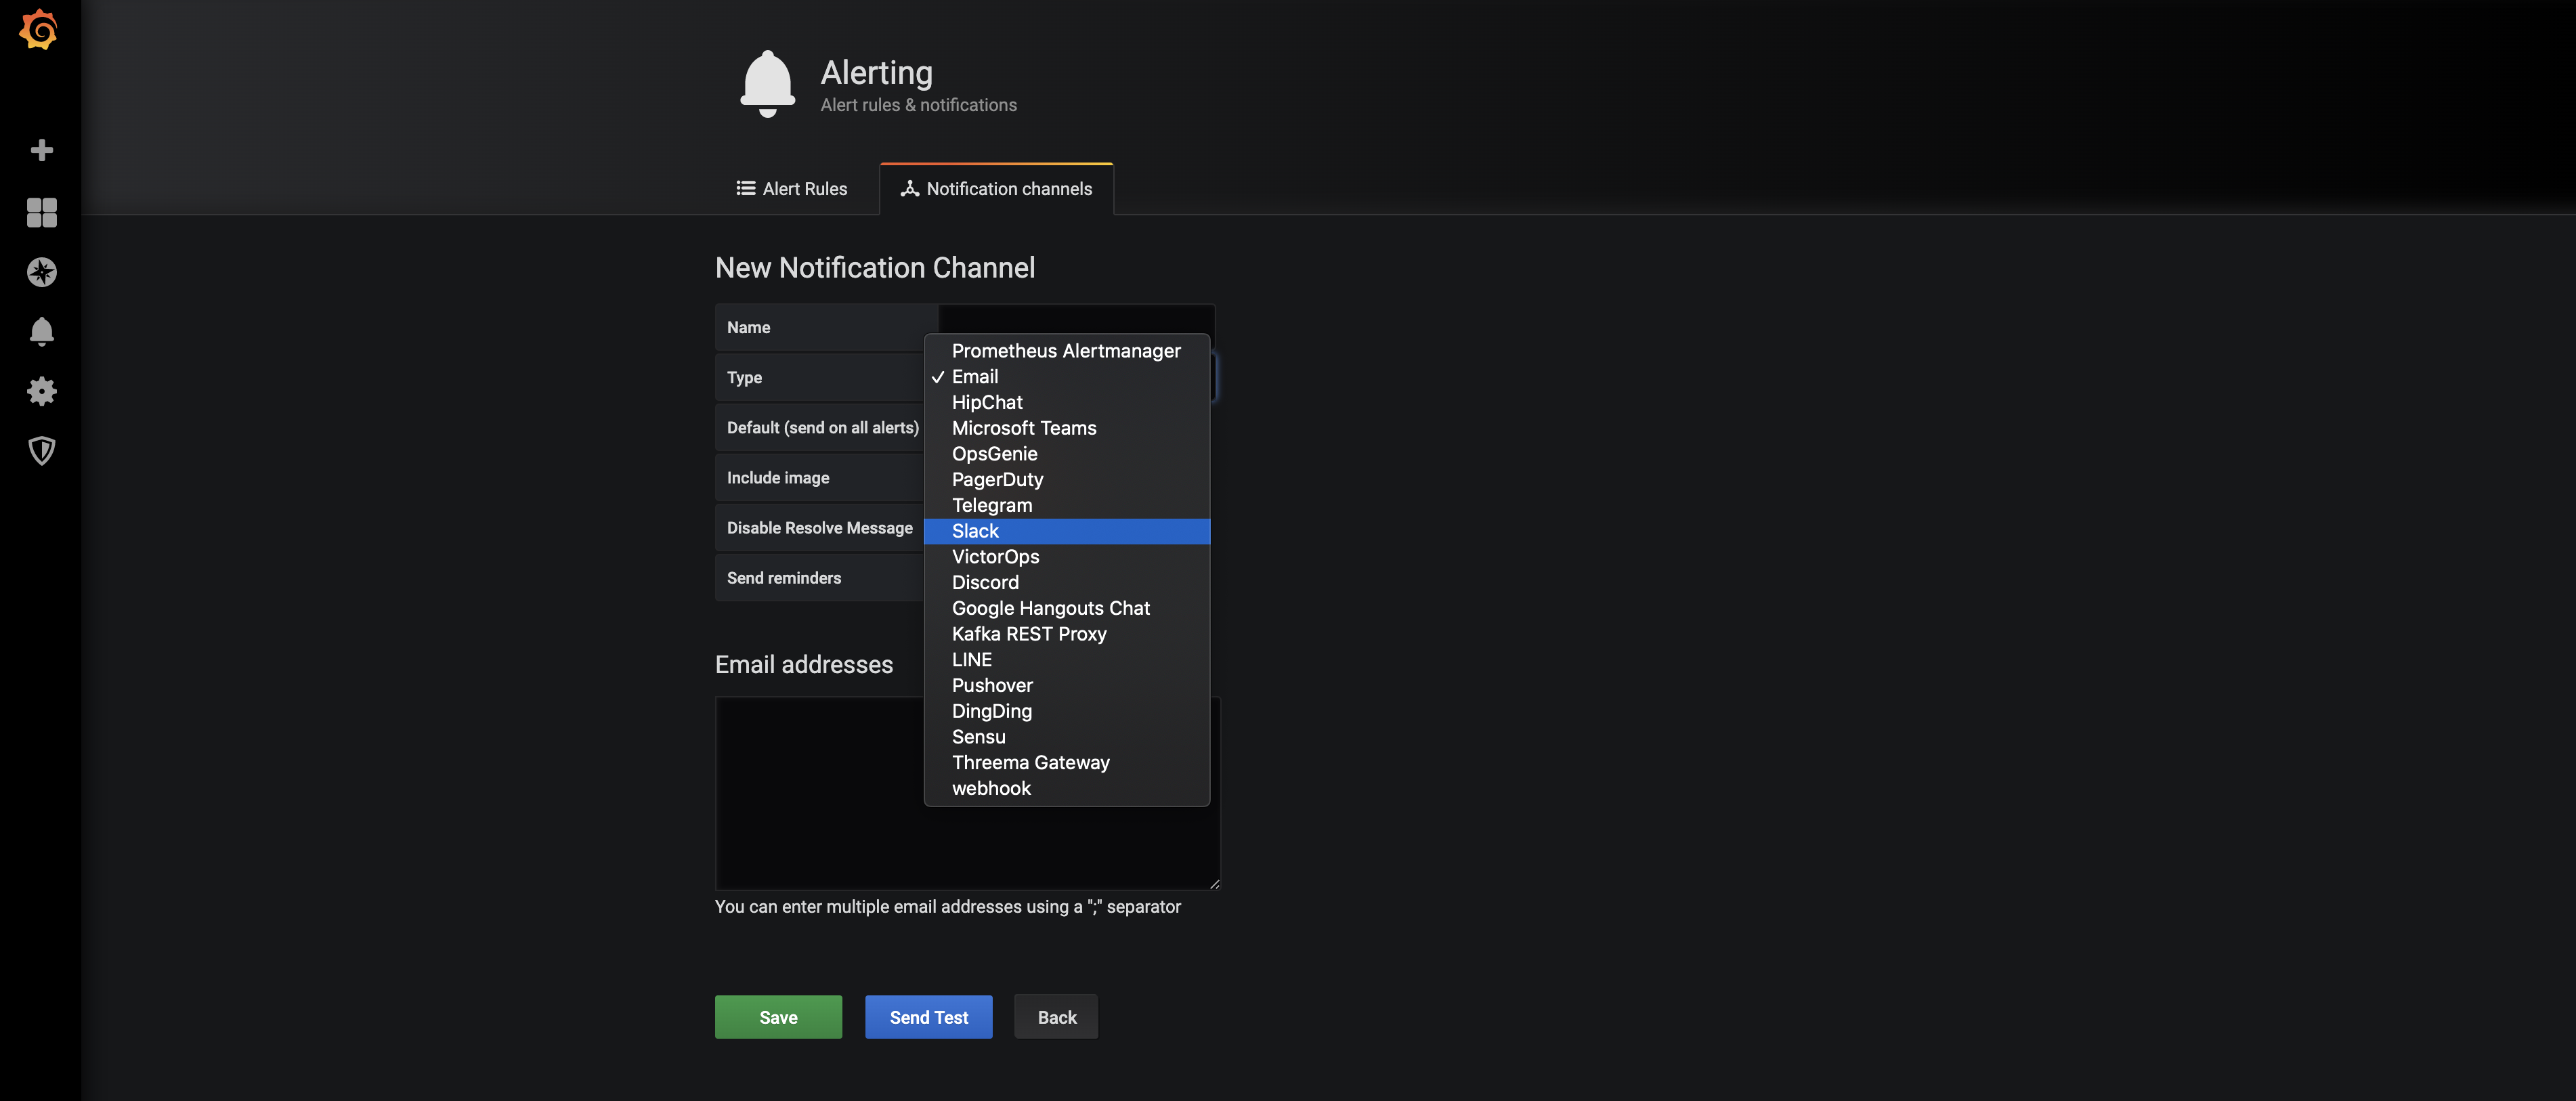
For the sake of example, choose email, and save. We have not configured SMTP for Grafana, so the alerts won’t actually get delivered.
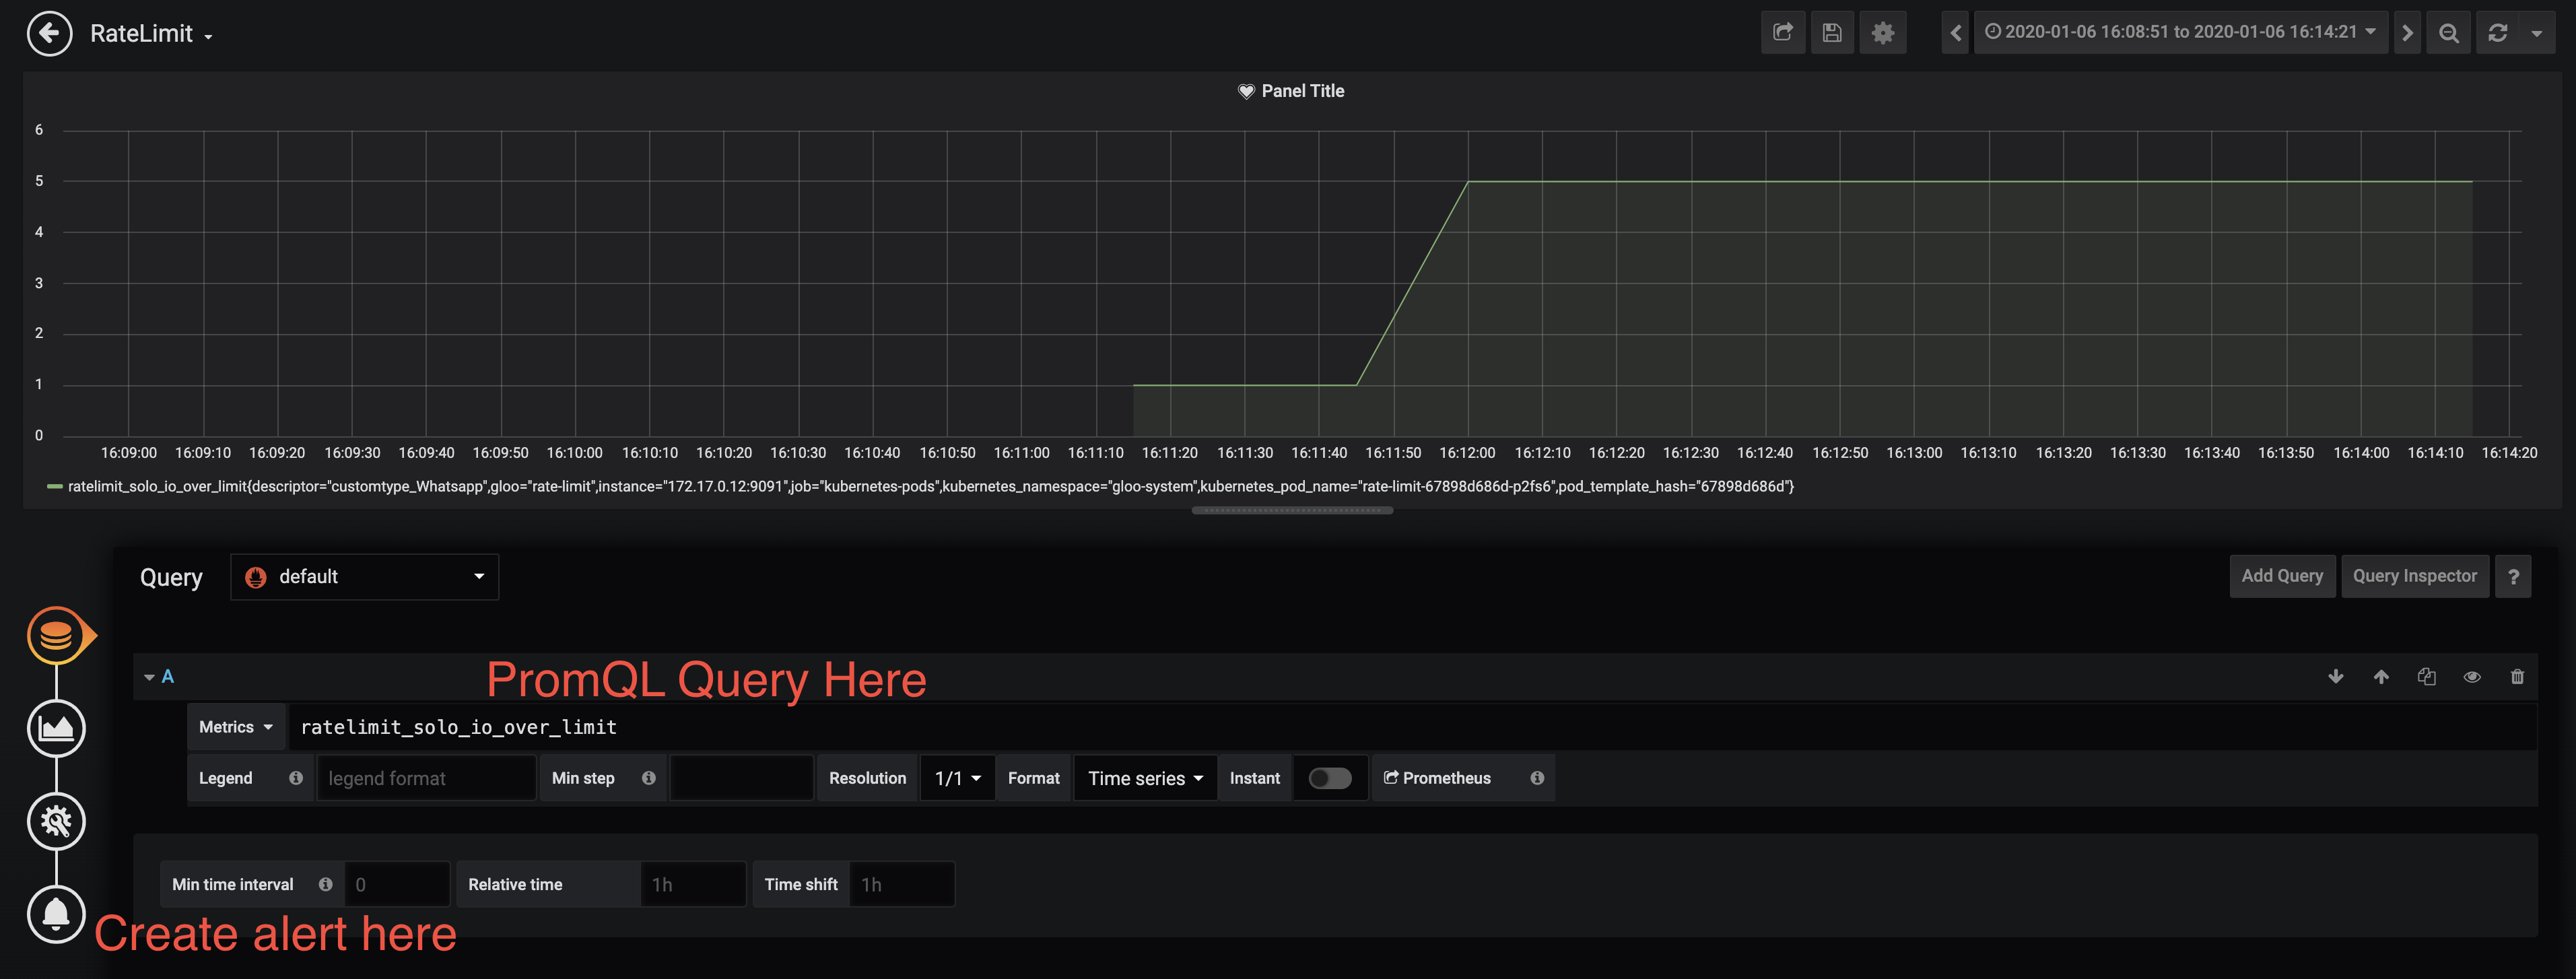
Now let’s create a dashboard and alert for the metric you’d like to alert on.
Go to the main menu and select “create a dashboard”. Fill in the PromQL query and as follows:
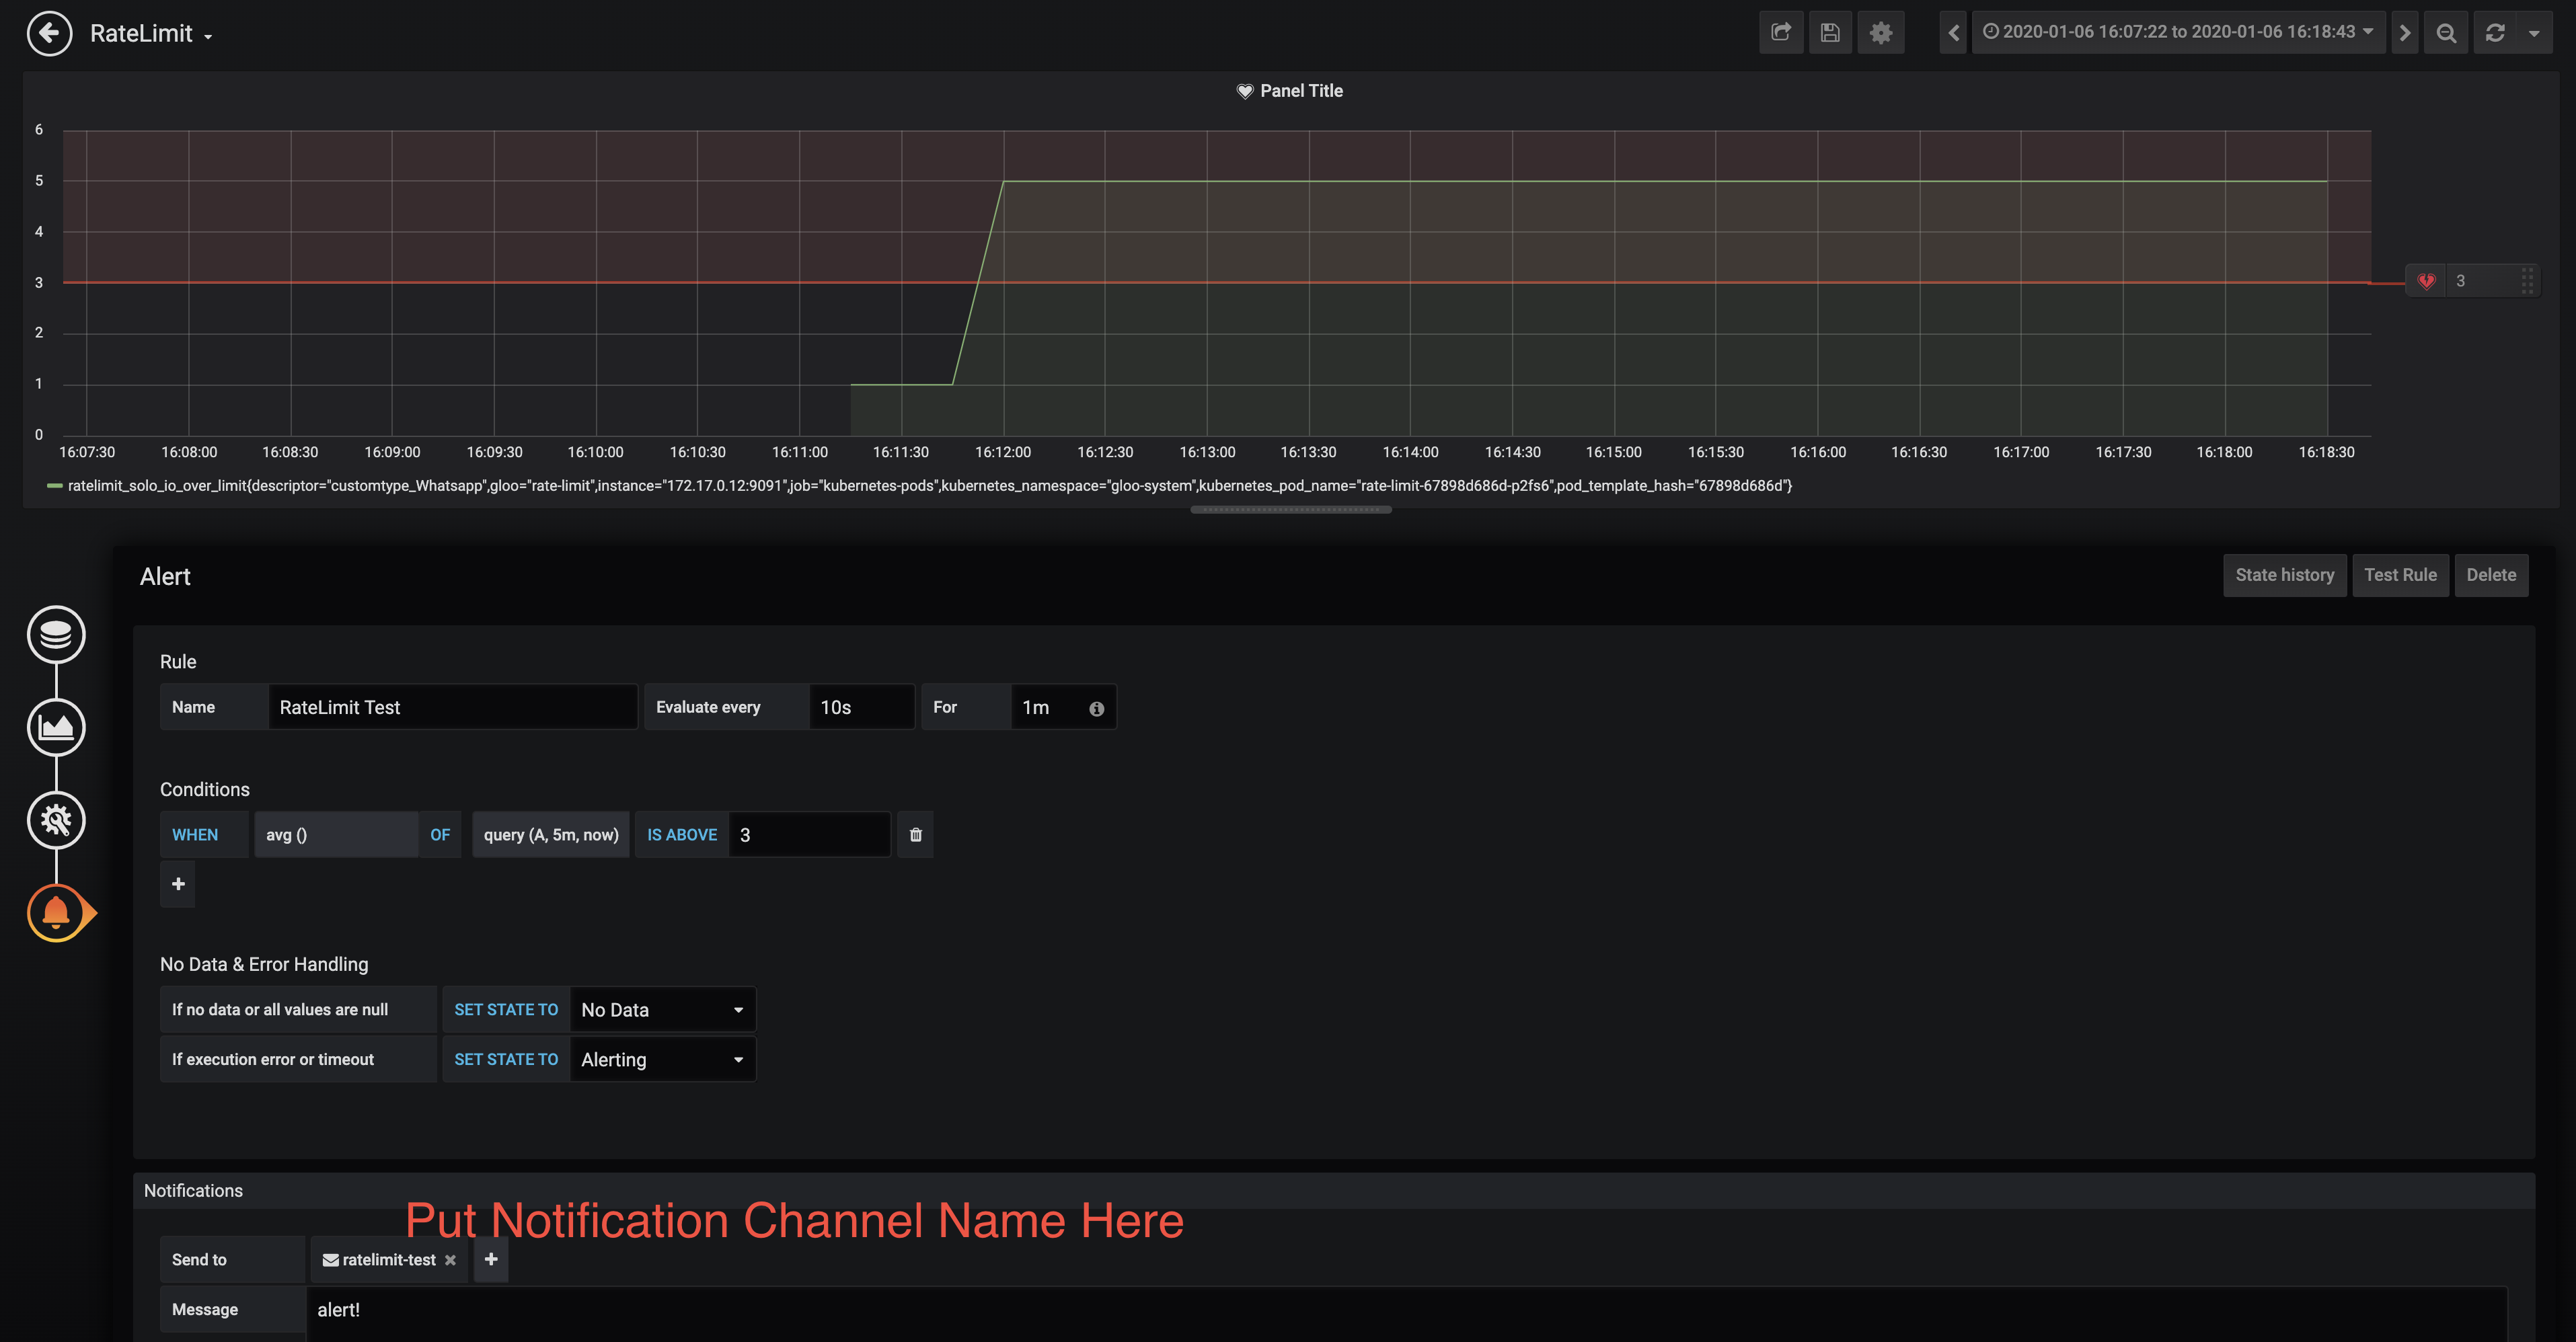
In the alert page, you should see the email destination you created as a valid destination. Select it, and save your dashboard:
Further Drill Down
Sometimes you’d like to further drill down into the offending requests, as well as requests that contributed to rate-limit rule breaches. If the default metrics aren’t enough, the next recommended course of action is to do some analysis of your access logs. To get started, you can check out our access logs example here.