Access logs
In this tutorial we will see how to use Access Logs to determine common characteristics of rate-limit offending requests.
Setup
Let’s start by setting up the virtual service and settings resources to match the rule priority example.
Let’s also update the default Gateway resource to enable access logging:
apiVersion: gateway.solo.io/v1
kind: Gateway
metadata:
  labels:
    app: gloo
  name: gateway-proxy
  namespace: gloo-system
spec:
  proxyNames:
  - gateway-proxy
  bindAddress: '::'
  bindPort: 8080
  httpGateway: {}
  options:
    accessLoggingService:
      accessLog:
      - fileSink:
          jsonFormat:
            # HTTP method name
            httpMethod: '%REQ(:METHOD)%'
            # Protocol. Currently either HTTP/1.1 or HTTP/2.
            protocol: '%PROTOCOL%'
            # HTTP response code. Note that a response code of ‘0’ means that the server never sent the
            # beginning of a response. This generally means that the (downstream) client disconnected.
            responseCode: '%RESPONSE_CODE%'
            # Total duration in milliseconds of the request from the start time to the last byte out
            clientDuration: '%DURATION%'
            # Total duration in milliseconds of the request from the start time to the first byte read from the upstream host
            targetDuration: '%RESPONSE_DURATION%'
            # Value of the "x-envoy-original-path" header (falls back to "path" header if not present)
            path: '%REQ(X-ENVOY-ORIGINAL-PATH?:PATH)%'
            # Upstream cluster to which the upstream host belongs to
            upstreamName: '%UPSTREAM_CLUSTER%'
            # Request start time including milliseconds.
            systemTime: '%START_TIME%'
            # Unique tracking ID
            requestId: '%REQ(X-REQUEST-ID)%'
            # Response flags; will contain RL if the request was rate-limited
            responseFlags: '%RESPONSE_FLAGS%'
            # We rate-limit on the x-type header
            messageType: '%REQ(x-type)%'
            # We rate-limit on the x-number header
            number: '%REQ(x-number)%'
          path: /dev/accesslogs.txt # /dev/stdout works but will intermingle access logs with other envoy logs
Run the following; you should get HTTP 429 Too Many Requests on the third request.
curl -H "x-type: Messenger" -H "x-number: 311" --head $(glooctl proxy url)
curl -H "x-type: Messenger" -H "x-number: 411" --head $(glooctl proxy url)
curl -H "x-type: Messenger" -H "x-number: 411" --head $(glooctl proxy url)
Now let’s take a look at the Envoy access logs:
kubectl exec deployment/gateway-proxy -n gloo-system -it -- cat /dev/accesslogs.txt
# Print only log lines starting with {" (our access logs are formatted as JSON)
kubectl logs -n gloo-system deployment/gateway-proxy | grep '^{' | jq
You should see all three requests made, in order. Note that the third request got rate-limited, and has RL for a
response flag:
{
  "number": "311",
  "clientDuration": "31",
  "upstreamName": "default-petclinic-8080_gloo-system",
  "responseCode": "200",
  "messageType": "Messenger",
  "requestId": "a4402b51-840c-478d-bda9-9a12eaa5f27a",
  "httpMethod": "HEAD",
  "systemTime": "2019-12-27T16:07:18.821Z",
  "path": "/",
  "targetDuration": "31",
  "protocol": "HTTP/1.1",
  "responseFlags": "-"
}
{
  "httpMethod": "HEAD",
  "systemTime": "2019-12-27T16:07:20.311Z",
  "path": "/",
  "targetDuration": "9",
  "protocol": "HTTP/1.1",
  "responseFlags": "-",
  "number": "411",
  "clientDuration": "9",
  "upstreamName": "default-petclinic-8080_gloo-system",
  "responseCode": "200",
  "messageType": "Messenger",
  "requestId": "b09c0b68-eda5-4b3c-afa3-dd8329ef5965"
}
{
  "responseFlags": "RL",
  "number": "411",
  "clientDuration": "0",
  "upstreamName": "-",
  "responseCode": "429",
  "messageType": "Messenger",
  "requestId": "b2760d46-69d6-41b7-ab24-b4d4963a8420",
  "httpMethod": "HEAD",
  "systemTime": "2019-12-27T16:07:21.295Z",
  "path": "/",
  "targetDuration": "-",
  "protocol": "HTTP/1.1"
}
These access logs can be used to determine common characteristics of offending requests.
A common access logs workflow is to write them to a file on a persistent volume and/or have log exporters persist the data. An ETL job can parse the access logs to allow admins to drill down into fine-grained information about requests that contributed toward rate-limits.
Another common workflow is to write the logs to stdout and have a logging agent aggregate the data and send it to a
backend (e.g. elasticsearch, splunk, etc.). Other common logging architectures can be seen in the kubernetes
logging docs.
Dumb Sample Python “ETL” job
First, copy the logs to your local machine:
kubectl exec deployment/gateway-proxy -n gloo-system -it -- cat /dev/accesslogs.txt > accesslogs.txt
Create the following python script and name it access_log_parser.py:
import json
from collections import Counter
import matplotlib.pyplot as plt
import numpy as np


def at_least(c, threshold):
    """Return a Counter of values which are at_least (>=) threshold"""
    return Counter(el for el in c.elements() if c[el] >= threshold)


def draw_hist(labels, values):
    indices = np.arange(len(labels))
    width = 1
    plt.bar(indices, values, width)
    plt.xticks(indices + width * 0.5, labels)
    plt.show()


if __name__ == "__main__":
    with open("accesslogs.txt") as f:
        data = [json.loads(line) for line in f]

    number = {line["requestId"]: int(line["number"]) for line in data}
    number_hist_values = at_least(Counter(number.values()), 1)

    labels, values = zip(*reversed(number_hist_values.most_common()))
    draw_hist(labels, values)
This script creates a histogram to chart the distribution of requests to each number. We can use this to determine common message recipients even though the rate limit rule being breached only cares about the message type (Rule 1, limit all Messenger requests to 2/min).
Parse the logs and generate a histogram for the number contacted:
python access_log_parser.py
Note: on macOS you can try /usr/bin/python instead to resolve ImportError: No module named matplotlib.pyplot.
Otherwise, use pip to install the library pip install matplotlib
This should create a histogram that looks like:
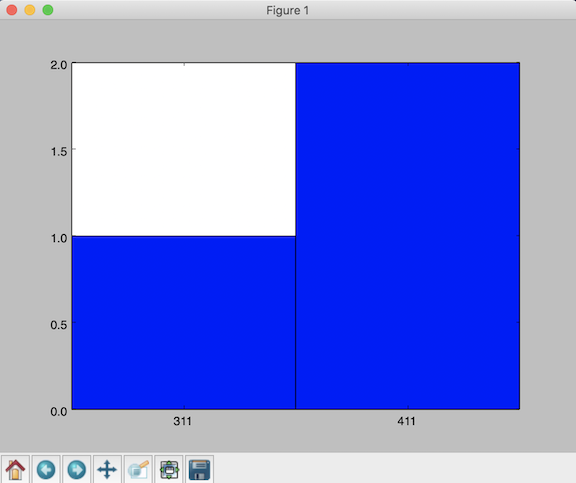
Notice that two requests were made to number “411”, and one was made to “311”.
Cleanup
rm accesslogs.txt
rm access_log_parser.py