Default Envoy tracing
With Gloo Gateway, you can use Envoy’s end-to-end tracing capabilities to obtain visibility and track requests as they pass through your API gateway to distributed backends, such as services, databases, or other endpoints in your ecosystem.
To get started, enable the default Envoy distributed tracing in your Gloo Gateway installation to trace requests, analyze service dependencies, and find bottlenecks or high latency services. Then, use a tracing provider to collect and visualize the sampled spans. The following distributed tracing platforms are supported for the default Envoy metrics collection in Gloo Gateway:
This guide uses the Zipkin tracing platform as an example to show how to set up tracing in Gloo Gateway. To set up other tracing platforms, refer to the platform-specific documentation or the Envoy tracing provider documentation.
How does it work?
To trace a request, data must be captured from the moment the request is initiated and every time the request is forwarded to another endpoint, or when other microservices are called along the way. When a request is initiated, a trace ID and an initial span (parent span) is created. A span represents an operation that is performed on your request, such as an API call, a database lookup, or a call to an external service. If a request is sent to a service, a child span is created in the trace capturing all the operations that are performed within the service.
Each operation and span is documented with a timestamp so that you can easily see how long a request was processed by a specific endpoint in your trace. Most tracing platforms have support to visualize the tracing information in a graph so that you can easily see bottlenecks in your microservices stack.
To configure a tracing platform, you must update the Envoy bootstrap configuration. The bootstrap configuration is automatically applied when an Envoy process is initialized. To update the bootstrap configuration, you can use one of the following ways:
- Gloo Gateway: Configure the tracing platform in the installation Helm chart template or in the Gloo Gateway custom resources, and let Gloo Gateway determine how to best apply the configuration in Envoy.
- Manually update Envoy: Use a Kubernetes configmap and provide the Envoy code that you want to apply. You then manually restart all the deployments where you want to apply the updated Envoy configuration.
Set up Zipkin tracing
To set up Zipkin tracing, you follow these general steps:
- Set up Zipkin locally.
- Configure the Zipkin tracing cluster in Gloo Gateway.
- Configure Zipkin as the tracing provider for a listener.
- Optional: Annotate routes with descriptors.
- Initiate a request and view traces.
Step 1. Set up Zipkin locally
Set up Zipkin tracing in a local Kind cluster for local troubleshooting and experimentation.
-
Run Zipkin.
docker run --network=kind -itd --name zipkin -p 9411:9411 openzipkin/zipkin -
Verify that both
zipkinandzipkin-tracing-control-planeare in your local Kind cluster network, and note thezipkincontainer IP address without the CIDR. In the following example, thezipkincontainer IP address is172.xx.x.2.docker network inspect kind[ { "Name": "kind", "Id": "6a37a4ebb2d0e7dcbabe50dc8b1a519b431f054aebb822ed85e00abde99fd4d3", "Created": "2021-09-16T09:28:49.88165506-04:00", "Scope": "local", "Driver": "bridge", "EnableIPv6": true, "IPAM": { "Driver": "default", "Options": {}, "Config": [ { "Subnet": "172.xx.x.0/16", "Gateway": "172.xx.x.1" }, { "Subnet": "fc00:f853:ccd:e793::/64", "Gateway": "fc00:f853:ccd:e793::1" } ] }, "Internal": false, "Attachable": false, "Ingress": false, "ConfigFrom": { "Network": "" }, "ConfigOnly": false, "Containers": { "3431770d0c41bfbc8eceac4c806605286f5dac81820599f828dcb250037a2f48": { "Name": "zipkin-tracing-control-plane", "EndpointID": "3e48e18bc7b259ca9d597a594ee3d5205c8339e8ecd9f8f274a178d07f395b78", "MacAddress": "02:42:ac:12:00:03", "IPv4Address": "172.xx.x.3/16", "IPv6Address": "fc00:f853:ccd:e793::3/64" }, "84dadbd86f113c7104eca23d3d78e9dec997a47666c1ba4eed2ae7a5ad8eb20d": { "Name": "zipkin", "EndpointID": "09e07c8ac6b1cd912c325962586d9497520e216a4ec357384c663594248fc104", "MacAddress": "02:42:ac:12:00:02", "IPv4Address": "172.xx.x.2/16", "IPv6Address": "fc00:f853:ccd:e793::2/64" } }, "Options": { "com.docker.network.bridge.enable_ip_masquerade": "true", "com.docker.network.driver.mtu": "1500" }, "Labels": {} } ] -
Configure the Zipkin tracing cluster with the IP address that was assigned in the previous step. In this example, the Zipkin cluster is assigned the
172.18.0.2IP address. -
Open Zipkin on your local machine.
Step 2. Configure the Zipkin tracing cluster in Gloo Gateway
Zipkin uses a dedicated tracing cluster where tracing information is sent to. The name of the tracing cluster must be set in the Envoy bootstrap configuration for Envoy to know where to send the information to. The following example shows how you can configure the Zipkin tracing cluster by using Gloo Gateway or updating the Envoy bootstrap configuration directly.
Option 1: Install Gloo Gateway with Zipkin tracing
Use the Gloo Gateway installation Helm chart template to configure the Zipkin tracing platform. Gloo Gateway automatically determines the updates that must be made to apply the Zipkin configuration in your Envoy proxies.
-
Create a
values.yamlfile and add your Zipkin configuration. In the following example, the Zipkin cluster is calledzipkin. Replace<zipkin_container_IP_address>with the value that you retrieved in Step 1: Set up Zipkin locally, such as172.xx.x.2.gatewayProxies: gatewayProxy: tracing: cluster: - name: zipkin connect_timeout: 1s type: STRICT_DNS load_assignment: cluster_name: zipkin endpoints: - lb_endpoints: - endpoint: address: socket_address: address: <zipkin_container_IP_address> port_value: 9411 -
Install Gloo Gateway with your Zipkin configuration.
helm install gloo gloo/gloo --namespace gloo-system --create-namespace -f values.yaml
Option 2: Update the Envoy configmap directly
Add the Envoy code that you want to apply to a Kubernetes configmap and restart the proxy deployments.
-
Edit the Envoy proxy configuration.
kubectl edit configmap -n gloo-system gateway-proxy-envoy-config -
Enter the Zipkin tracing changes. Replace
<zipkin_container_IP_address>with the value that you retrieved in Step 1: Set up Zipkin locally, such as172.xx.x.2.apiVersion: v1 kind: ConfigMap data: envoy.yaml: node: cluster: gateway id: "{{.PodName}}{{.PodNamespace}}" metadata: role: "{{.PodNamespace}}~gateway-proxy" static_resources: clusters: - name: xds_cluster connect_timeout: 5.000s load_assignment: cluster_name: xds_cluster endpoints: - lb_endpoints: - endpoint: address: socket_address: address: gloo port_value: 9977 http2_protocol_options: {} type: STRICT_DNS - name: zipkin connect_timeout: 1s type: STRICT_DNS load_assignment: cluster_name: zipkin endpoints: - lb_endpoints: - endpoint: address: socket_address: address: <zipkin_container_IP_address> port_value: 9411 -
Apply the updated Envoy config. For Envoy to pick up the new config, you need to restart the Envoy proxy deployment.
kubectl rollout restart deployment gateway-proxy
Step 3. Configure Zipkin as the tracing provider for a listener
After you configure the tracing cluster, you can now set Zipkin as the tracing platform for a listener in your gateway. To do that, you can either update the gateway or provide the Envoy code in a Kubernetes configmap. Then, apply this configmap by manually restarting the Envoy proxies.
When you choose to manually update the Envoy proxies with a configmap, you can apply the updated configuration to a static listener that is defined in the Envoy bootstrap config only. If you want to configure a tracing provider for dynamically created listeners, you must update the gateway.
Option 1: Dynamic listeners with Gloo Gateway
You can enable tracing on a listener-by-listener basis. To find an example tracing listener configuration for your gateway, see the tracing listener docs. In this example, the Zipkin cluster that you created in step 1 is referenced in the clusterName field.
Option 2: Static listeners with configmaps
-
Edit the Envoy proxy configuration.
kubectl edit configmap -n gloo-system gateway-proxy-envoy-config -
Enter the tracing provider changes.
apiVersion: v1 kind: ConfigMap data: envoy.yaml: node: cluster: gateway id: "{{.PodName}}{{.PodNamespace}}" metadata: role: "{{.PodNamespace}}~gateway-proxy" static_resources: listeners: - name: prometheus_listener address: socket_address: address: 0.0.0.0 port_value: 8081 filter_chains: - filters: - name: envoy.filters.network.http_connection_manager typed_config: "@type": type.googleapis.com/envoy.extensions.filters.network.http_connection_manager.v3.HttpConnectionManager codec_type: AUTO stat_prefix: prometheus route_config: # collapsed for brevity http_filters: - name: envoy.filters.http.router tracing: provider: name: envoy.tracers.zipkin typed_config: "@type": "type.googleapis.com/envoy.config.trace.v3.ZipkinConfig" collector_cluster: zipkin collector_endpoint: "/api/v2/spans" collector_endpoint_version: HTTP_JSON -
Apply the updated Envoy config. For Envoy to pick up the new config, you need to restart the Envoy proxy deployment.
kubectl rollout restart deployment [deployment_name]
This provider configuration will only be applied to the static listeners that are defined in the bootstrap config. If you need to support tracing on dynamically created listeners, see Option 1: Dynamic listeners with Gloo Gateway.
Step 4. Optional: Annotate routes with tracing descriptors
In order to associate a trace with a route, it can be helpful to annotate your routes with a descriptive name. You can add the name to the virtual service directly, or use the x-envoy-decorator-operation Envoy header in your request. If a name is set in both, the name in the header takes precedence.
The following steps show how to add the name to the virtual service in Gloo Gateway.
-
List the virtual services in the
gloo-systemnamespace and select the one that you want to edit.kubectl get virtualservice -n gloo-system -
Edit the virtual service.
kubectl edit virtualservice -n gloo-system <virtual-service-name> -
Enter the name for the route that you want to associate your trace with in the
routeDescriptorfield.apiVersion: gateway.solo.io/v1 kind: VirtualService metadata: # omitted for brevity spec: virtualHost: domains: - '*' routes: - matchers: - exact: /abc routeAction: single: upstream: name: my-upstream namespace: gloo-system options: tracing: routeDescriptor: <route-descriptor-name> prefixRewrite: / status: # omitted for brevity
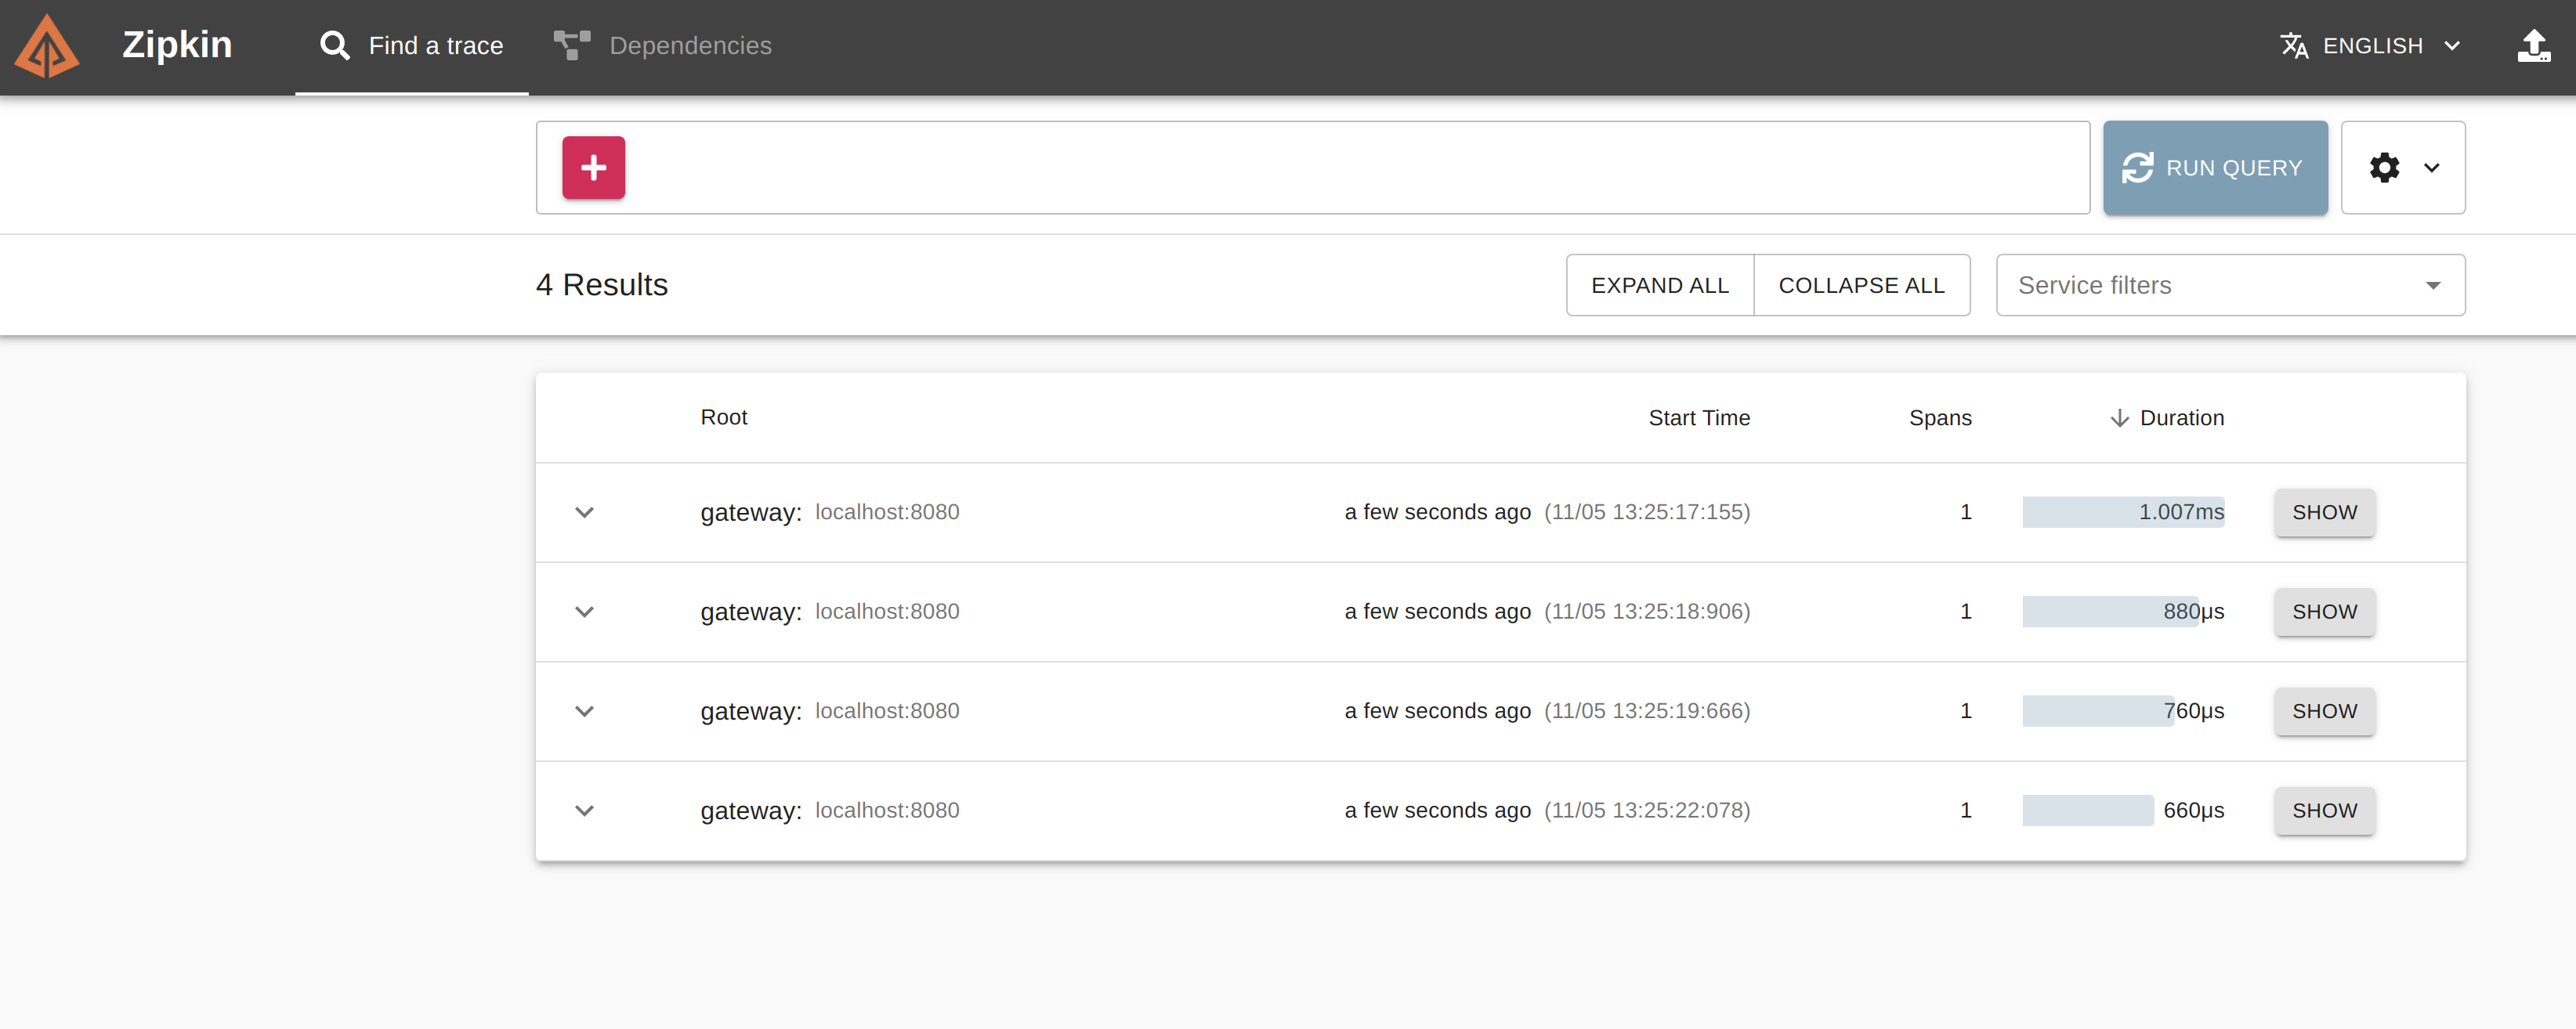
Step 5. Initiate a request and view traces
-
Send a request to your app.
curl localhost:31500/abc -
Open Zipkin on your local machine and review the traces.