Observability
Gloo Gateway default prometheus server and grafana instance are not meant to be used as-is in production. Please provide your own instance or configure the provided one with production values
Gloo Gateway exposes a lot of metrics from both the data plane (Envoy) as well as the control plane components. These metrics are available in Open Source Gloo Gateway, and can be scraped into a standard metrics backend like Prometheus.
Enterprise Gloo Gateway comes with a few extra enhancements around observability. First, it installs by default with a prometheus server to scrape all of the Gloo Gateway metrics, and a Grafana instance to provide dashboards from those metrics. Alternatively, customers may wish to use their own Prometheus and Grafana deployments and integrate Gloo Gateway with those.
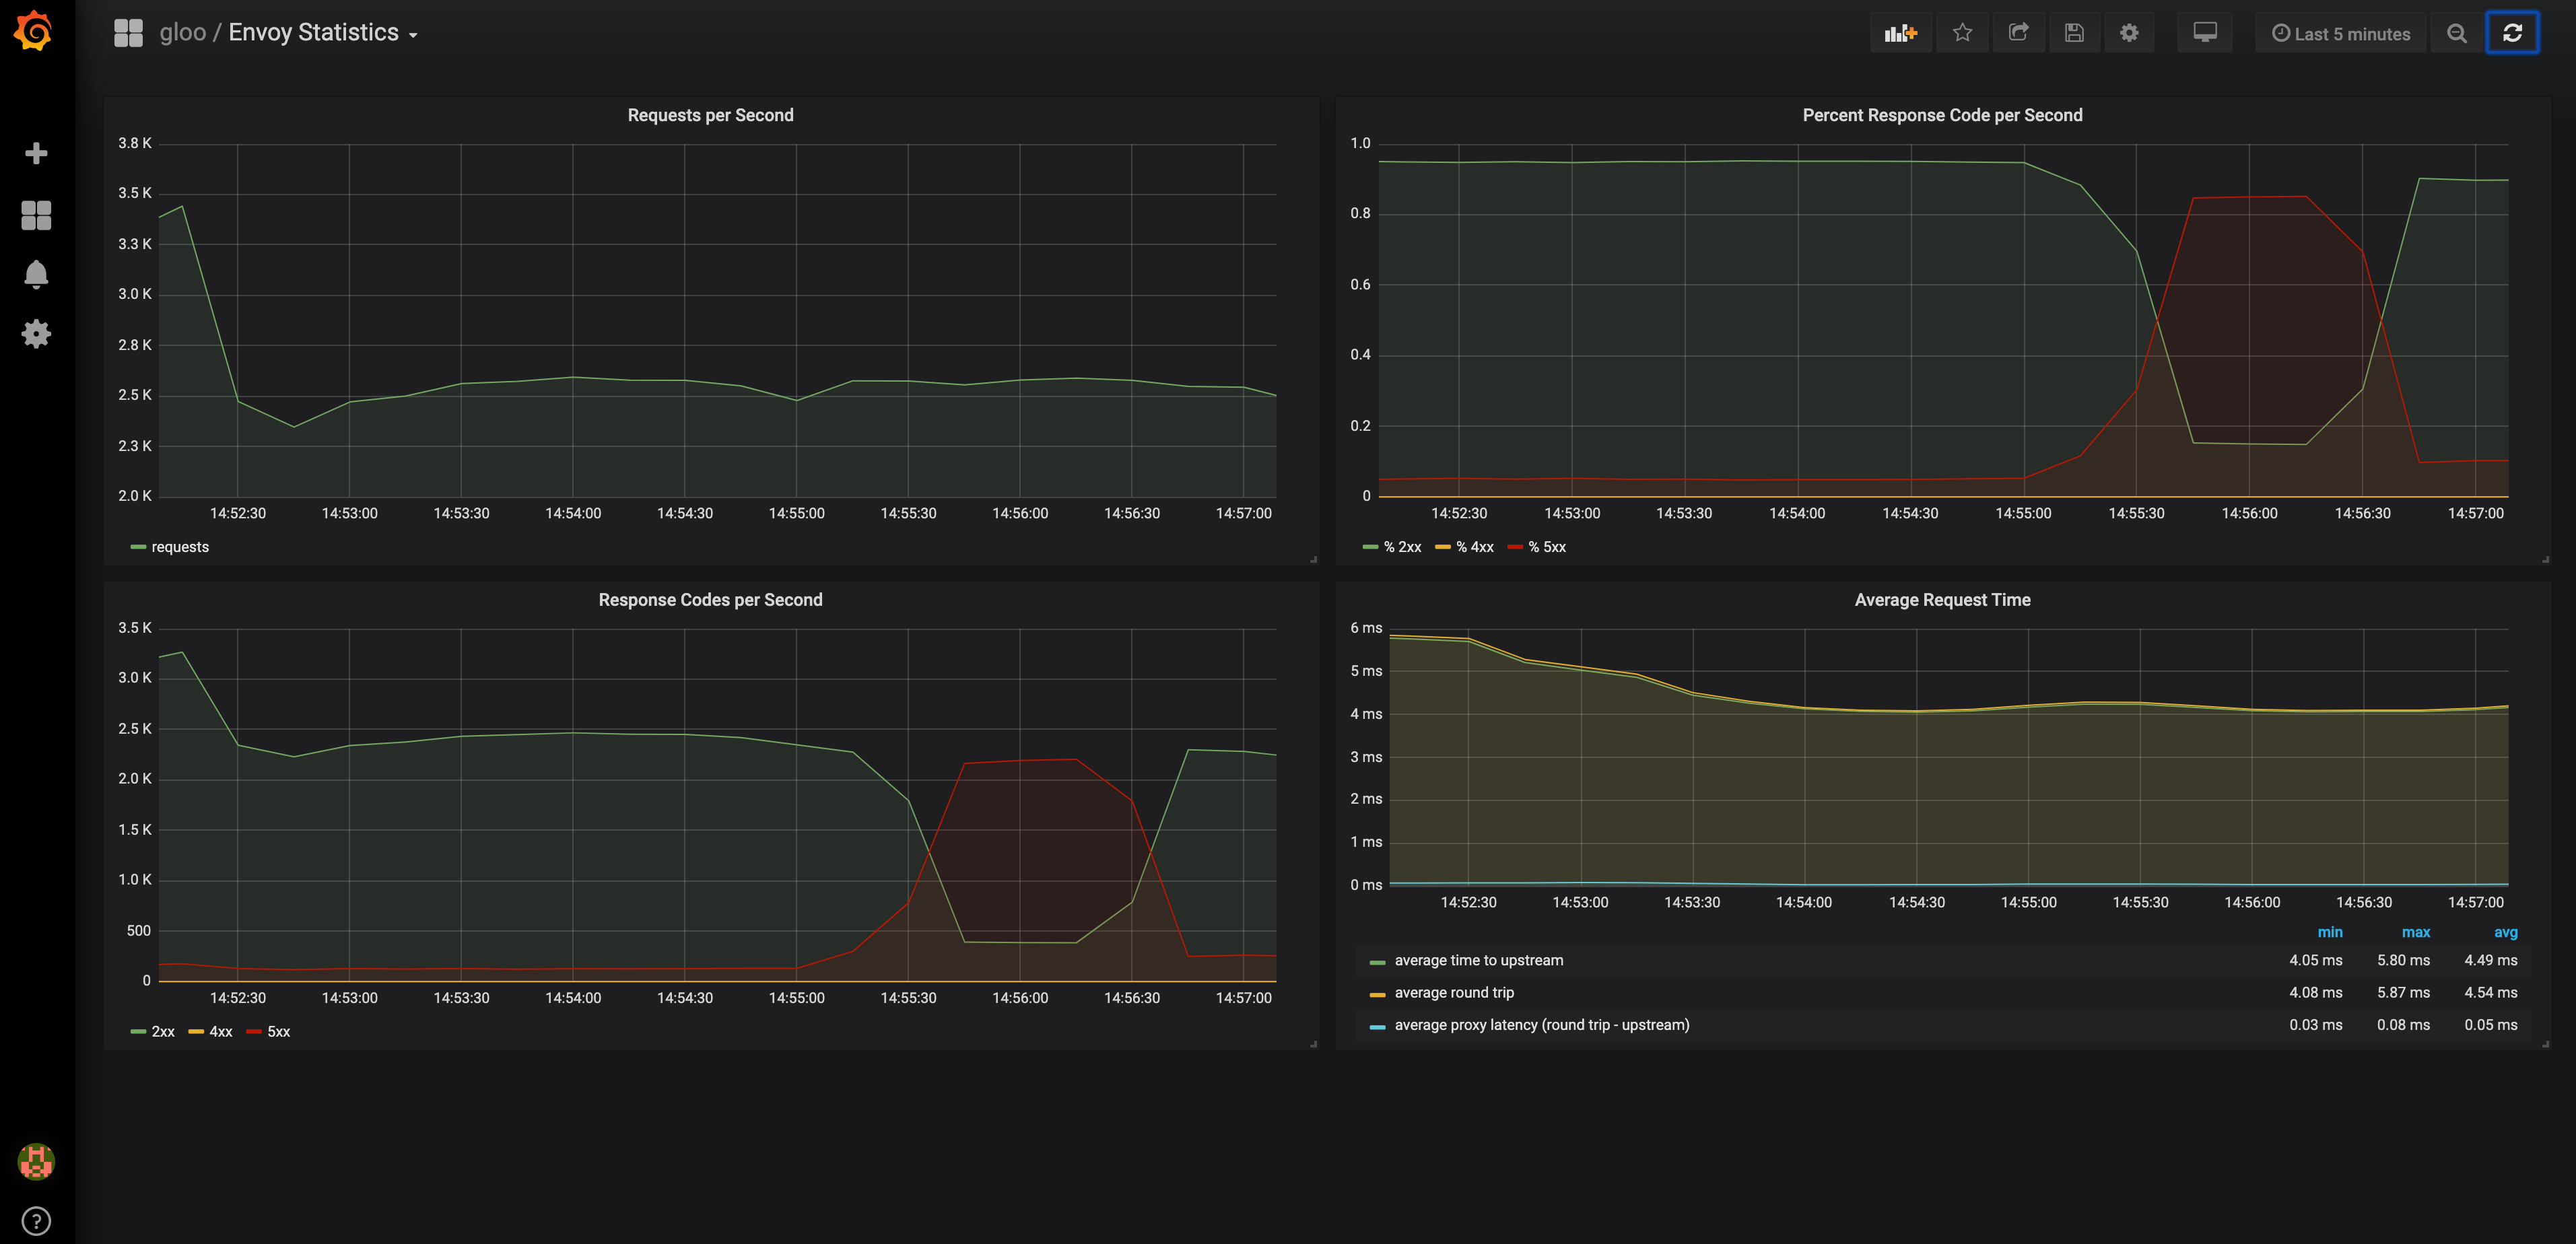
Gloo Gateway Enterprise comes with a built-in grafana dashboard to show a high-level health of the Envoy proxy,
and also comes with a component called observability that dynamically creates a new Grafana dashboard for each Gloo Gateway Upstream.
-
Grafana: How to configure Grafana and consume the dashboards generated by Gloo Gateway Enterprise
-
Prometheus: Info about Gloo Gateway's Prometheus Instance
-
Tracing: Sample request traces to monitor the traffic and health of your Gloo Gateway environment.
Example dashboard that Gloo Gateway provides, showing a service going down briefly and then recovering (click to enlarge):