Zero-downtime Gateway rollout
Configure Gloo Gateway and your load balancer to minimize downtime when bouncing Envoy proxies.
Principles
With distributed systems come reliability patterns that are best to implement.
As services cannot guess the state of their neighborhood, they must implement some mechanisms like health checks, retries, failover, and more.
If you want to know more about theses reliability principles, please watch this video:
To implement these principles, you can configure health checking for your load balancer, the Kubernetes service for the Envoy proxy, and the Envoy proxy itself.
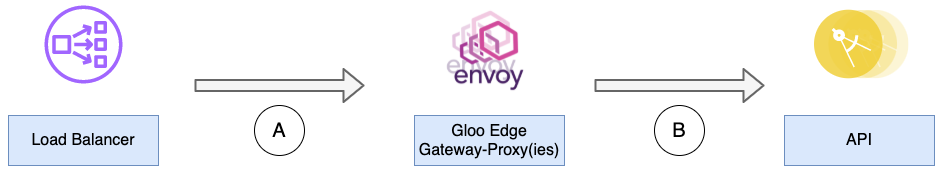
From right to left:
- B - Envoy is not immediately aware of the state of the Kubernetes liveness & readiness probes that are set on an upstream API. So, here are two recommendations:
- The API should start failing health checks once it receives a SIGTERM signal, and also it should start draining connections gracefully.
- Envoy should be configured with health checks, retries, and outlier detection on these upstreams.
- A - Depending on your load balancer and network setup, the health check can reach either the Kubernetes nodes or the Kubernetes pods. Keep in mind these rules of thumb:
- Cloud LB health checks to the same node should end in the same pod. You can use either a DaemonSet with host port or you use Kubernetes affinity policies to have at most one Envoy proxy on each node, with the
ExternalTrafficPolicy: localsetting in the Envoy proxy deployment. - Configure the health check filter on Envoy. More details below and also in the dedicated documentation page. Configure the readiness probe accordingly.
- Enable the shutdown hook on the Envoy pods. Configure this hook to fail LB health checks once it gets a termination signal
- Cloud LB health checks to the same node should end in the same pod. You can use either a DaemonSet with host port or you use Kubernetes affinity policies to have at most one Envoy proxy on each node, with the
This guide shows how to configure these different elements and demonstrates the benefits during a gateway rollout.
Configuring the Gloo Gateway Proxies
Upstream options
As explained above, it’s best to have your upstream API start failing health checks once it receives a termination signal. From the Envoy side, you can add retries, health checks and outlier detection as shown below:
apiVersion: gloo.solo.io/v1
kind: Upstream
metadata:
  name: default-httpbin-8000
  namespace: gloo-system
spec:
  ...
  # ----- Health Check (a.k.a. active health checks) -------
  healthChecks:
    - healthyThreshold: 1
      httpHealthCheck:
        path: /status/200
      interval: 2s
      noTrafficInterval: 2s
      timeout: 1s
      unhealthyThreshold: 2
      reuseConnection: false
  # ----- Outlier Detection  (a.k.a. passive health checks) ------
  outlierDetection:
    consecutive5xx: 3
    maxEjectionPercent: 100
    interval: 10s
  # ----- Help with consistency between the Kubernetes control-plane and the Gloo control-plane ------
  ignoreHealthOnHostRemoval: true
In the previous example, Upstream pings are issued every 2 seconds. You might find that this active health check setting is too frequent and generates excessive traffic. If so, consider a health check with a longer interval, such as the following example.
  # ----- Health Check (a.k.a. active health checks) -------
  healthChecks:
    - healthyThreshold: 1
      httpHealthCheck:
        path: /status/200
      interval: 15s
      noTrafficInterval: 10s
      timeout: 5s
      unhealthyThreshold: 3
      reuseConnection: false
```
Retries are configured on VirtualServices at the route level:
apiVersion: gateway.solo.io/v1
kind: VirtualService
metadata:
  name: httpbin
  namespace: gloo-system
spec:
  virtualHost:
    domains:
      ...
    routes:
    - matchers:
        ...
      routeAction:
        ...
    options:
      # -------- Retries --------
      retries:
        retryOn: 'connect-failure,5xx'
        numRetries: 3
        perTryTimeout: '3s'
Envoy Listener options
First, you want to know when exactly Gloo Gateway is ready to route client requests. They are several conditions, and the most important one is to have a VirtualService correctly configured.
While glooctl check will help you check some fundamentals, this command will not show if the gateway-proxy is listening to new connections. Only its internal engine - Envoy - knows about that.
It’s fair to quickly remember here that Envoy can be listening to multiple hosts and ports simultaneously. For that to happen, you need to define different VirtualServices and Gateways. If you want to better understand how these objects work together, please check out this article.
Once you have these Gateways and VirtualServices configured, Gloo Gateway will generate Proxy Custom Resources that will, in turn, generate Envoy Listeners, Routes, and more. From this point, Envoy is ready to accept new connections.
The goal here is to know when these Envoy Listeners are ready. Luckily, Envoy comes with a handy Health Check filter which helps with that.
For example, you can add the following healthCheck setting to your Helm configuration file. Then, upgrade your Helm installation of Gloo Gateway to set up health checking for the Envoy proxy.
gloo:
  gatewayProxies:
    gatewayProxy:
      gatewaySettings:
        customHttpsGateway:
          options:
            healthCheck:
              # define a custom path that is available when the Gateway (Envoy listener) is actually listening
              path: /envoy-hc
Configuring the Kubernetes probes
As explained above, you need have Envoy to handle shutdown signals gracefully. For that, you leverage the Kubernetes PreStop hook as shown in the following example:
gloo:
  gatewayProxies:
    gatewayProxy:
      podTemplate:
        # graceful shutdown: Envoy will fail health checks but only stop after 7 seconds
        terminationGracePeriodSeconds: 7
        gracefulShutdown:
          enabled: true
          sleepTimeSeconds: 5
        probes: true
        # the gateway-proxy pod is ready only when a Gateway (Envoy listener) is listening
        customReadinessProbe:
          httpGet:
            scheme: HTTPS
            port: 8443
            path: /envoy-hc
          failureThreshold: 2
          initialDelaySeconds: 5
          periodSeconds: 5
Configuring a NLB
In this guide, you will configure an AWS Network Load Balancer (NLB). You will need the AWS Load Balancer Controller (ALBC), which brings the annotations-driven configuration to the next level. For more information, see this article: Integration with AWS ELBs
With the ALBC (AWS Load Balancer Controller), you will need these special annotations so that the NLB is internet-facing and uses the instance mode:
# ALBC specifics
service.beta.kubernetes.io/aws-load-balancer-type: "external" # https://kubernetes-sigs.github.io/aws-load-balancer-controller/v2.2/guide/service/nlb/#configuration
service.beta.kubernetes.io/aws-load-balancer-scheme: internet-facing # https://kubernetes-sigs.github.io/aws-load-balancer-controller/v2.2/guide/service/nlb/
service.beta.kubernetes.io/aws-load-balancer-nlb-target-type: "instance" # https://kubernetes-sigs.github.io/aws-load-balancer-controller/v2.2/guide/service/nlb/#instance-mode_1
Here is an example of how to configure the LB health checks so that they target an Envoy listener with the health check filter enabled:
# Health checks
service.beta.kubernetes.io/aws-load-balancer-healthcheck-healthy-threshold: "2" # Number of successive successful health checks required for a backend to be considered healthy for traffic. Values can be 2-20
service.beta.kubernetes.io/aws-load-balancer-healthcheck-unhealthy-threshold: "2" # Number of unsuccessful health checks required for a backend to be considered unhealthy for traffic. Values can be 2-20
service.beta.kubernetes.io/aws-load-balancer-healthcheck-interval: "10" # 10s or 30s
service.beta.kubernetes.io/aws-load-balancer-healthcheck-path: "/envoy-hc" # Envoy HC filter
service.beta.kubernetes.io/aws-load-balancer-healthcheck-protocol: "HTTPS" # https://github.com/kubernetes/cloud-provider-aws/blob/ddfe0df3ce630bbf01ea2368c9ad816429e35c2b/pkg/providers/v1/aws.go#L189
service.beta.kubernetes.io/aws-load-balancer-healthcheck-port: "traffic-port" # https://github.com/kubernetes/cloud-provider-aws/blob/ddfe0df3ce630bbf01ea2368c9ad816429e35c2b/pkg/providers/v1/aws.go#L196
service.beta.kubernetes.io/aws-load-balancer-healthcheck-timeout: "2" # 2s is the minimum and is recommended to detect failure quickly
Demo
The demo is based on the VirtualService and Upstream described above in this article. Update your Helm configuration to enable the Envoy health checks and the extra annotations for an ALBC.
gloo:
  gatewayProxies:
    gatewayProxy:
      kind:
        deployment:
          replicas: 2

      service:
        httpPort: 80
        httpsFirst: true
        httpsPort: 443
        type: LoadBalancer
        externalTrafficPolicy: Local
        extraAnnotations:
          ## /!\ WARNING /!\
          ## values below will only work with the AWS Load Balancer controller. Not with the default k8s in-tree controller

          # LB
          # service.beta.kubernetes.io/aws-load-balancer-type: "nlb"
          service.beta.kubernetes.io/aws-load-balancer-type: "external" # https://kubernetes-sigs.github.io/aws-load-balancer-controller/v2.2/guide/service/nlb/#configuration
          service.beta.kubernetes.io/aws-load-balancer-scheme: internet-facing # https://kubernetes-sigs.github.io/aws-load-balancer-controller/v2.2/guide/service/nlb/
          service.beta.kubernetes.io/aws-load-balancer-nlb-target-type: "instance" # https://kubernetes-sigs.github.io/aws-load-balancer-controller/v2.2/guide/service/nlb/#instance-mode_1

          service.beta.kubernetes.io/aws-load-balancer-additional-resource-tags: "x-via-lb-type=external"
          service.beta.kubernetes.io/aws-load-balancer-ip-address-type: "ipv4" # service.beta.kubernetes.io/aws-load-balancer-ip-address-type: ipv4

          # LB attributes
          service.beta.kubernetes.io/aws-load-balancer-attributes: "load_balancing.cross_zone.enabled=false"

          # Target group attributes
          service.beta.kubernetes.io/aws-load-balancer-target-group-attributes: "deregistration_delay.timeout_seconds=15,deregistration_delay.connection_termination.enabled=true"

          # Backend
          service.beta.kubernetes.io/aws-load-balancer-backend-protocol: "ssl"

          # Health checks
          service.beta.kubernetes.io/aws-load-balancer-healthcheck-healthy-threshold: "2" # 2-20
          service.beta.kubernetes.io/aws-load-balancer-healthcheck-unhealthy-threshold: "2" # 2-10
          service.beta.kubernetes.io/aws-load-balancer-healthcheck-interval: "10" # 10 or 30
          service.beta.kubernetes.io/aws-load-balancer-healthcheck-path: "/envoy-hc"
          service.beta.kubernetes.io/aws-load-balancer-healthcheck-protocol: "HTTPS"
          service.beta.kubernetes.io/aws-load-balancer-healthcheck-port: "traffic-port"
          service.beta.kubernetes.io/aws-load-balancer-healthcheck-timeout: "6" # 6 is the minimum

      # set up node anti-affinity for the gateway-proxies
      antiAffinity: true

      podTemplate:
        terminationGracePeriodSeconds: 7 # kill the pod after this delay, gives room to the preStop hook
        gracefulShutdown:
          enabled: true
          sleepTimeSeconds: 5 # tells Envoy to fail healthchecks and sleep 5 seconds
        probes: true
        customReadinessProbe:
          httpGet:
            scheme: HTTPS
            port: 8443
            path: /envoy-hc
          failureThreshold: 2
          initialDelaySeconds: 5
          periodSeconds: 5

      # define the path for the Envoy health check filter
      gatewaySettings:
        customHttpsGateway:
          options:
            healthCheck:
              path: /envoy-hc
            httpConnectionManagerSettings:
              useRemoteAddress: true
Long-lived test:
hey -disable-keepalive -c 4 -q 10 --cpus 1 -z 30m -m GET -t 1 $(glooctl proxy url --port https)/headers
Testing a deployment rollout restart
Gateway rollout:
kubectl -n gloo-system rollout restart deploy/gateway-proxy
Grafana dashboards
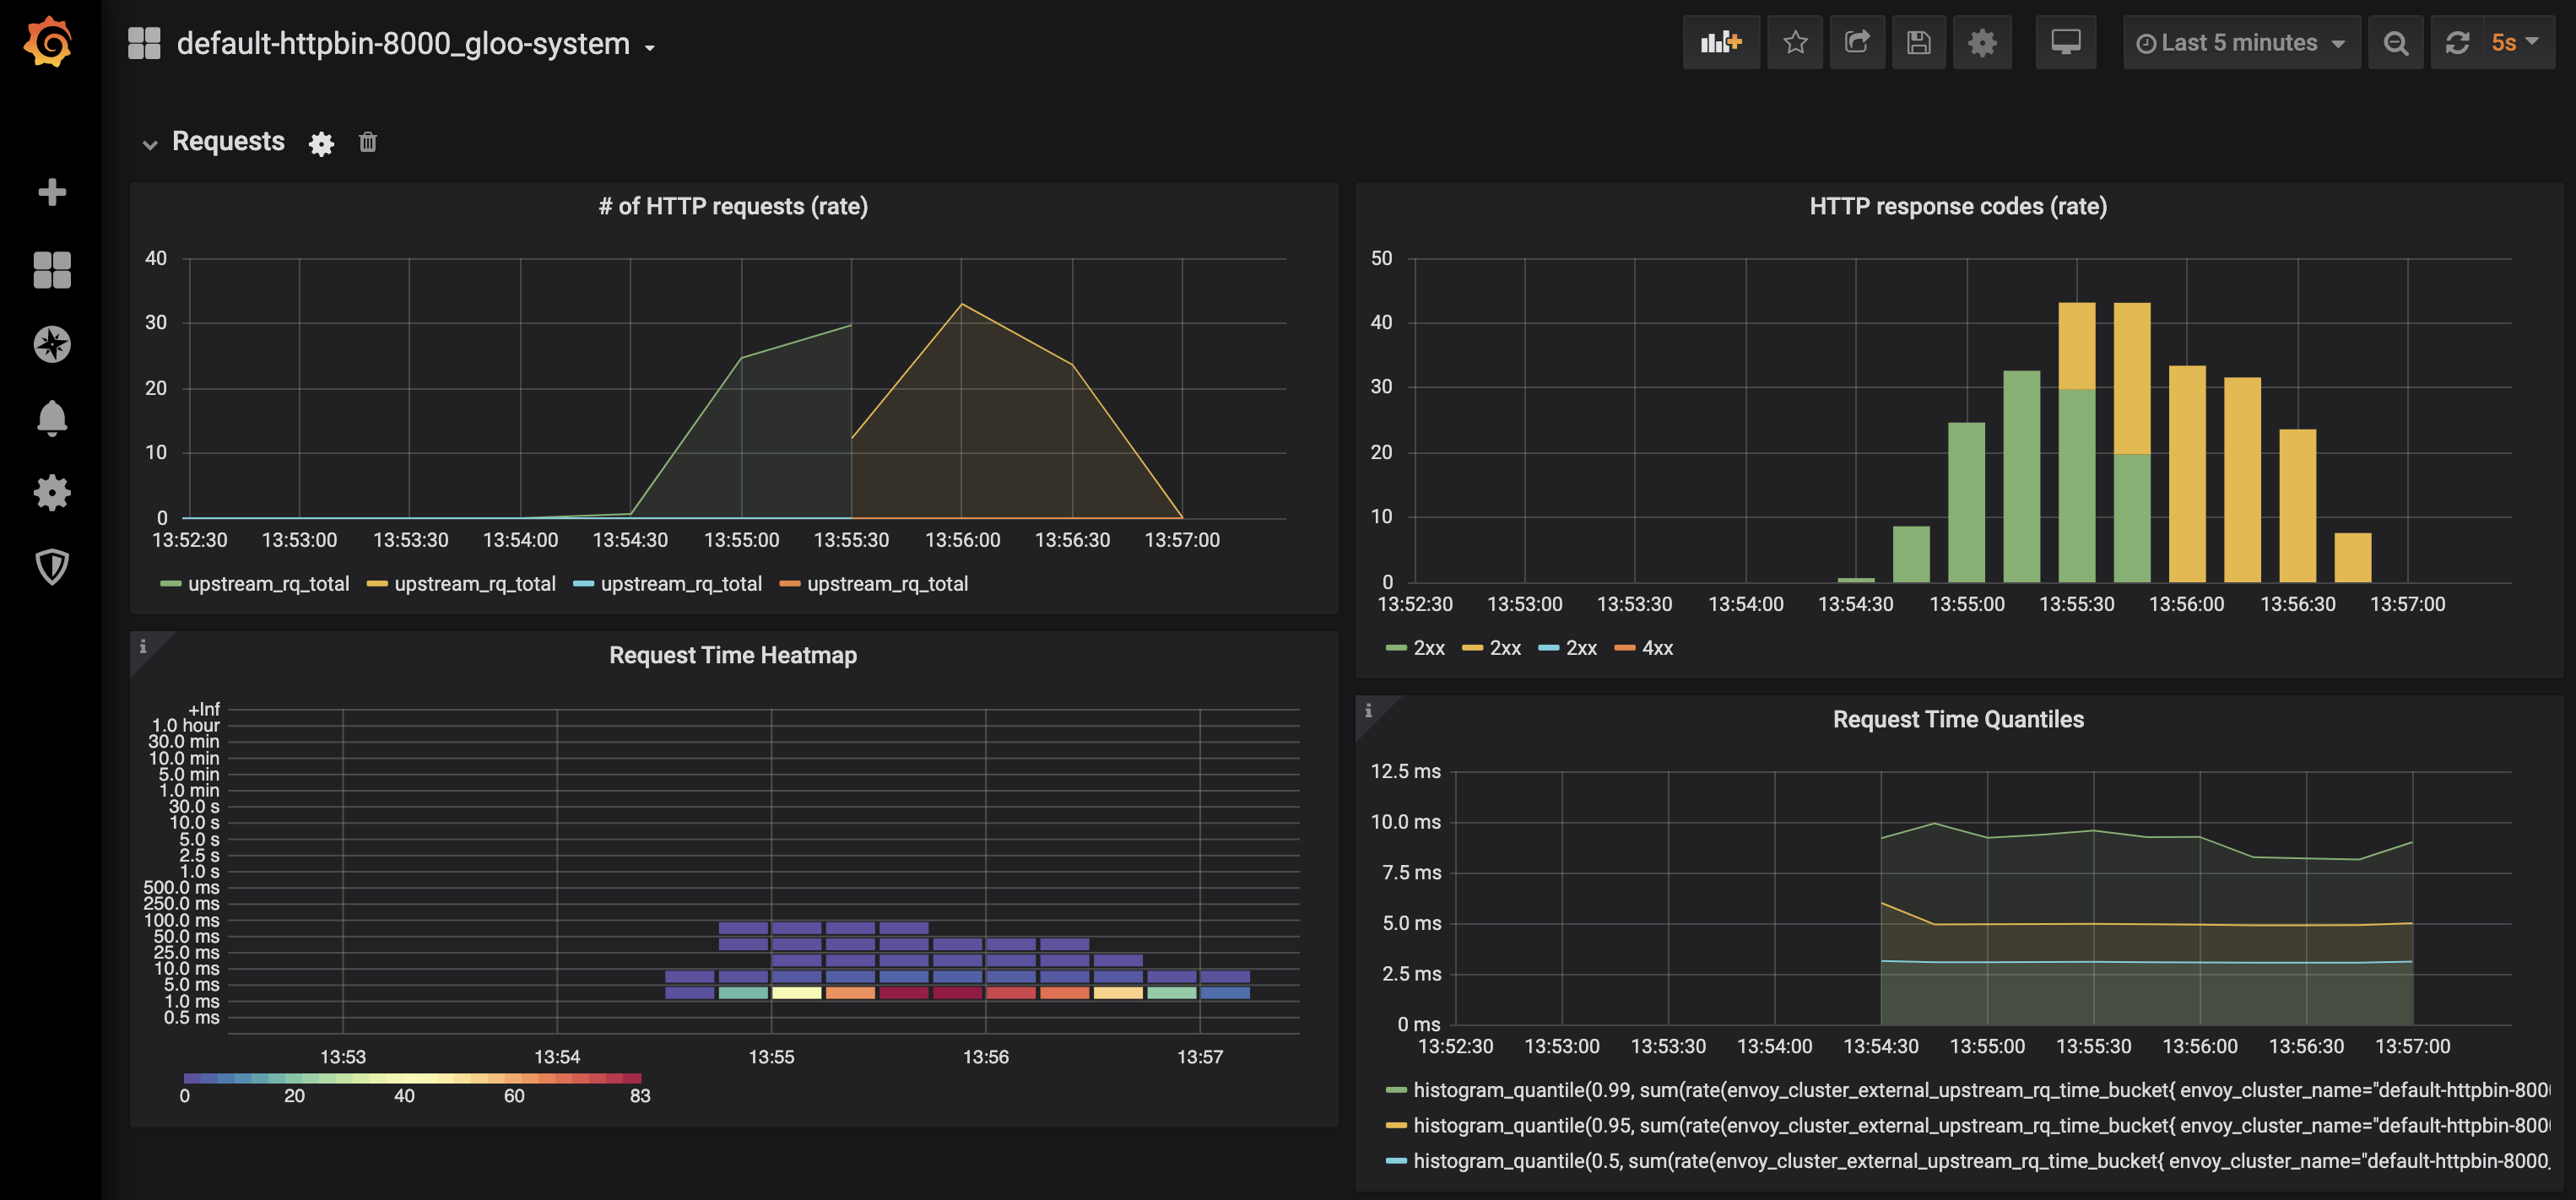
Tests results
Summary:
  Total:	94.9843 secs
  Slowest:	0.1653 secs
  Fastest:	0.0709 secs
  Average:	0.0830 secs
  Requests/sec:	39.9645

  Total data:	926224 bytes
  Size/request:	244 bytes

Response time histogram:
  0.071 [1]	|
  0.080 [1475]	|■■■■■■■■■■■■■■■■■■■■■■■■■■■■■
  0.090 [2005]	|■■■■■■■■■■■■■■■■■■■■■■■■■■■■■■■■■■■■■■■■
  0.099 [233]	|■■■■■
  0.109 [20]	|
  0.118 [15]	|
  0.128 [4]	|
  0.137 [12]	|
  0.146 [20]	|
  0.156 [10]	|
  0.165 [1]	|


Latency distribution:
  10% in 0.0768 secs
  25% in 0.0789 secs
  50% in 0.0814 secs
  75% in 0.0848 secs
  90% in 0.0887 secs
  95% in 0.0928 secs
  99% in 0.1337 secs

Details (average, fastest, slowest):
  DNS+dialup:	0.0540 secs, 0.0709 secs, 0.1653 secs
  DNS-lookup:	0.0000 secs, 0.0000 secs, 0.0000 secs
  req write:	0.0001 secs, 0.0000 secs, 0.0016 secs
  resp wait:	0.0286 secs, 0.0234 secs, 0.1054 secs
  resp read:	0.0001 secs, 0.0000 secs, 0.0313 secs

Status code distribution:
  [200]	3796 responses
The results show good results and no errors.
Testing Helm upgrade
You can observe similar nice results during an upgrade:
helm upgrade -n gloo-system gloo glooe/gloo-ee --version=
1.18.0
Grafana dashboards
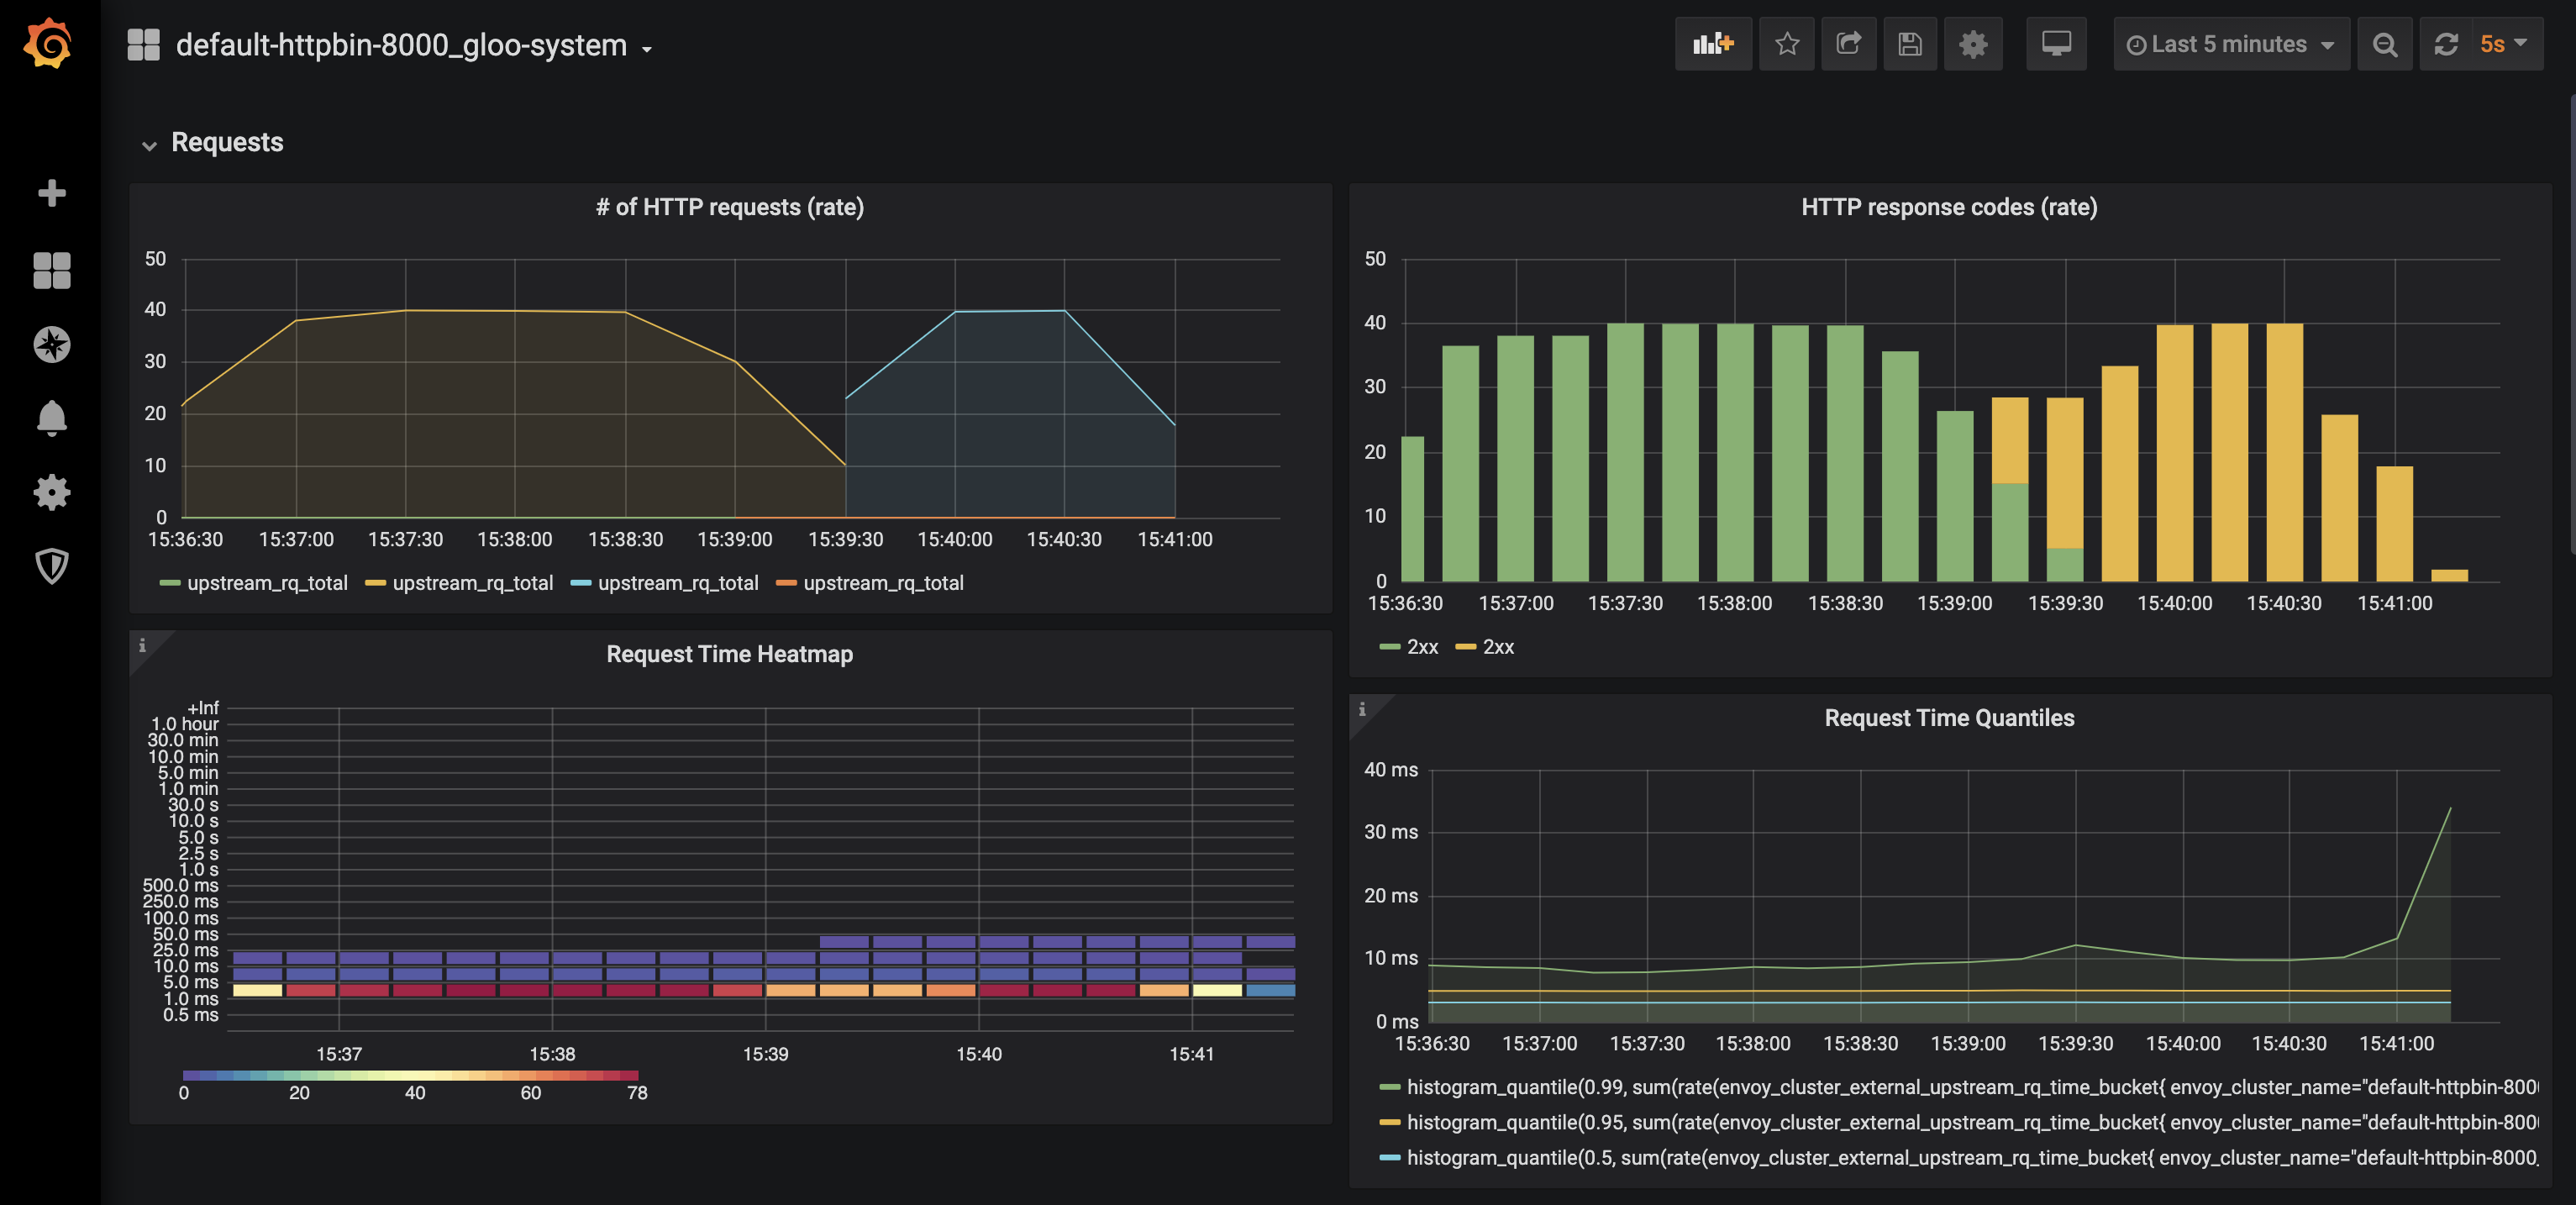
Tests results
Summary:
  Total:	272.1894 secs
  Slowest:	0.5088 secs
  Fastest:	0.0699 secs
  Average:	0.0849 secs
  Requests/sec:	38.1793

  Total data:	2525400 bytes
  Size/request:	244 bytes

Response time histogram:
  0.070 [1]	|
  0.114 [10163]	|■■■■■■■■■■■■■■■■■■■■■■■■■■■■■■■■■■■■■■■■
  0.158 [117]	|
  0.202 [14]	|
  0.245 [14]	|
  0.289 [8]	|
  0.333 [12]	|
  0.377 [17]	|
  0.421 [0]	|
  0.465 [0]	|
  0.509 [4]	|


Latency distribution:
  10% in 0.0769 secs
  25% in 0.0794 secs
  50% in 0.0822 secs
  75% in 0.0862 secs
  90% in 0.0910 secs
  95% in 0.0955 secs
  99% in 0.1409 secs

Details (average, fastest, slowest):
  DNS+dialup:	0.0557 secs, 0.0699 secs, 0.5088 secs
  DNS-lookup:	0.0000 secs, 0.0000 secs, 0.0000 secs
  req write:	0.0001 secs, 0.0000 secs, 0.0015 secs
  resp wait:	0.0290 secs, 0.0231 secs, 0.2643 secs
  resp read:	0.0001 secs, 0.0000 secs, 0.0034 secs

Status code distribution:
  [200]	10350 responses

Error distribution:
  [28]	Get "https://18.194.157.177/headers": context deadline exceeded (Client.Timeout exceeded while awaiting headers)
  [14]	Get "https://18.194.157.177/headers": dial tcp 18.194.157.177:443: i/o timeout (Client.Timeout exceeded while awaiting headers)
There are a few client-side connection errors left. You can potentially tackle them with a client-side retry logic, or with server-side larger deployments. Also, advanced policies like PodDisruptionBudget can help to reduce this kind of downtime:
gloo:
  gatewayProxies:
    gatewayProxy:
      kind:
        deployment:
          replicas: 5
      podDisruptionBudget:
        maxUnavailable: 1