Prepare for production
The built-in Prometheus server is a great way to gain insight into the network traffic that enters Gloo Gateway. However, the pod is not set up with persistent storage and metrics are lost when the pod restarts or when the deployment is scaled down. A lot of organizations also run their own Prometheus-compatible solution or time series database that is hardened for production and integrates with other applications that might exist outside of the cluster.
To build a production-level Prometheus setup, you can choose between the following options:
- Replace the built-in Prometheus server with your own instance
- Recommended: Federate metrics with recording rules and provide them to your production monitoring instance
To read more about each option, see Best practices for collecting metrics in production
Replace the built-in Prometheus server with your own instance
In this setup, you disable the built-in Prometheus server and configure Gloo to use your production Prometheus instance instead.
-
Configure Gloo to disable the default Prometheus instance and instead connect to your custom Prometheus server. Make sure that the instance runs Prometheus version 2.16.0 or later. In the
prometheusUrlfield, enter the Prometheus URL that your instance is exposed on, such ashttp://kube-prometheus-stack-prometheus.monitoring:9090. You can get this value from the--web.external-urlfield in your Prometheus Helm values file or by selecting Status > Command-Line-Flags from the Prometheus UI. Do not use the FQDN for the Prometheus URL.helm upgrade --install gloo-platform gloo-platform/gloo-platform \ --namespace gloo-mesh \ --version $GLOO_VERSION \ --values gloo-gateway-single.yaml \ --set common.cluster=$CLUSTER_NAME \ --set licensing.glooGatewayLicenseKey=$GLOO_GATEWAY_LICENSE_KEY \ --set prometheus.enabled=false \ --set common.prometheusUrl=<Prometheus_server_URL_and_port>If you installed Gloo Gateway using the
gloo-mesh-enterpise,gloo-mesh-agent, and other included Helm charts, or by usingmeshctlversion 2.2 or earlier, these Helm charts are considered legacy. Migrate your legacy installation to the newgloo-platformHelm chart.helm upgrade --install gloo-mgmt gloo-mesh-enterprise/gloo-mesh-enterprise \ --namespace gloo-mesh \ --version $GLOO_VERSION \ --values values-mgmt-plane-env.yaml \ --set prometheus.enabled=false \ --set prometheusUrl=<Prometheus_server_URL_and_port> \ --set glooGatewayLicenseKey=${GLOO_GATEWAY_LICENSE_KEY} \ --set global.cluster=$CLUSTER_NAMEMake sure to include your Helm values when you upgrade either as a configuration file in the
–valuesflag or with–setflags. Otherwise, any previous custom values that you set might be overwritten. In single cluster setups, this might mean that your Gloo agent and ingress gateways are removed. To get your current values, such as for a release namedgloo-platform, you can runhelm get values gloo-platform -n gloo-mesh > gloo-gateway-single.yaml. For more information, see Get your Helm chart values in the upgrade guide. -
Configure your Prometheus server to scrape metrics from the Gloo management server endpoint
gloo-mesh-mgmt-server-admin.gloo-mesh:9091. This setup might vary depending on the Prometheus server that you use. For example, if you use the Prometheus Community Chart, update the Helmvalues.yamlfile as follows to scrape metrics from the Gloo management server.serverFiles: prometheus.yml: scrape_configs: - job_name: gloo-mesh scrape_interval: 15s scrape_timeout: 10s static_configs: - targets: - gloo-mesh-mgmt-server-admin.gloo-mesh:9091
Recommended: Federate metrics with recording rules and provide them to your production monitoring instance
In this setup, you inject recording rules in to the built-in Prometheus server in Gloo to federate the metrics that you want and reduce high cardinality labels. Then, you set up another Prometheus instance in the Gloo management cluster to scrape the federated metrics. You can optionally forward the federated metrics to a Prometheus-compatible solution or a time series database that sits outside of your Gloo management cluster and is hardened for production.
-
Get the configuration of the built-in Prometheus server in Gloo and save it to a local file on your machine.
kubectl get configmap prometheus-server -n gloo-mesh -o yaml > config.yaml -
Review the metrics that are sent to the built-in Prometheus server by default.
- Open the Prometheus dashboard.
- Open your browser and connect to localhost:9091/.
- Decide on the subset of metrics that you want to federate.
-
Add a recording rule to the configmap of your Gloo Prometheus instance that you retrieved earlier to define how you want to aggregate the metrics. Recording rules let you precompute frequently needed or computationally expensive expressions. For example, you can remove high cardinality labels and federate only the labels that you need in future dashboards or alert queries. The results are saved in a new set of time series that you can later scrape or send to an external monitoring instance that is hardened for production. With this setup, you can protect your production instance as you send only the metrics that you need. In addition, you use the compute resources in the Gloo management cluster to prepare and aggregate the metrics.
In this example, you use the
istio_requests_totalmetric to record the total number of requests that Gloo Gateway receives. As part of this aggregation, pod labels are removed as they might lead to cardinality issues in certain environments. The result is saved as theworkload:istio_requests_totalmetric to make sure that you can distinguish the originalistio_requests_totalmetric from the aggregated one.
apiVersion: v1 data: alerting_rules.yml: | {} alerts: | {} prometheus.yml: | ... recording_rules.yml: | groups: - name: istio.workload.istio_requests_total interval: 10s rules: - record: workload:istio_requests_total expr: | sum(istio_requests_total{source_workload="istio-ingressgateway"}) by ( source_workload, source_workload_namespace, destination_service, source_app, destination_app, destination_workload, destination_workload_namespace, response_code, response_flags, reporter ) rules: | {} kind: ConfigMap ... -
Deploy another Prometheus instance in the Gloo management cluster to scrape the federated metrics from the Prometheus instance.
- Create the
monitoringnamespace in the Gloo management cluster.kubectl create namespace monitoring - Add the Prometheus community Helm repository.
helm repo add prometheus-community https://prometheus-community.github.io/helm-charts - Install the Prometheus community chart.
helm install kube-prometheus-stack prometheus-community/kube-prometheus-stack --version 30.0.1 -f values.yaml -n monitoring --debug - Verify that the Prometheus pods are running.
kubectl get pods -n monitoring
- Create the
-
Add a service monitor to the Prometheus instance that you just created to scrape the aggregated metrics from the built-in Prometheus instance in Gloo and to expose them on the
/federateendpoint.In the following example, metrics from the built-in Prometheus instance that match the
'workload:(.*)'regex expression are scraped. With the recording rule that you defined earlier,workload:istio_requests_totalis the only metric that matches this criteria. The service monitor configuration also removesworkload:from the metric name so that it is displayed as theistio_requests_totalmetric in Prometheus queries. To access the aggregated metrics that you scraped, you send a request to the/federateendpoint and providematch[]={__name__=<metric>}as a request parameter.apiVersion: monitoring.coreos.com/v1 kind: ServiceMonitor metadata: name: gloo-metrics-federation namespace: monitoring labels: app.kubernetes.io/name: gloo-prometheus spec: namespaceSelector: matchNames: - gloo-mesh selector: matchLabels: app: prometheus endpoints: - interval: 30s scrapeTimeout: 30s params: 'match[]': - '{__name__=~"workload:(.*)"}' path: /federate targetPort: 9090 honorLabels: true metricRelabelings: - sourceLabels: ["__name__"] regex: 'workload:(.*)' targetLabel: "__name__" action: replace -
Access the
/federateendpoint to see the scraped metrics. Note that you must include thematch[]={__name__=<metric>}request parameter to successfully see the aggregated metrics.-
Port forward the Prometheus service so that you can access the Prometheus UI on your local machine.
kubectl port-forward service/kube-prometheus-stack-prometheus -n monitoring 9090 -
Open the targets that are configured for your Prometheus instance.
open https://localhost:9090/targets -
Select the
gloo-metrics-federationtarget that you configured and verify that the endpoint address and match condition are correct, and that theStatedisplays as UP.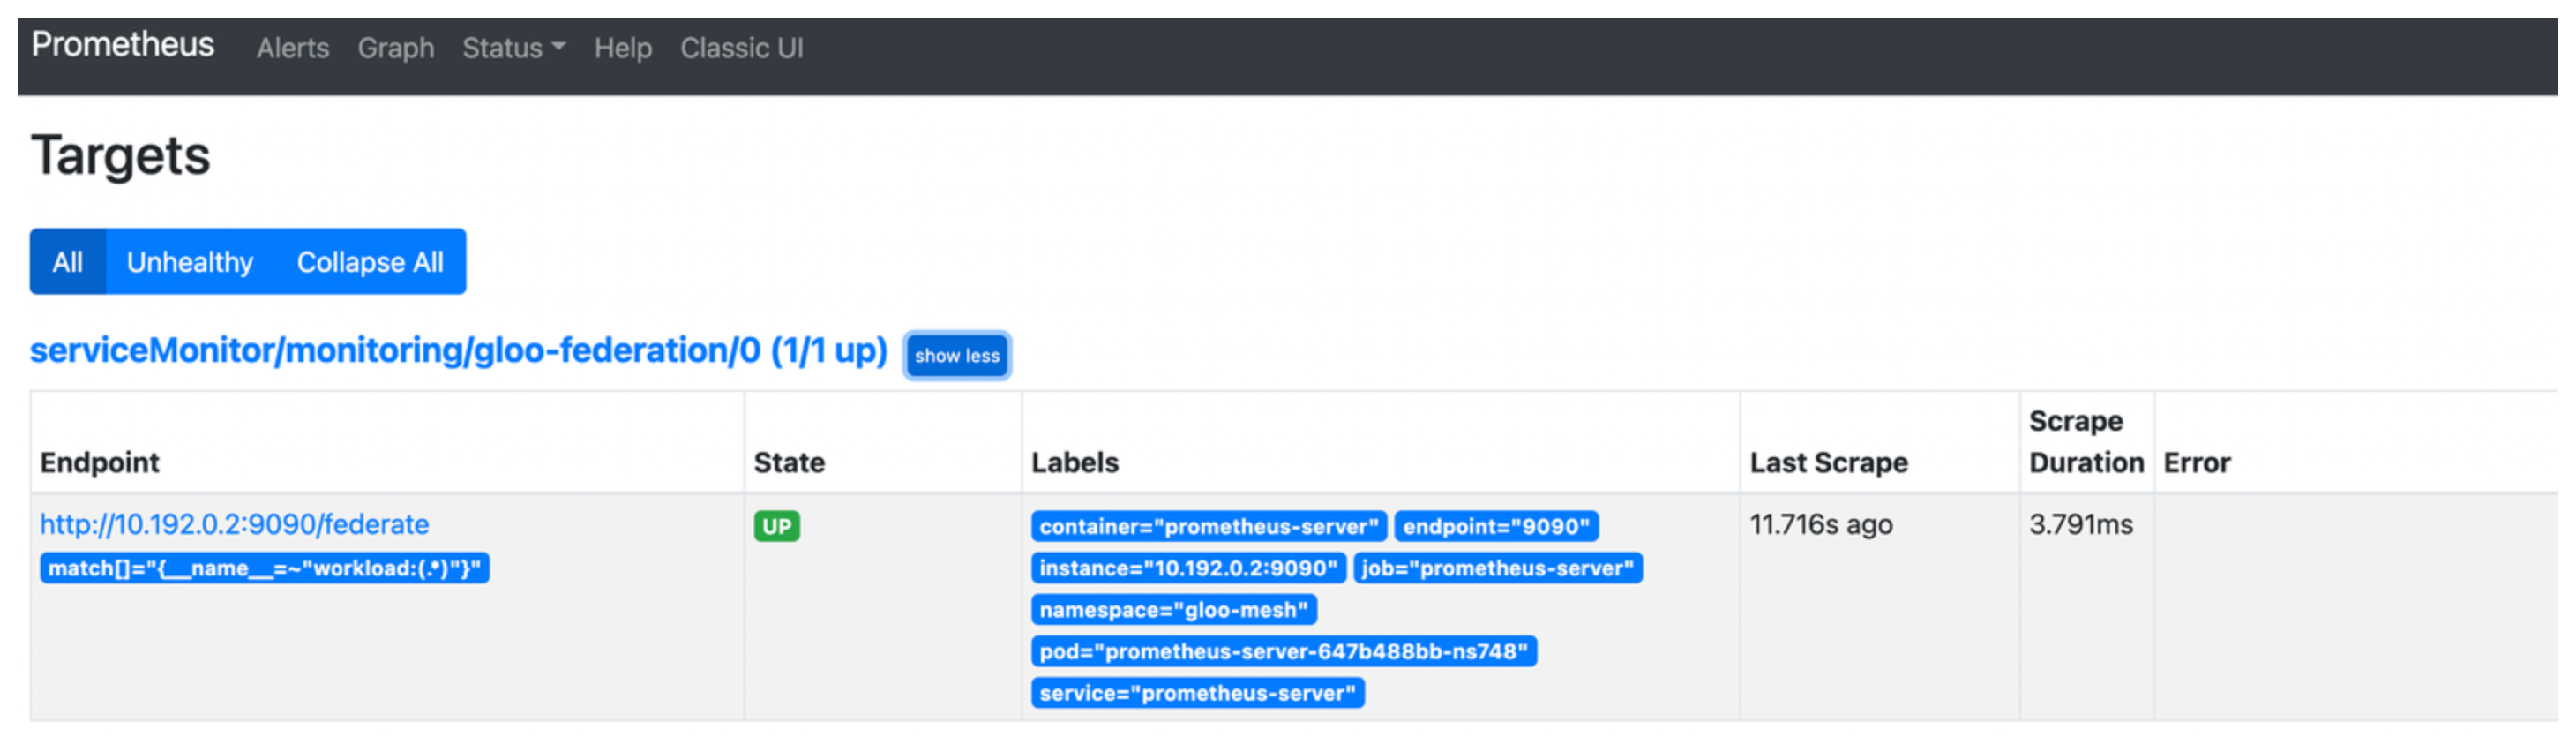
-
Optional: Access the aggregated metrics on the
/federateendpoint.open https://localhost:9090/federate?match[]={__name__="istio_requests_total"}Example output:
# TYPE istio_requests_total untyped
istio_requests_total{container="prometheus-server",destination_app="ratings",destination_service="ratings.bookinfo.svc.cluster.local",destination_workload="ratings-v1",destination_workload_namespace="bookinfo",endpoint="9090",job="prometheus-server",namespace="gloo-mesh",pod="prometheus-server-647b488bb-ns748",reporter="destination",response_code="200",response_flags="-",service="prometheus-server",source_app="istio-ingressgateway",source_workload="istioingressgateway",source_workload_namespace="istio-system",instance="",prometheus="monitoring/kube-prometheus-stack-prometheus",prometheus_replica="prometheus-kube-prometheus-stack-prometheus-0"} 11 1654888576995
istio_requests_total{container="prometheus-server",destination_app="ratings",destination_service="ratings.bookinfo.svc.cluster.local",destination_workload="ratings-v1",destination_workload_namespace="bookinfo",endpoint="9090",job="prometheus-server",namespace="gloo-mesh",pod="prometheus-server-647b488bb-ns748",reporter="source",response_code="200",response_flags="-",service="prometheus-server",source_app="istio-ingressgateway",source_workload="istio-ingressgateway",source_workload_namespace="istio-system",instance="",prometheus="monitoring/kube-prometheus-stack-prometheus",prometheus_replica="prometheus-kube-prometheus-stack-prometheus-0"} 11 1654888576995
-
-
Forward the federated metrics to your external Prometheus-compatible solution or time series database that is hardened for production. Refer to the Prometheus documentation to explore your forwarding options or try out the Prometheus agent mode.