Operations dashboard
Import the operations dashboard in Grafana to monitor the health of Gloo Mesh Gateway components.
About
Use the Gloo operations dashboard to monitor the health of your Gloo Mesh Enterprise environment, such as the average translation and reconciliation time for the Gloo management server, or translation errors that occured. When you install a Gloo product, the built-in Prometheus server is configured with default alerts that are automatically populated into the operations dashboard when they occur.
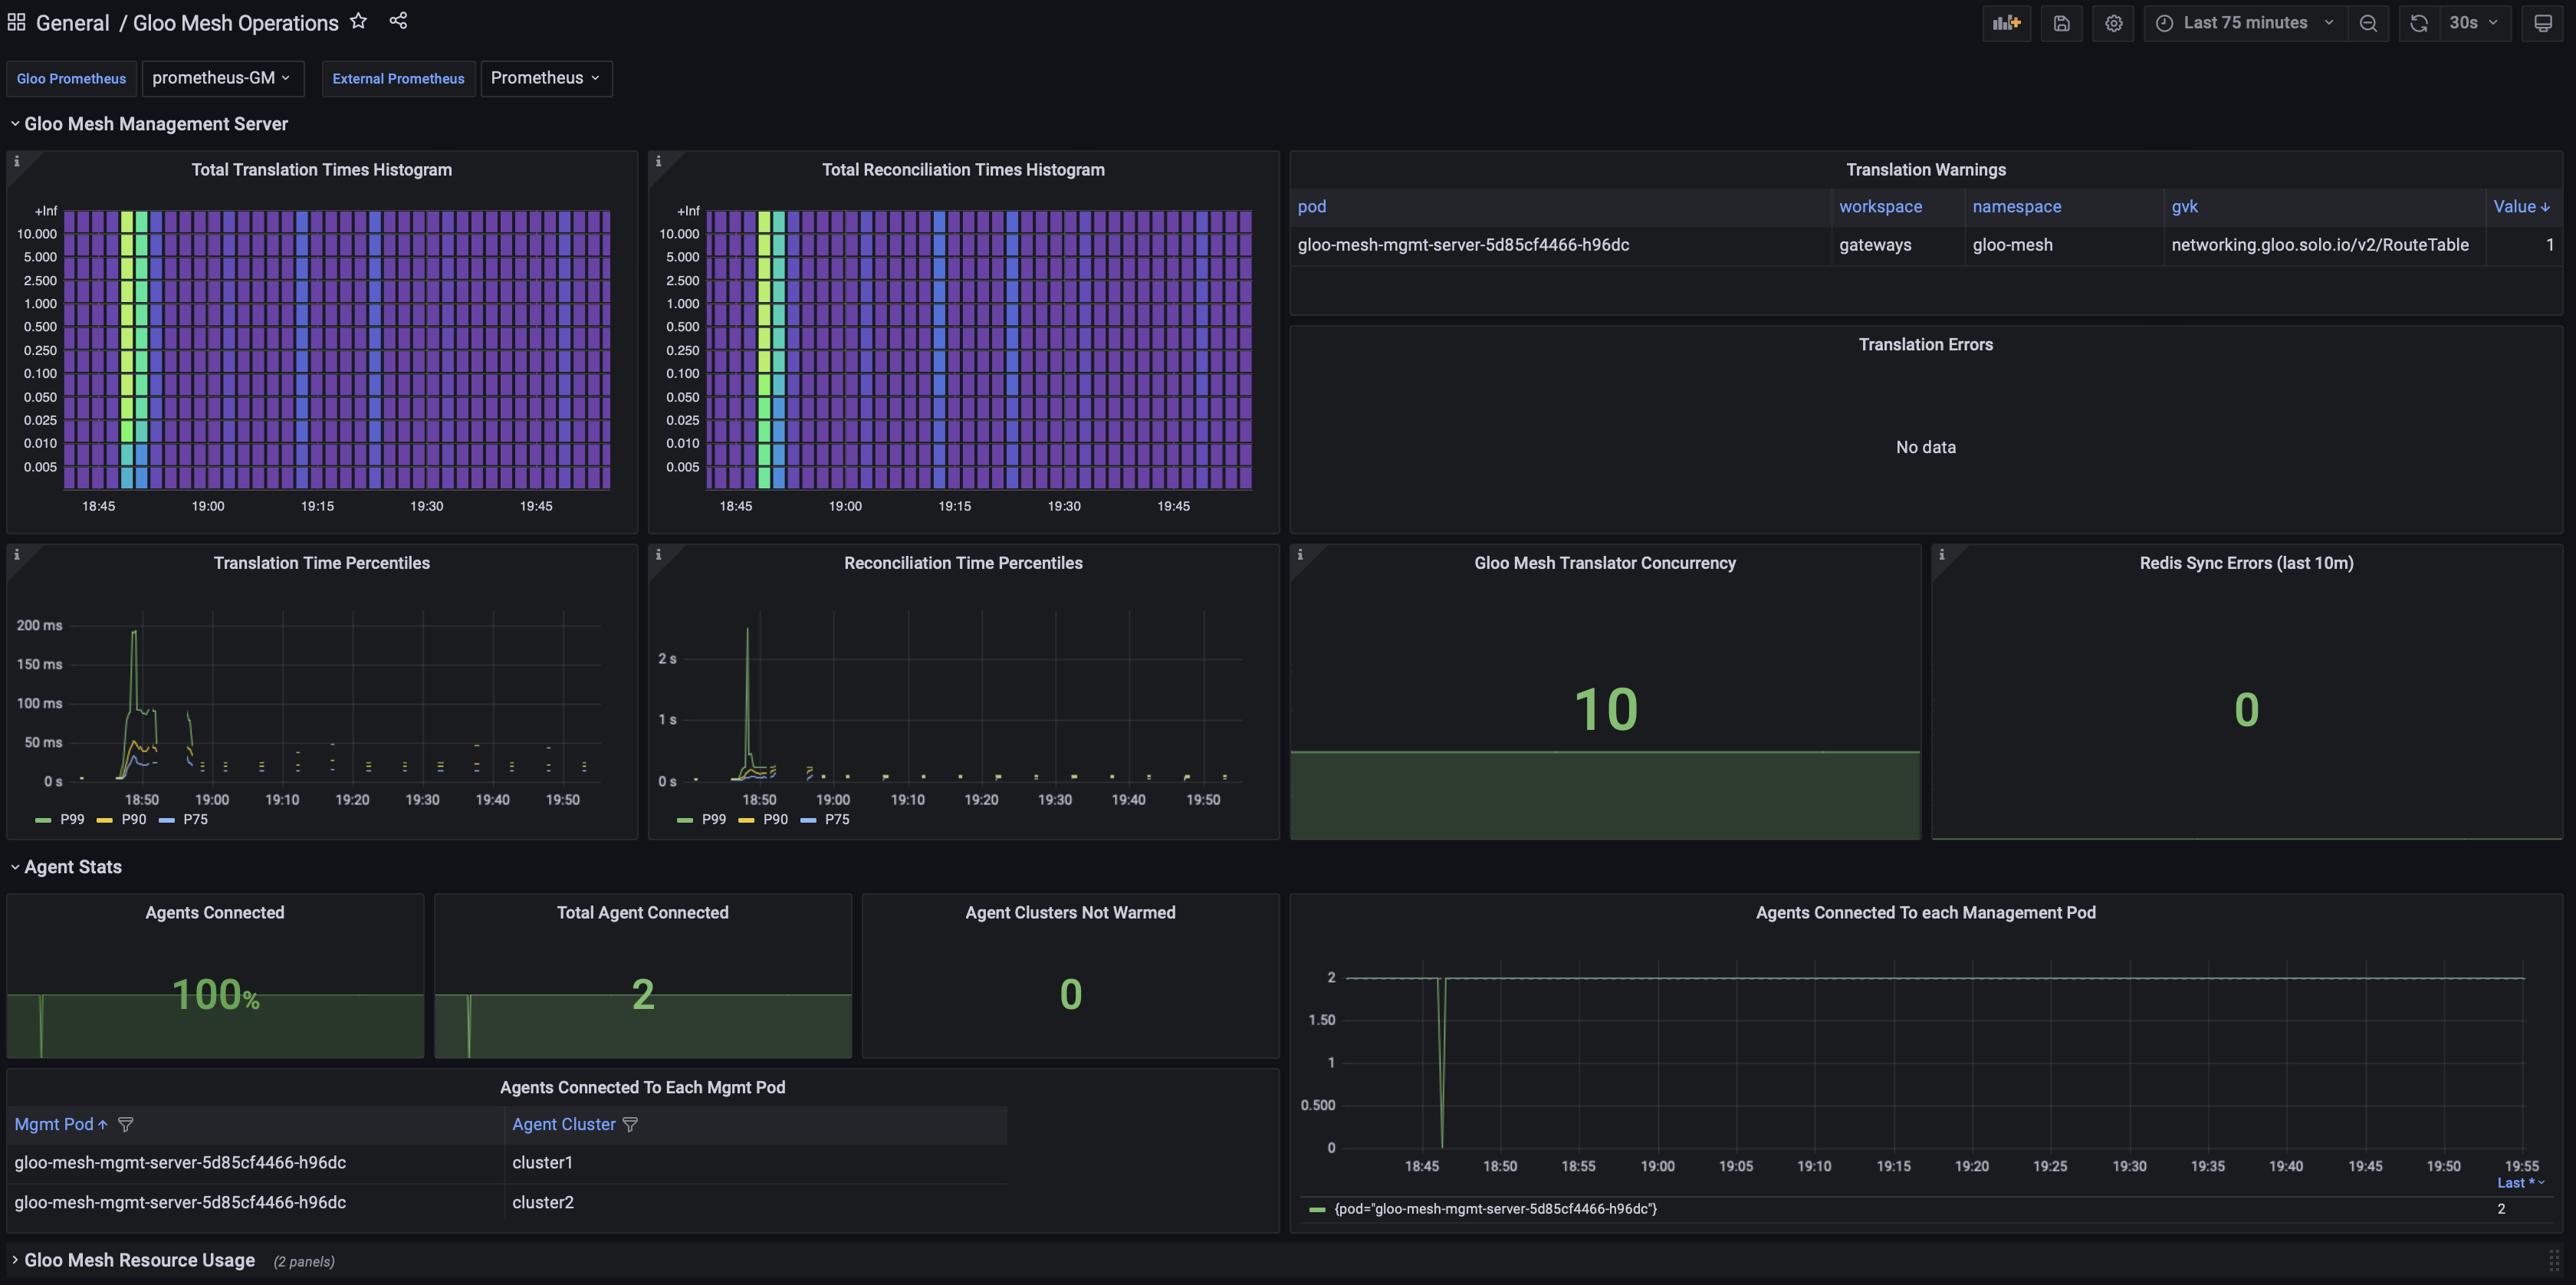
The operations dashboard lets you monitor the health of your Gloo Mesh Gateway environment, such as the average translation and reconciliation time for the Gloo management server, or translation errors that occured. Built on top of Grafana, the dashboard is configured to visualize critical Gloo Mesh Gateway metrics and alerts for you so that you can quickly see errors and the performance of Gloo Mesh Gateway components.
With the operations dashboard, you have access to the following key features:
Gloo Mesh Gateway metrics and alerts: Quickly view critical Gloo Mesh Gateway metrics and alerts to determine the health of your Gloo Mesh Gateway environment. The dashboard is organized into different sections that provide an overview of the Gloo management server’s and agent’s status, and the overall Gloo Mesh Gateway resource consumption. Populated metrics and alerts are retrieved from the built-in Prometheus server.
For an overview of available metrics, see Gloo management server metrics. To find a detailed overview of the alerts that are automatically configured for Gloo Mesh Gateway components, see Alerts.
Resource consumption: Monitor the CPU and memory usage of Gloo components, such as the Gloo agents and management server pods.
Install and access the operations dashboard
To access the Gloo operations dashboard, you must have Grafana installed in your cluster. You can easily do this by installing the Prometheus community Helm chart as shown in the steps on this page. However, if you have an existing Grafana instance that runs in your cluster already, you can add the operations dashboard to your Grafana instance. To do that, simply skip to step 6 and follow the instructions to import the operations dashboard.
Install the Prometheus community Helm chart. This Helm chart automatically sets up Grafana in your cluster.
  helm repo add prometheus-community https://prometheus-community.github.io/helm-charts
helm repo update

helm upgrade --install kube-prometheus-stack \
prometheus-community/kube-prometheus-stack \
--version 30.0.1 \
--namespace monitoring \
--kube-context=${MGMT_CONTEXT} \
--create-namespace \
--values - <<EOF
grafana:
  additionalDataSources:
  - name: prometheus-gloo-platform
    type: prometheus
    url: http://prometheus-server.gloo-mesh:80
EOF
Verify that the pods are all up and running.
kubectl get pods -n monitoring --context $MGMT_CONTEXTExample output:
  NAME                                                        READY   STATUS    RESTARTS   AGE
alertmanager-kube-prometheus-stack-alertmanager-0           2/2     Running   0          5m18s
kube-prometheus-stack-grafana-5d9f6d4ffd-gz9rn              3/3     Running   0          5m23s
kube-prometheus-stack-kube-state-metrics-596b9c6b55-jk8s9   1/1     Running   0          5m23s
kube-prometheus-stack-operator-7bb8679c95-bwfw5             1/1     Running   0          5m23s
kube-prometheus-stack-prometheus-node-exporter-9qdgv        1/1     Running   0          5m24s
kube-prometheus-stack-prometheus-node-exporter-dks8k        1/1     Running   0          5m24s
kube-prometheus-stack-prometheus-node-exporter-z5p5z        1/1     Running   0          5m24s
prometheus-kube-prometheus-stack-prometheus-0               2/2     Running   0          5m17s
Set up port forwarding on your local machine to access the Grafana dashboard.
kubectl port-forward $(kubectl get pods -n monitoring --context $MGMT_CONTEXT -o name | grep grafana) 8080:3000 -n monitoring --context $MGMT_CONTEXTOpen the Grafana dashboard in your web browser.
Log in to the Grafana dashboard with
adminas the username, andprom-operatoras the password. These are the default credentials that are set by the Prometheus community chart. You can change these credentials when you log in to Grafana.Import the Gloo Platform operations dashboard.
- Download the JSON file that holds the configuration for the Gloo Platform operations dashboard.
- From the Grafana menu, select
+> Import. - Click Upload JSON file and select the file for the Gloo Platform operations dashboard that you downloaded.
- Select
prometheus-gloo-platformas the Grafana data source. - Click Import to open the operations dashboard.
Explore default Gloo Platform alerts that are set up when you installed Gloo.