Operations dashboard
Monitor the health of your Gloo Platform environment with the Gloo operations dashboard.
About the operations dashboard
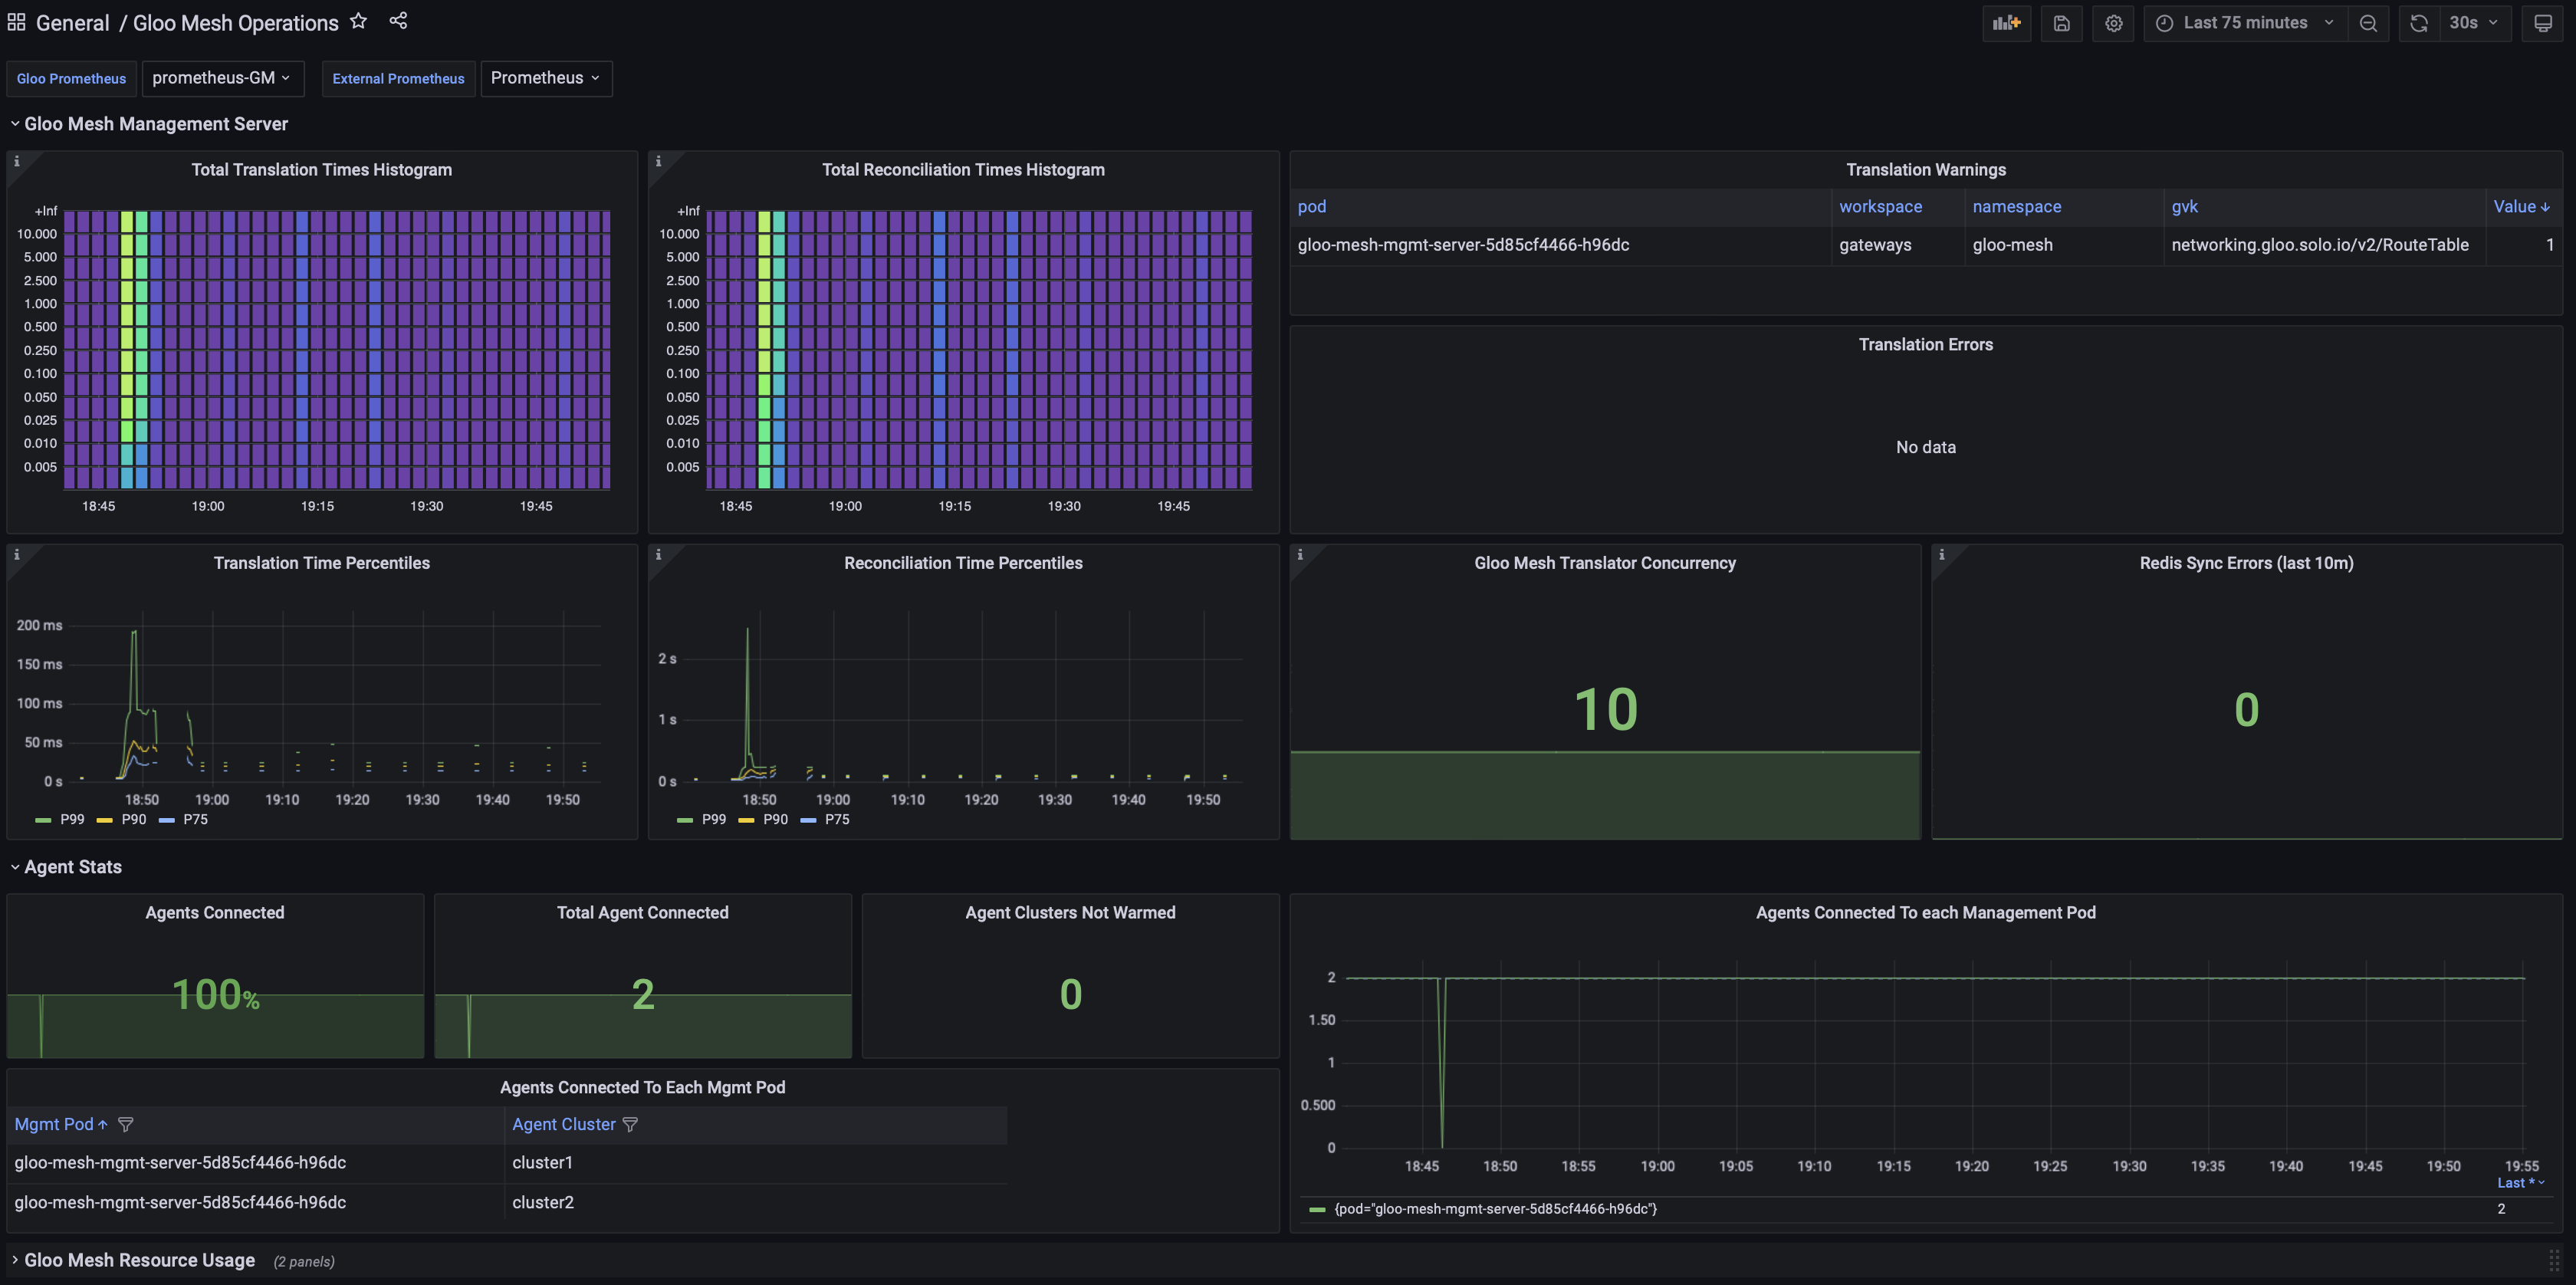
The operations dashboard lets you monitor the health of your Gloo Platform environment, such as the average translation and reconciliation time for the Gloo management server, or translation errors that occured. Built on top of Grafana and integrated with the Gloo Prometheus server, the dashboard is configured to visualize critical Gloo Platform metrics and alerts for you so that you can quickly see errors and the performance of Gloo Platform components.
With the operations dashboard, you have access to the following key features:
-
Gloo Platform metrics and alerts: Quickly view critical Gloo Platform metrics and alerts to determine the health of your Gloo Platform environment. The dashboard is organized into different sections that provide an overview of the Gloo management server's and agent's status, and the overall Gloo Platform resource consumption. Populated metrics and alerts are retrieved from the built-in Prometheus server.
For an overview of available Gloo Platform metrics, see View metrics. To find a detailed overview of the alerts that are automatically configured in Gloo, see Expore default alerts.
-
Resource consumption: Monitor the CPU and memory usage of Gloo Platform components, such as the Gloo agents and management server pods.
The operations dashboard is not automatically set up when you install Gloo Platform. To access the dashboard, you must install Grafana and import the operations dashboard configuration. For more information, see Open the operations dashboard.
Overview of monitored Prometheus metrics and alerts
To find an overview of the metrics that are monitored in the Gloo operations dashboard and the Prometheus alerts that are populated, see Explore default alerts
The operations dashboard does not populate all of the Gloo Platform metrics that are available in the built-in Prometheus server. To find an overview of all metrics, see View metrics.