Grafana dashboards
To monitor the health of your Gloo control and data plane, you can leverage pre-built Grafana dashboards. Grafana is an open source interactive data-visualization platform that allows users to see their data via charts and graphs that are unified into one dashboard.
Operations dashboard
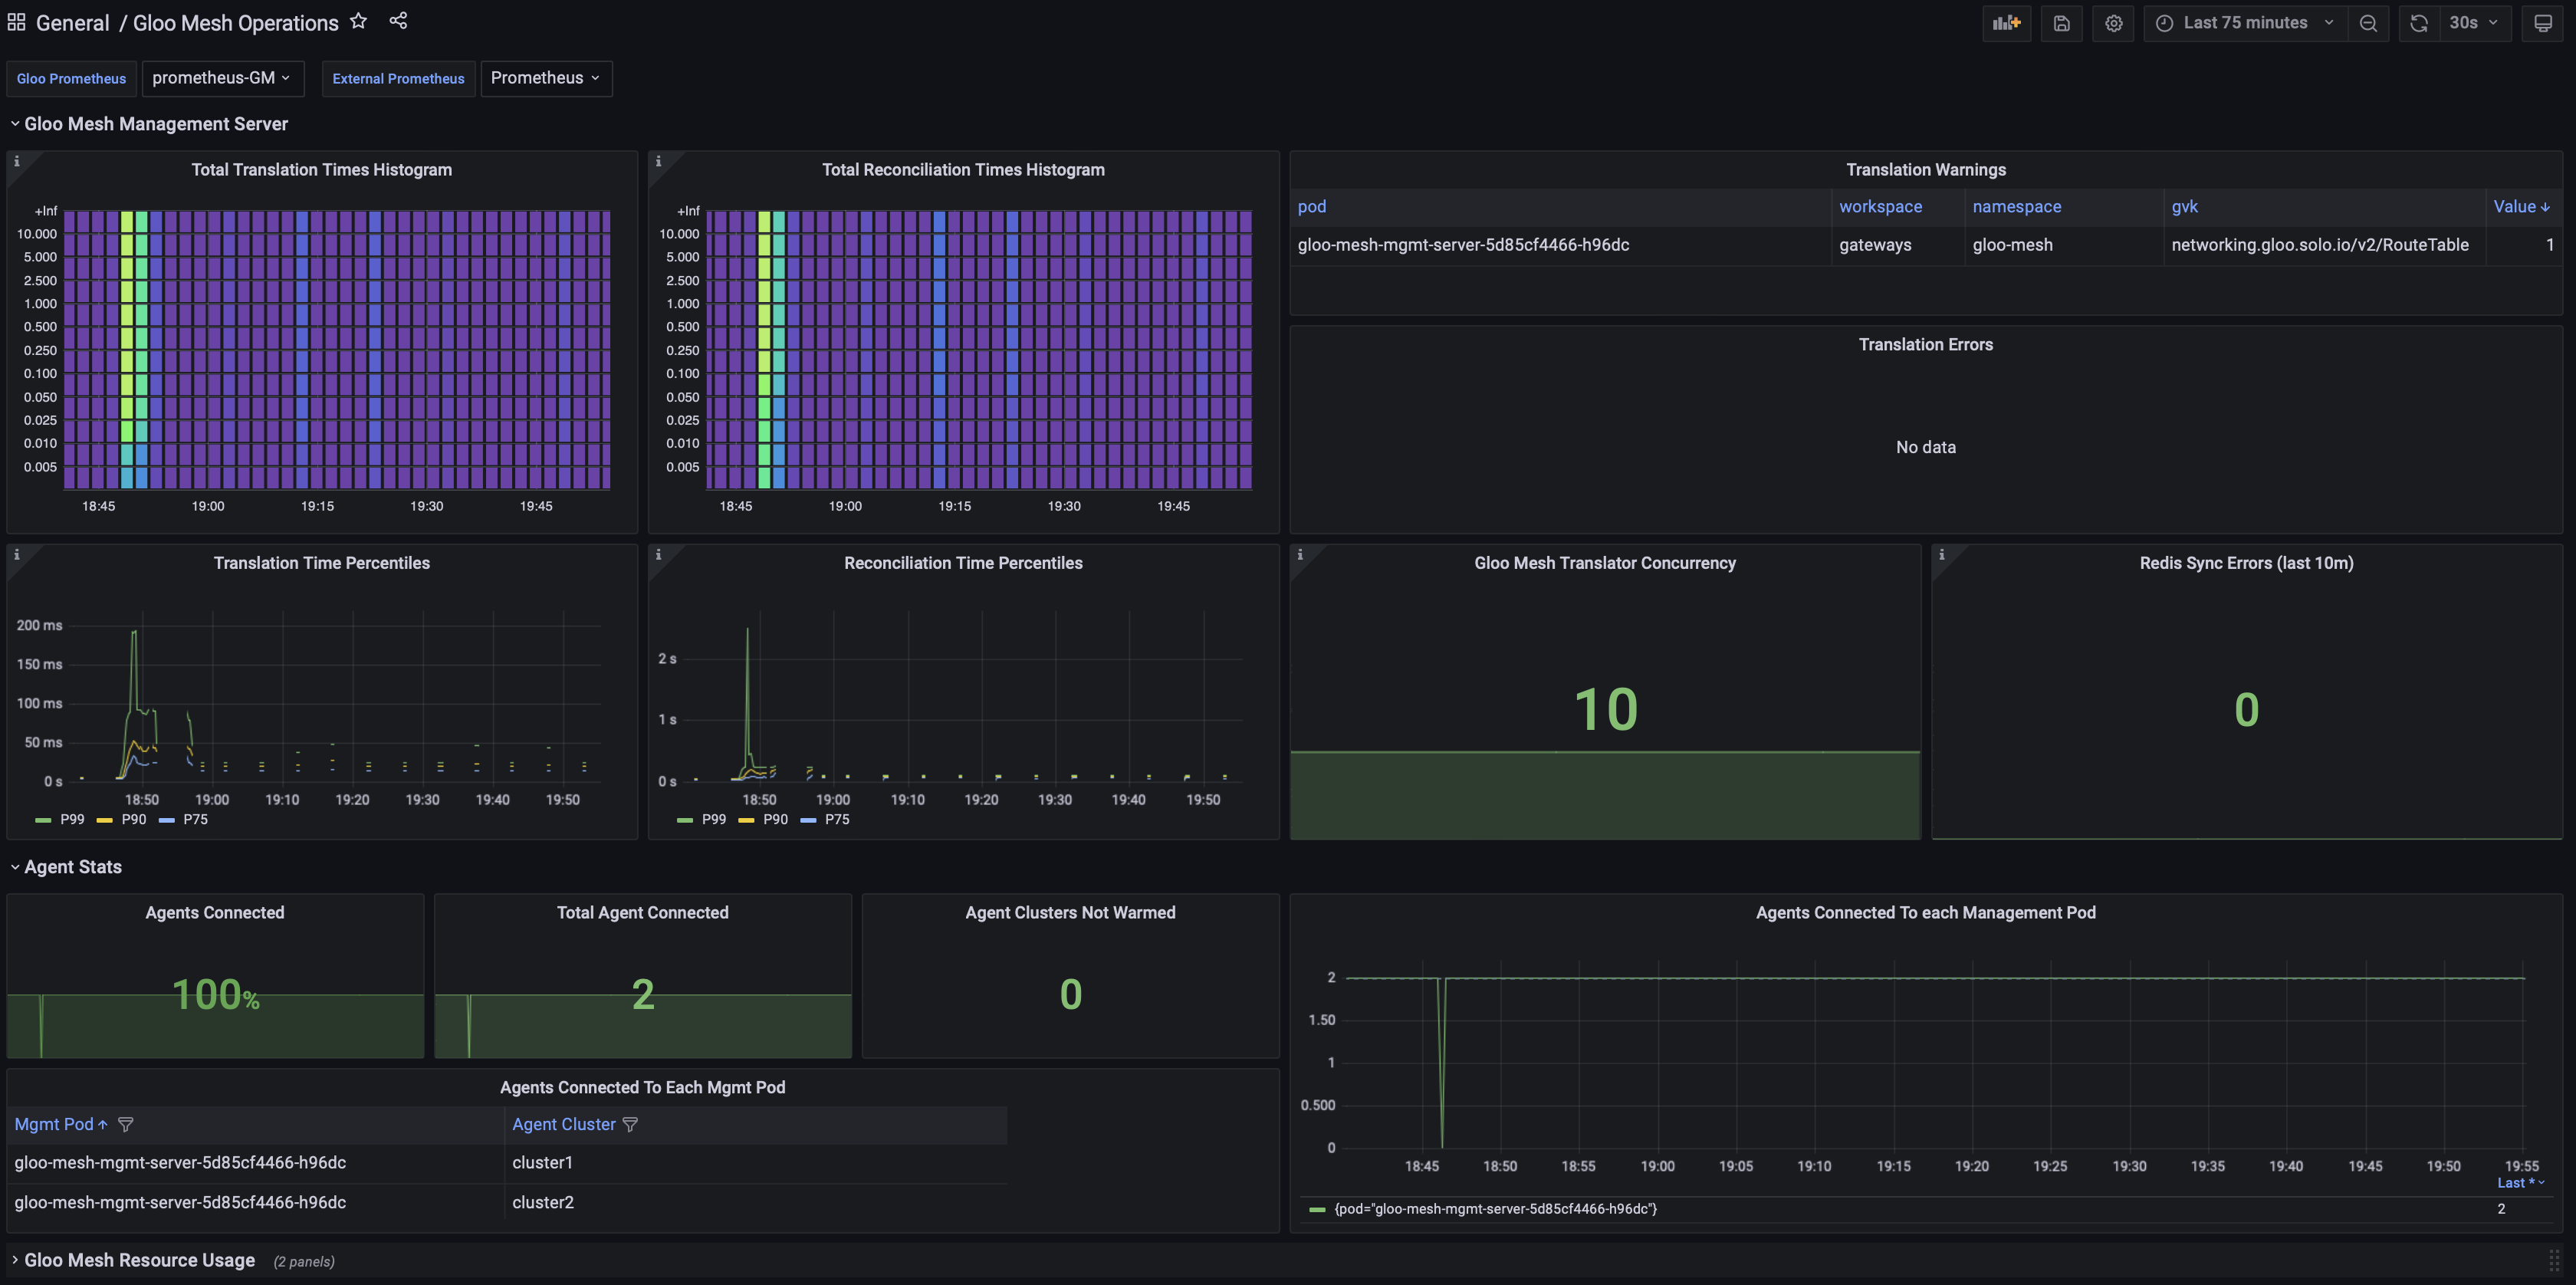
The operations dashboard lets you monitor the health of your Gloo Platform environment, such as the average translation and reconciliation time for the Gloo management server, or translation errors that occured. Built on top of Grafana and integrated with the Gloo Prometheus server, the dashboard is configured to visualize critical Gloo Platform metrics and alerts for you so that you can quickly see errors and the performance of Gloo Platform components.
With the operations dashboard, you have access to the following key features:
-
Gloo Platform metrics and alerts: Quickly view critical Gloo Platform metrics and alerts to determine the health of your Gloo Platform environment. The dashboard is organized into different sections that provide an overview of the Gloo management server's and agent's status, and the overall Gloo Platform resource consumption. Populated metrics and alerts are retrieved from the built-in Prometheus server.
For an overview of available Gloo Platform metrics, see View metrics. To find a detailed overview of the alerts that are automatically configured in Gloo, see Expore default alerts.
-
Resource consumption: Monitor the CPU and memory usage of Gloo Platform components, such as the Gloo agents and management server pods.
The operations dashboard is not automatically set up when you install Gloo Platform. To access the dashboard, you must install Grafana and import the operations dashboard configuration. For more information, see Open the operations dashboard.
Overview of monitored metrics and alerts
To find an overview of the metrics that are monitored in the Gloo operations dashboard and the Prometheus alerts that are populated, see Gloo Platform alerts and Gloo Platform metrics.
Cilium dashboard

When you enable the full Cilium metrics in your Gloo OTel pipeline, you gain access to a variety of metrics that help you monitor the Cilium agent and operator, network traffic and policies, as well as connectivity and security in your cluster. These metrics are populated to Grafana and visualized for you so that you can quickly see the status and health of your Cilium CNI components.
With the Cilium dashboard, you have access to the following key features:
- Cilium agent and operator resource consumption and latency: Gain insights into the state of the Cilium CNI components, such as the Cilium agent and the Cilium operator. For example, you can monitor the average CPU and memory consumption of the Cilium agent, the number of Cilium API calls, their latency and API return codes.
- Layer 3 BPF metrics: Monitor the system-wide memory consumption of eBPF maps, the number of system calls, their latency, and IP allocation operations.
- Network traffic: Track incoming and outgoing network packets that were successfully processed or dropped for Cilium-managed Kubernetes pods.
- Network policies: Monitor the number of requests that were allowed or prohibited by network policies, and the endpoints that are labeled by policy enforcement status.
- Cilium endpoints: Review the number of endpoints that Cilium monitors and their status.
The Cilium dashboard is not automatically set up during the Gloo Platform installation. To access the dashboard, you must install Grafana and import the Cilium dashboard configuration. For more information, see Import the Cilium dashboard.
Overview of monitored metrics and alerts
The metrics that are monitored in the Grafana dashboard depend on the metrics that you enabled as part of your Gloo OpenTelemetry pipeline setup. If you enabled the full Cilium metrics, the pre-built Cilium dashboard offers various graphs and data that provide a full picture of the health of the Cilium CNI and the network traffic in your cluster. However, if you customized the Cilium metrics and enabled only certain Cilium metrics, some graphs in the dashboard might remain empty due to missing data.