Explore the UI
After connecting to the Gloo UI, explore the basic layout. You can review Gloo custom resources, such as the registered clusters, workspaces, gateway configuration, policies, and more.
The UI offers a view-only experience. Users cannot modify resources.
Gloo UI pages
Review the following sections to learn about the Gloo UI layout.
Overview
Get an at-a-glance look at the health of workspaces and clusters that make up your Gloo setup.
Graph
Visualize the network traffic that enters your cluster in a graph that maps out all the nodes by workspace, namespace, or cluster.
Gateways
Review the virtual gateways, attached route tables, and related workloads of your networking setup.
APIs
Review details of GraphQL APIs or of bundled REST API products that are exposed in a developer portal.
Portals
Review details about developer portals that you set up to expose your APIs to end users.
Policies
Filter the network traffic rules that are applied to your gateways, destinations, or routes.
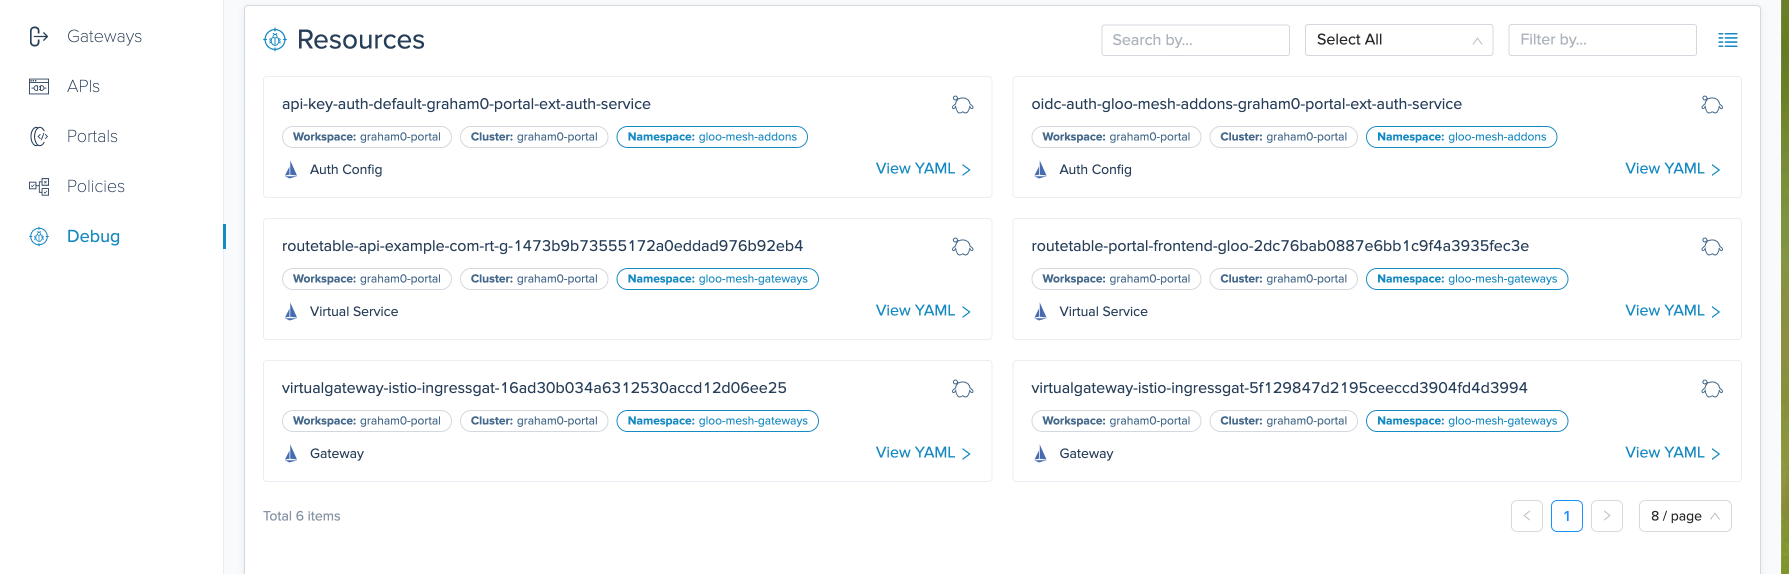
Debug
Review the configuration of translated Istio or Cilium resources to help debug issues.
Overview
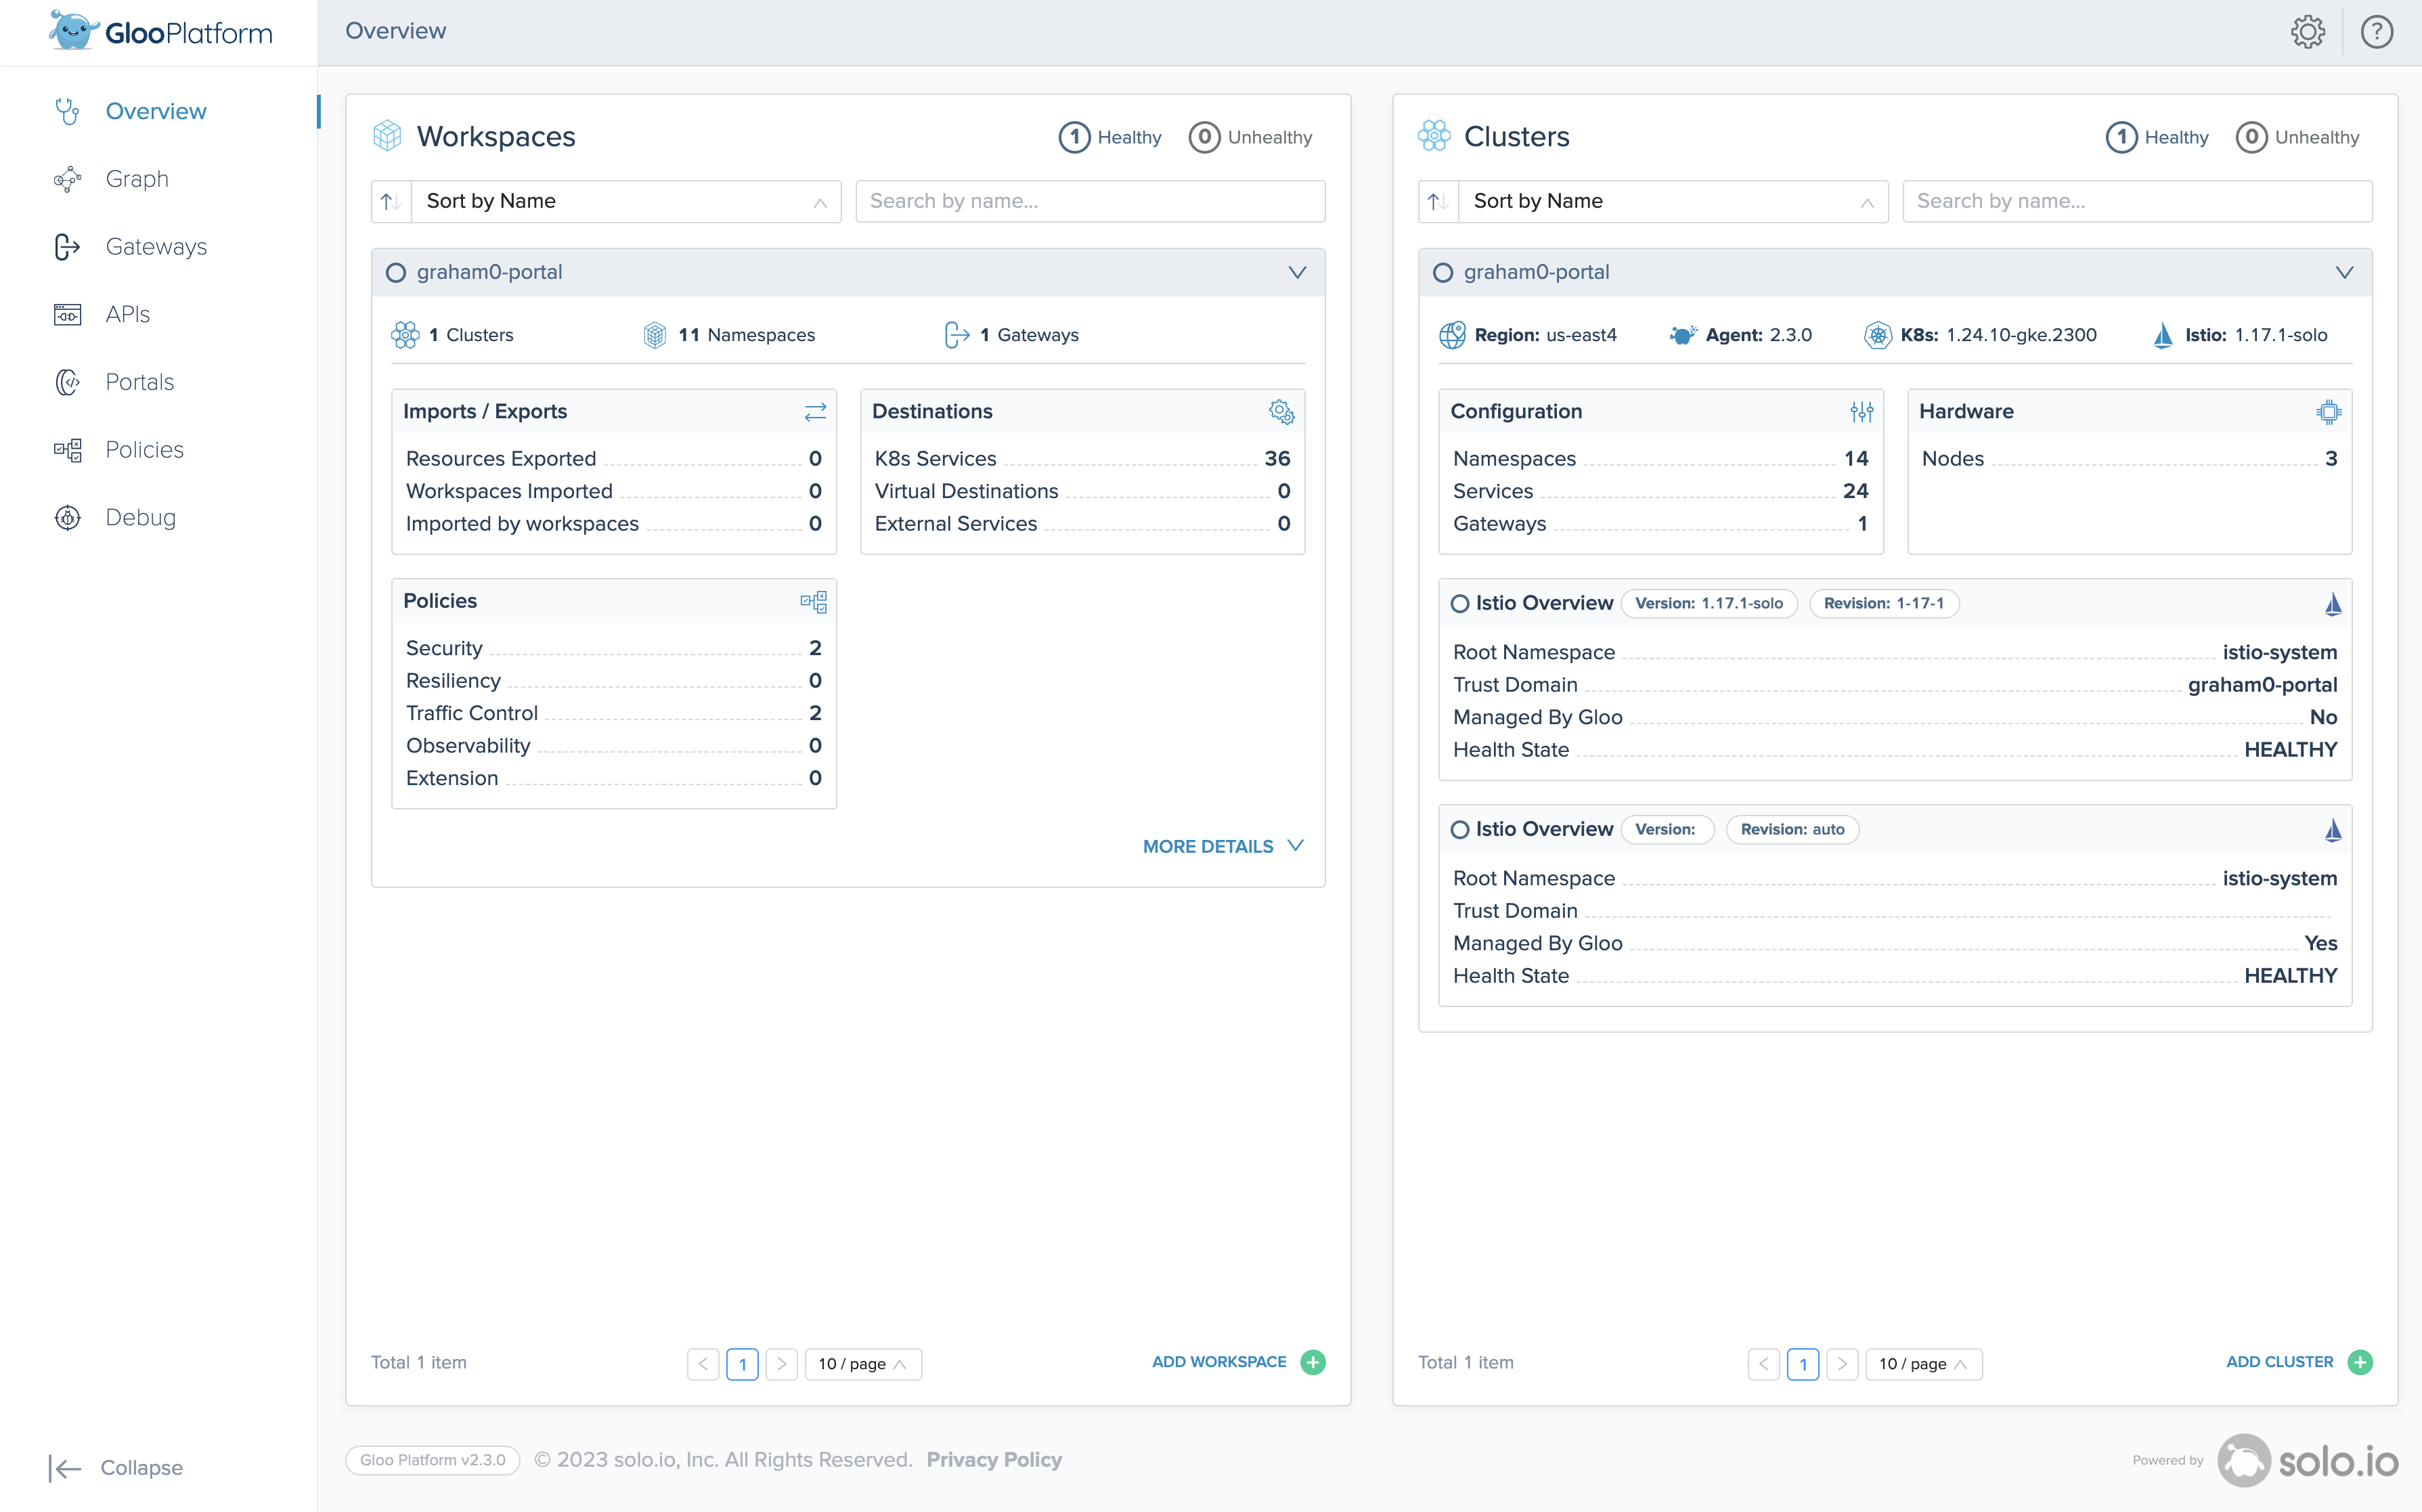
The Overview page presents an at-a-glance look at the health of workspaces and clusters that make up your Gloo setup.
In the Workspaces and Clusters panes, you can review a count of the healthy resources, sort by, or search by name for your resources. You can review top-level details about each resource in the resource cards. For more information about workspaces and registered clusters, see the Setup docs.
From the default collapsed view, you can see the number of clusters, namespaces, and gateways in a card for each workspace.
Actions you can take:
- Click the expand icon (∧) to expand the card. You see more information about the imported and exported resources, destinations, and policies.
- Click MORE DETAILS ∨ to jump to the workspace details page for that workspace.
About the counts:
- The details are taken from the Workspace custom resource status, which you can check in the CLI by running
kubectl get workspace -n gloo-mesh -o yaml. - Resource counts include imported resources. For example, the total count of destinations includes Kubernetes services in your workspace, plus all Kubernetes services that your workspace imports.
- To check imported resources, you might use labels. Labels are used to import and export resources. Your platform admin can tell you if a particular label is used, such as
exported: true. Then, you can check all resources for this label, such as in the terminal by runningkubectl get services -A -l exported=true.
From the default collapsed view, you can see the region, Kubernetes version, and, if you use Gloo Network, the Cilium version in a card for each cluster. Each cluster must be registered with Gloo Platform via the KubernetesCluster custom resource.
Actions you can take:
- Click the expand icon (∧) to expand the card. You see more information about the Kubernetes resource configuration and compute hardware of the cluster.
- Click MORE DETAILS ∨ to jump to the cluster details page for that cluster.
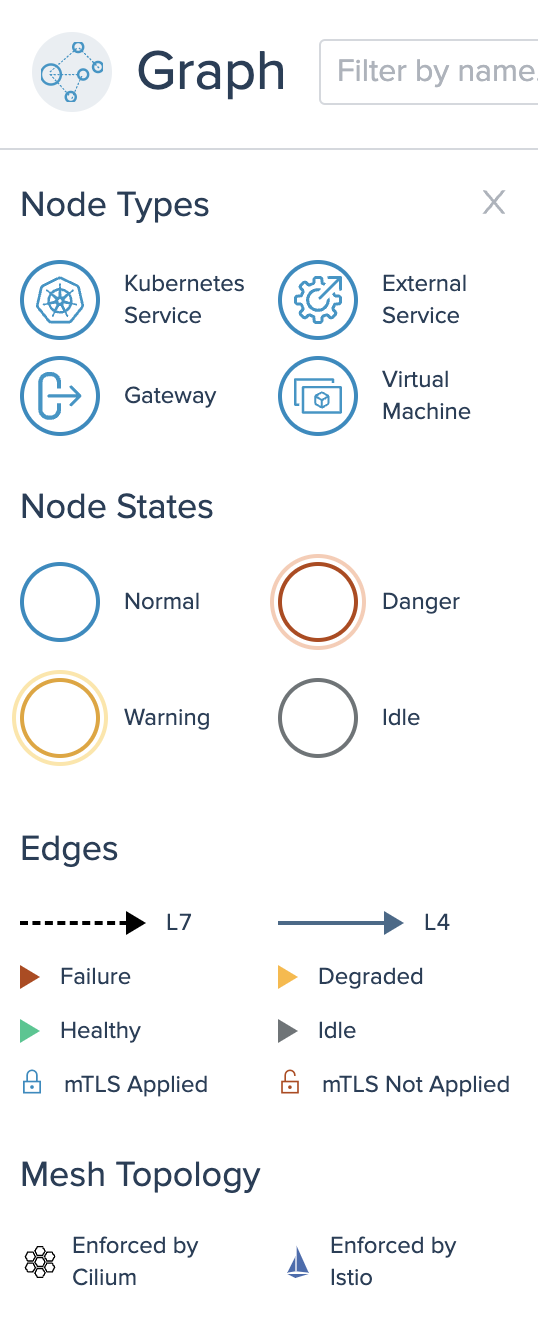
Graph
The Gloo UI includes a Graph page to visualize the network traffic that reaches Gloo Gateway. The graph is based off Prometheus metrics that the agents on each workload cluster send the management cluster.
Review the following sections to learn more about the Graph layout.
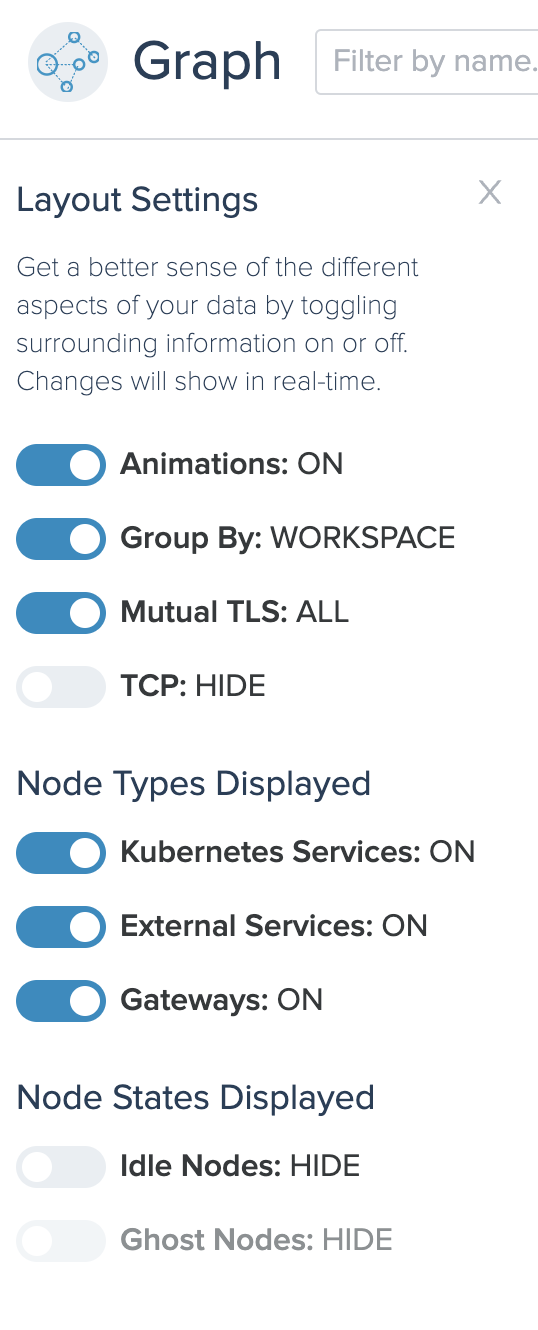
Layout settings
From the footer toolbar, click Layout Settings. Toggle on or off the following settings.
- Animations: Change the paths between nodes from a directional animation to a solid line.
- Group By: In view 1, toggle the architectural layout between
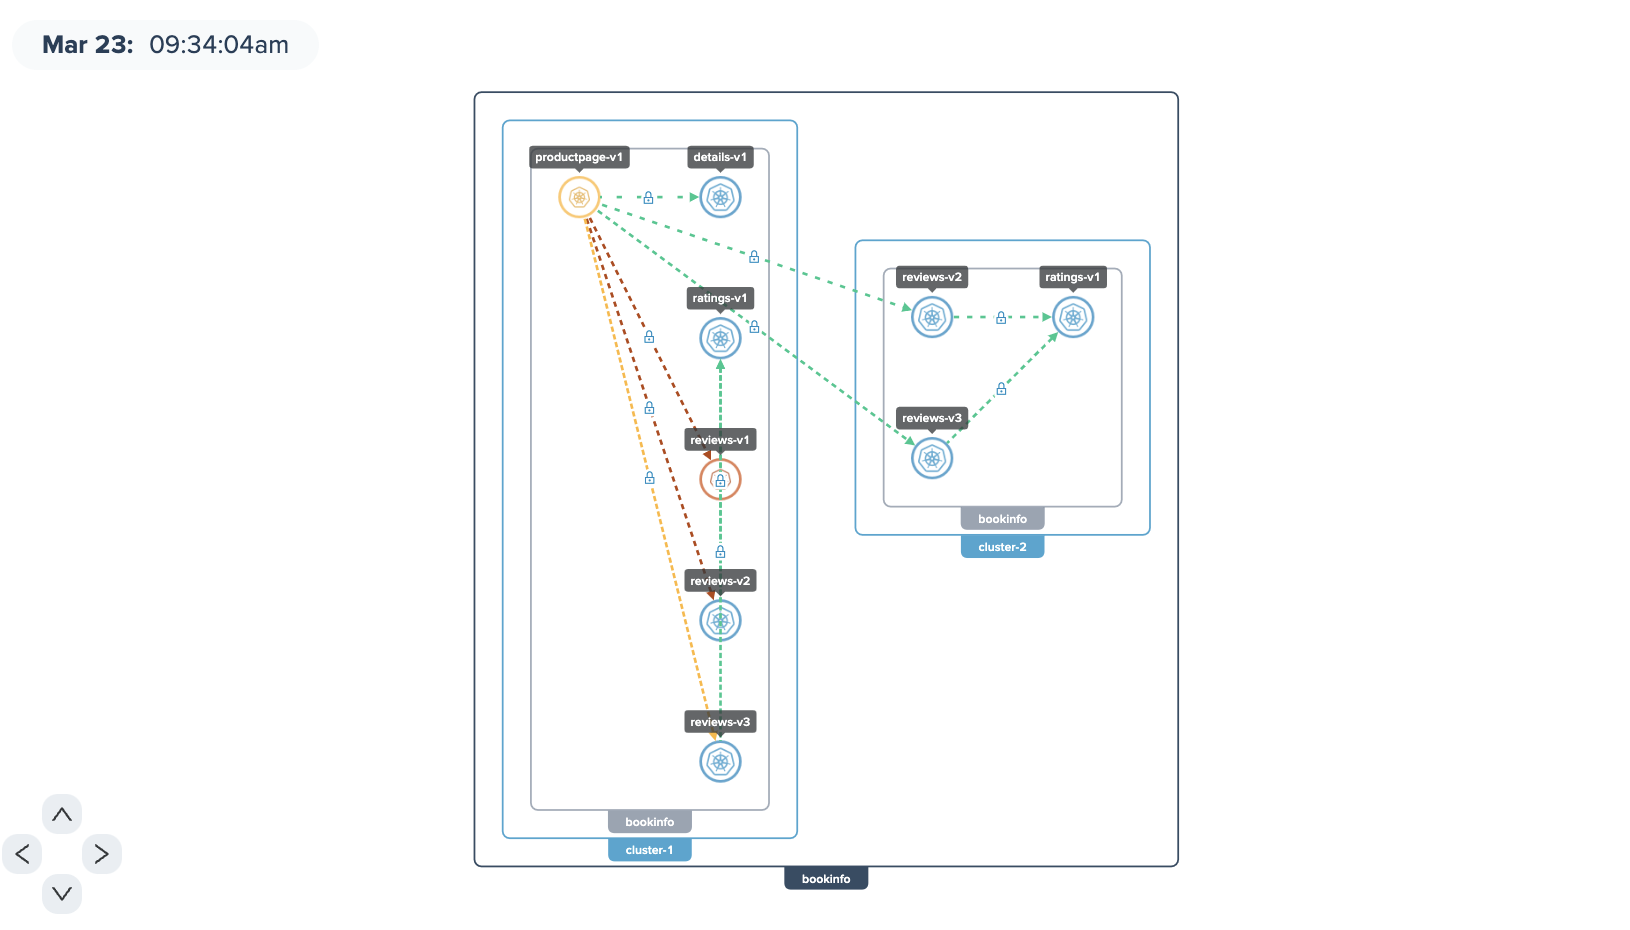
CLUSTERandWORKSPACE.CLUSTER: Review the clusters and Kubernetes namespaces that your app nodes are organized in. For example, you might want to focus on reviewing multicluster traffic failover by toggling this view.WORKSPACE: Review the Gloo workspaces that your app nodes are organized in. For example, you might want to focus reviewing traffic across each of your team's workspaces.
- Mutual TLS: If you use Gloo Mesh Enterprise, toggle the lock or unlock icons along paths between nodes. For example, if all your workspaces enable service isolation, then all traffic is secured via mTLS. Thus, you might not want to see the lock icons.
- TCP: Review TCP traffic.
- Cilium: If you use Gloo Network, toggle on or off the network graph for connections enabled by the Cilium CNI.
- Kubernetes services
- External services
- Gateways
Header, filter, and footer toolbars for navigation
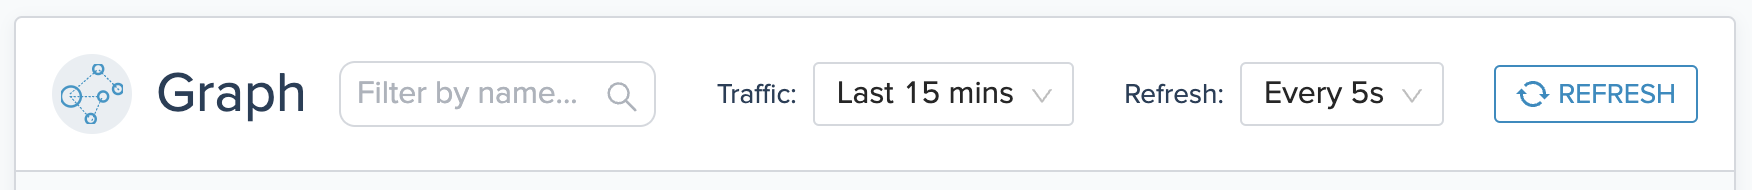
In the Search bar, filter the services that you want to see in the graph. You can choose to include or hide those services.
From the Traffic dropdown, select the range of time that you want the graph to show, such as traffic from the last 15 minutes.
From the Refresh dropdown, select how often you want the graph to refresh the data, such as every 5 seconds. You can also refresh on demand by clicking REFRESH.
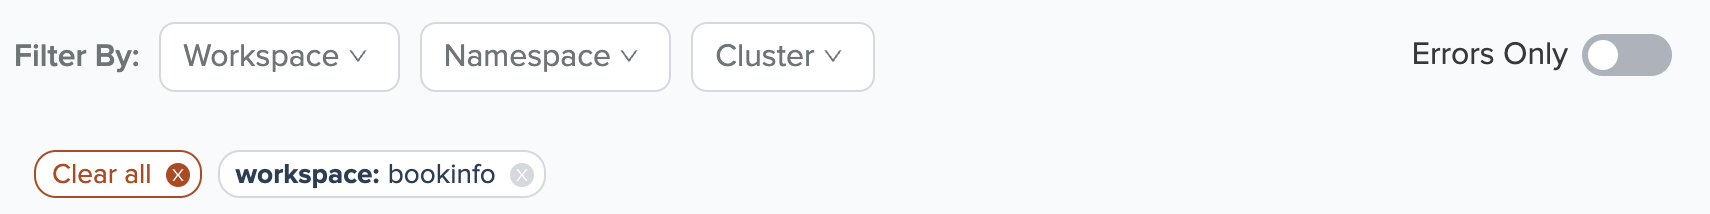
After the header toolbar, you can filter what the graph shows by workspace, namespace, and cluster. Filters work like the logical operator AND, so results must meet all the criteria. For example, if you filter by bookinfo workspace, bookinfo namespace, and cluster1, then the graph shows services that meet all these criteria.
Toggle Errors Only to see services that experienced traffic errors during the traffic time range you selected from the header toolbar.
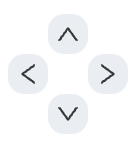
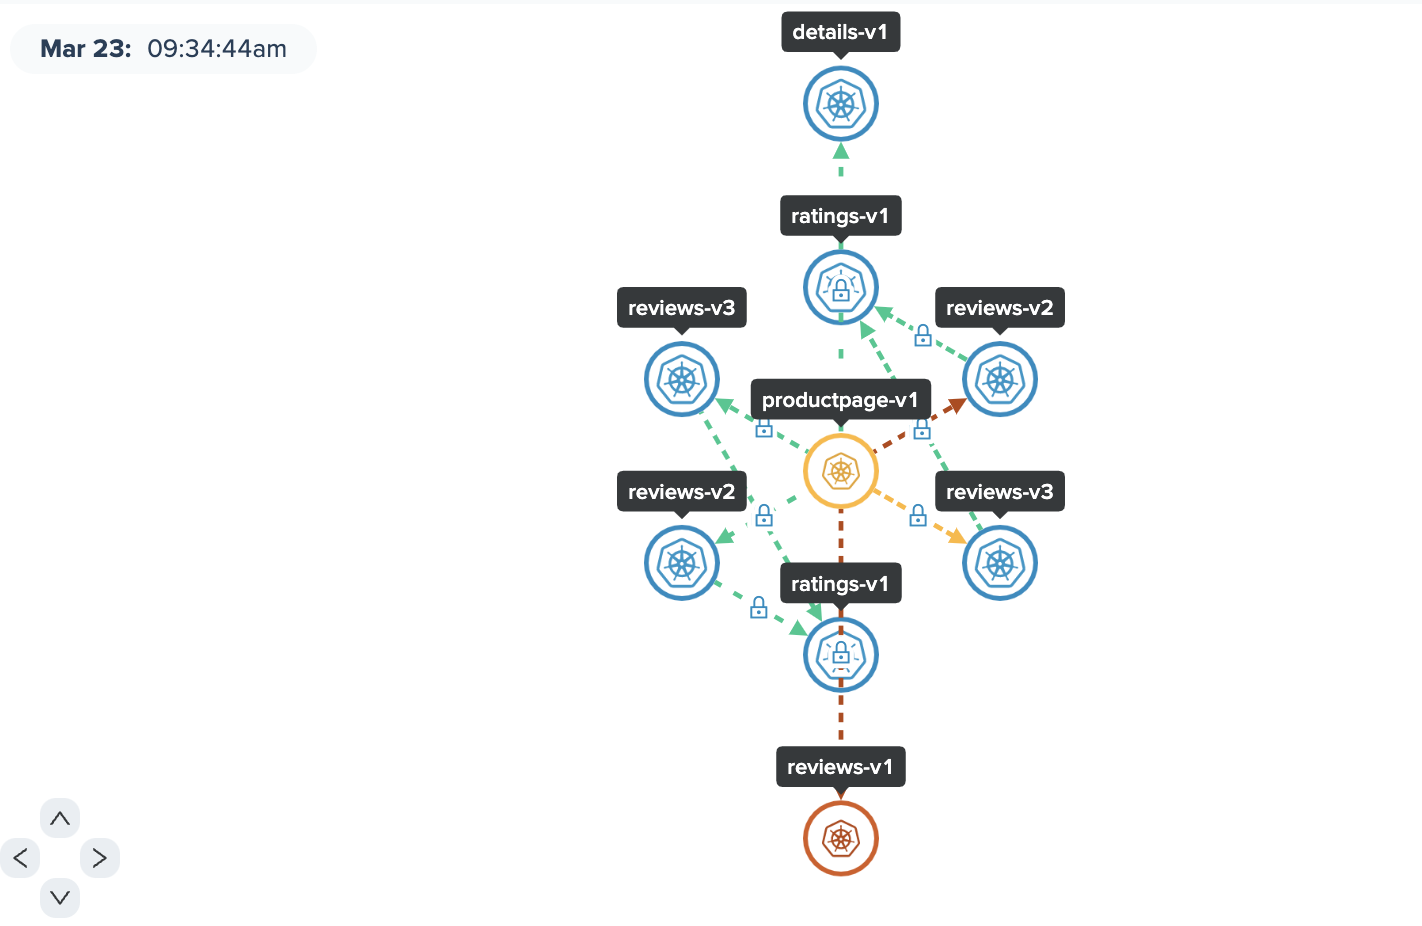
Within the graph views, you can navigate by clicking and dragging whitespace within the main canvas, or by using the navigation arrow buttons, as shown in the following figure.
After the header toolbar, filter, and main canvas, you can choose more viewing options in the footer toolbar.

| # | Icon name | Description |
|---|---|---|
| 1 | Fullscreen | Click to expand your browser to fullscreen. Click again or enter ESC to return to the normal screen size. |
| 2 | Zoom in and out | Zoom in or out on the main view's canvas. Depending on your mouse settings, you can also scroll to zoom in and out. |
| 3 | Fit to canvas | Click to center and fit the content of the current view to the canvas size. This action might be helpful if you rearranged the nodes and zoomed in. |
| 4 | Networking graph views | Click one of the networking graph views to change how the nodes are displayed in the main canvas. For more information, see Networking views. |
| 5 | View legend | Open the graph legend. For more information, see Legend. |
| 6 | Layout settings | Open the graph layout settings. For more information, see Layout settings. |
Legend
From the footer toolbar, click Show Legend.
Node Types describes the icons that are used for the application “nodes” of the graph. For example, a node might be a Kubernetes service, Istio gateway, external service, or an attached virtual machine (VM). (Note that nodes represent your apps, not Kubernetes compute nodes.)
Node States and Edges show whether a service's traffic behaves normally or not, as indicated by a color or icon.
| Color or icon | State | Description |
|---|---|---|
| Blue | Normal | The node sends and responds to traffic as expected. |
| Red | Danger | The node has some sort of failure. For example, a policy might be applied to a route that blocks traffic to a service. |
| Yellow | Warn | The node has some sort of degraded traffic. For example, a policy might be applied to a route that rate limits traffic to a service. Most of the requests are successful, but some are not. |
| Gray | Idle | The node does not yet accept or send traffic. For example, the deployment might be pending. |
| Dashed, black line | L7 | The traffic between nodes is sent over Layer 7 (application). For this traffic, you can apply L7 HTTP/HTTPS Gloo Mesh and Gloo Gateway policies. |
| Solid, navy line | L4 | The traffic between nodes is sent over Layer 4 (transport). For this traffic, you cannot apply Gloo Mesh or Gloo Gateway policies, as Gloo does not support policies for TCP traffic. To apply L4 policies, use Gloo Network instead. |
| Colorful triangles | Failure, Healthy, Degraded, or Idle | The connection is in a state of failure, healthy, degraded, or idle, depending on the color. Try describing the resources in your cluster to troubleshoot further. |
| Blue lock icon | mTLS applied | Service isolation is enabled for the traffic, with communication secured via mTLS. You can change service isolation settings via an access policy for a specific destination, or for the entire workspace via the workspace settings. |
| Red unlock icon | mTLS not applied | Service isolation is not enabled for the traffic. You can add service isolation via an access policy for a specific destination, or for the entire workspace via the workspace settings. |
| Cilium icon | Enforced by Cilium | The traffic connection is enforced by Cilium, which indicates that you use Gloo Network. |
| Istio icon | Enforced by Istio | The traffic connection is enforced by Istio, which indicates that you use Gloo Mesh, or Gloo Gateway for gateway-only connections. |
Networking views
Show an architectural view of your app nodes in the main canvas area of the graph. This view organizes the app nodes by the Gloo workspace, Kubernetes namespace, and cluster that you filter for.
To rearrange nodes, click and drag. In this view, your changes are cached so that the canvas setup stays similar when you return to the page. For information on the edge paths, node states, locks, and more, see the Legend tab.
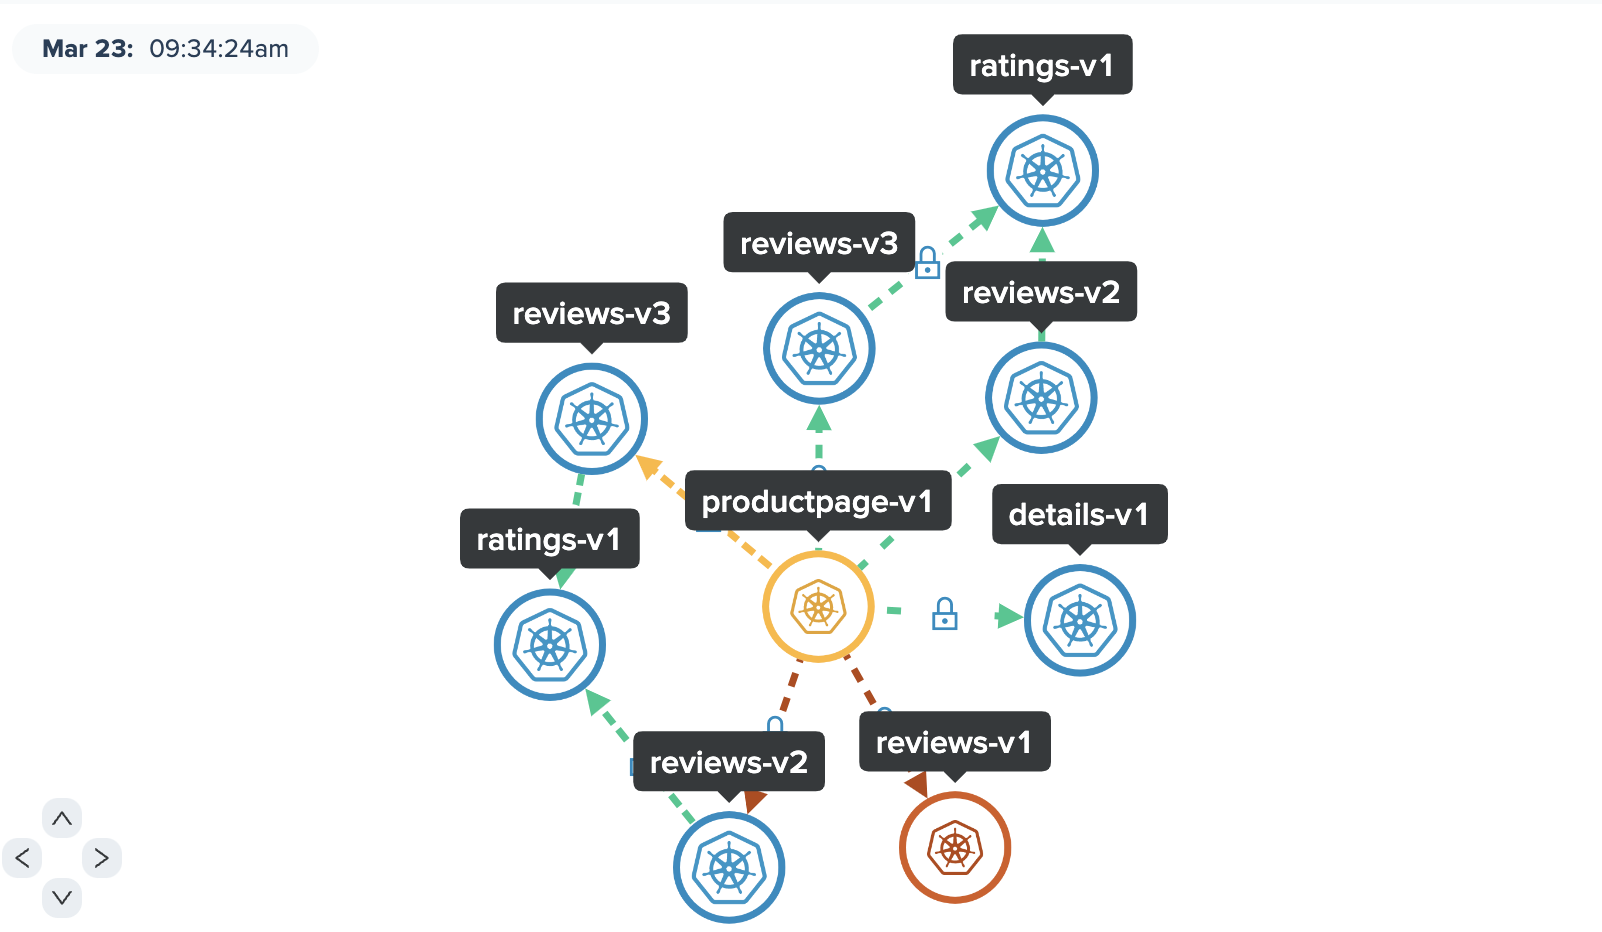
Show a simple view of the app nodes in your environment. Nodes are grouped together in close proximity. This view does not show workspace, namespace, or cluster boundaries. However, those boundaries are still used to show or hide out nodes based on your filters.
To rearrange nodes, click and drag. Note that in this view, your changes are NOT cached. For information on the edge paths, node states, locks, and more, see the Legend tab.
Show a simple view of the app nodes in your environment. Nodes are organized into a vertical chain layout. This view does not show workspace, namespace, or cluster boundaries. However, those boundaries are still used to show or hide out nodes based on your filters.
To rearrange nodes, click and drag. Note that in this view, your changes are NOT cached. For information on the edge paths, node states, locks, and more, see the Legend tab.
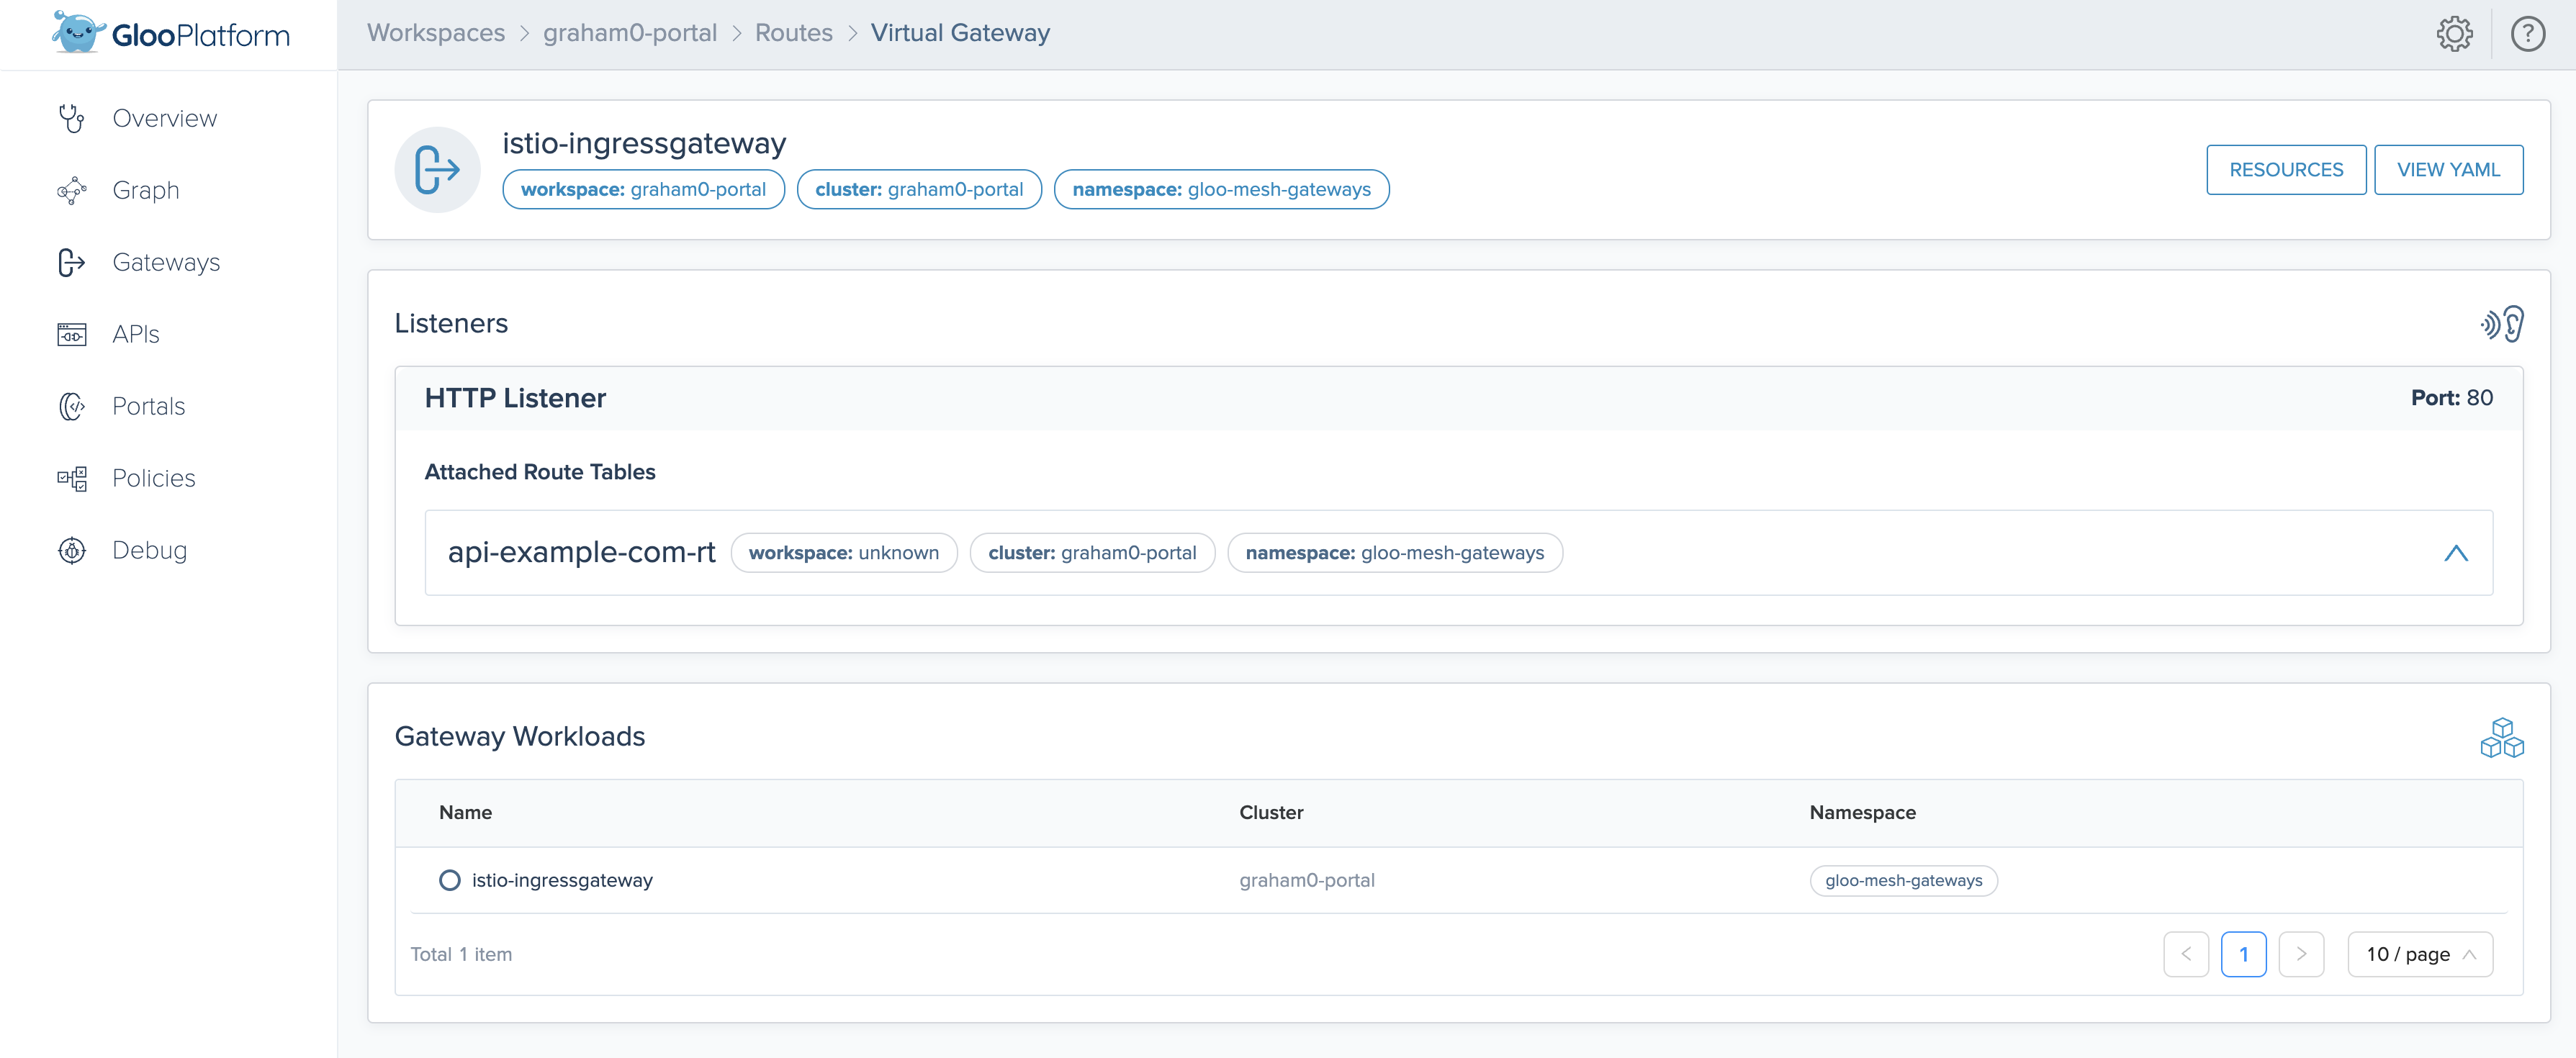
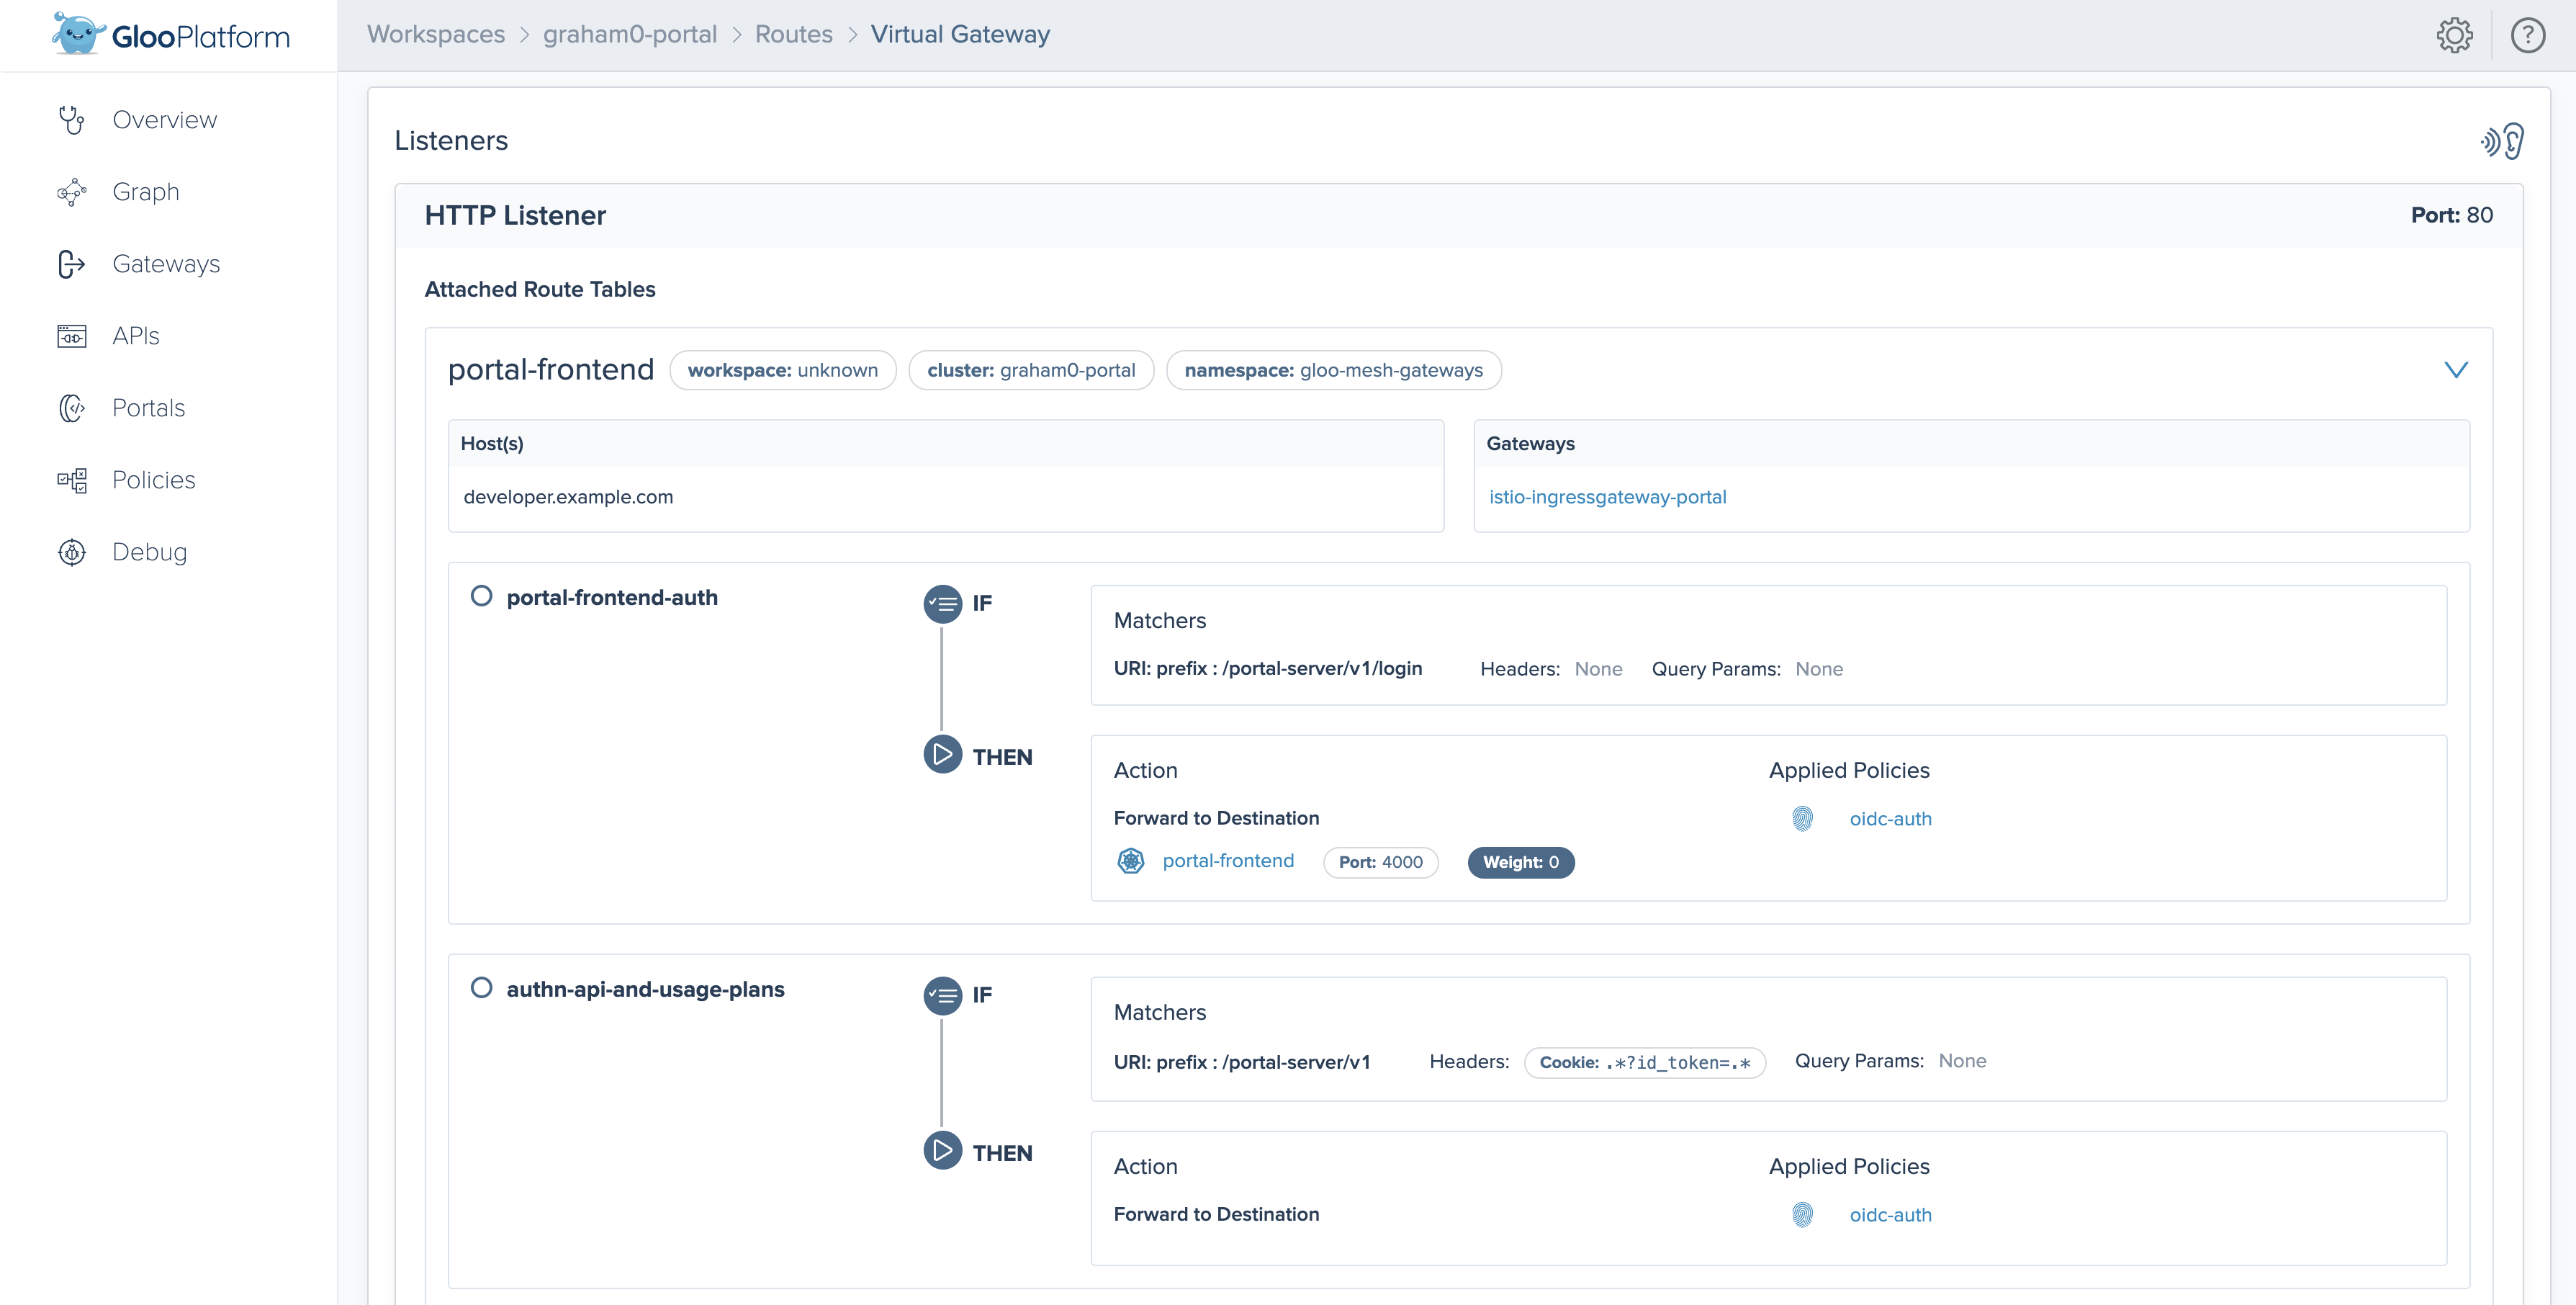
Gateways
Gloo Gateway license only: Virtual gateways are used to consistently configure traffic into and across your environment. Click a gateway to view its details. The details are organized into the following areas.
- Metadata, including the workspace, cluster, namespace, and YAML configuration file.
- Listeners for HTTP and HTTPS traffic, organized into attached route tables that configure what paths the gateway listens on. Expand a route table to view more details, such as the if-then routing matchers and actions.
- Gateway Workloads to review the health of gateway deployments.
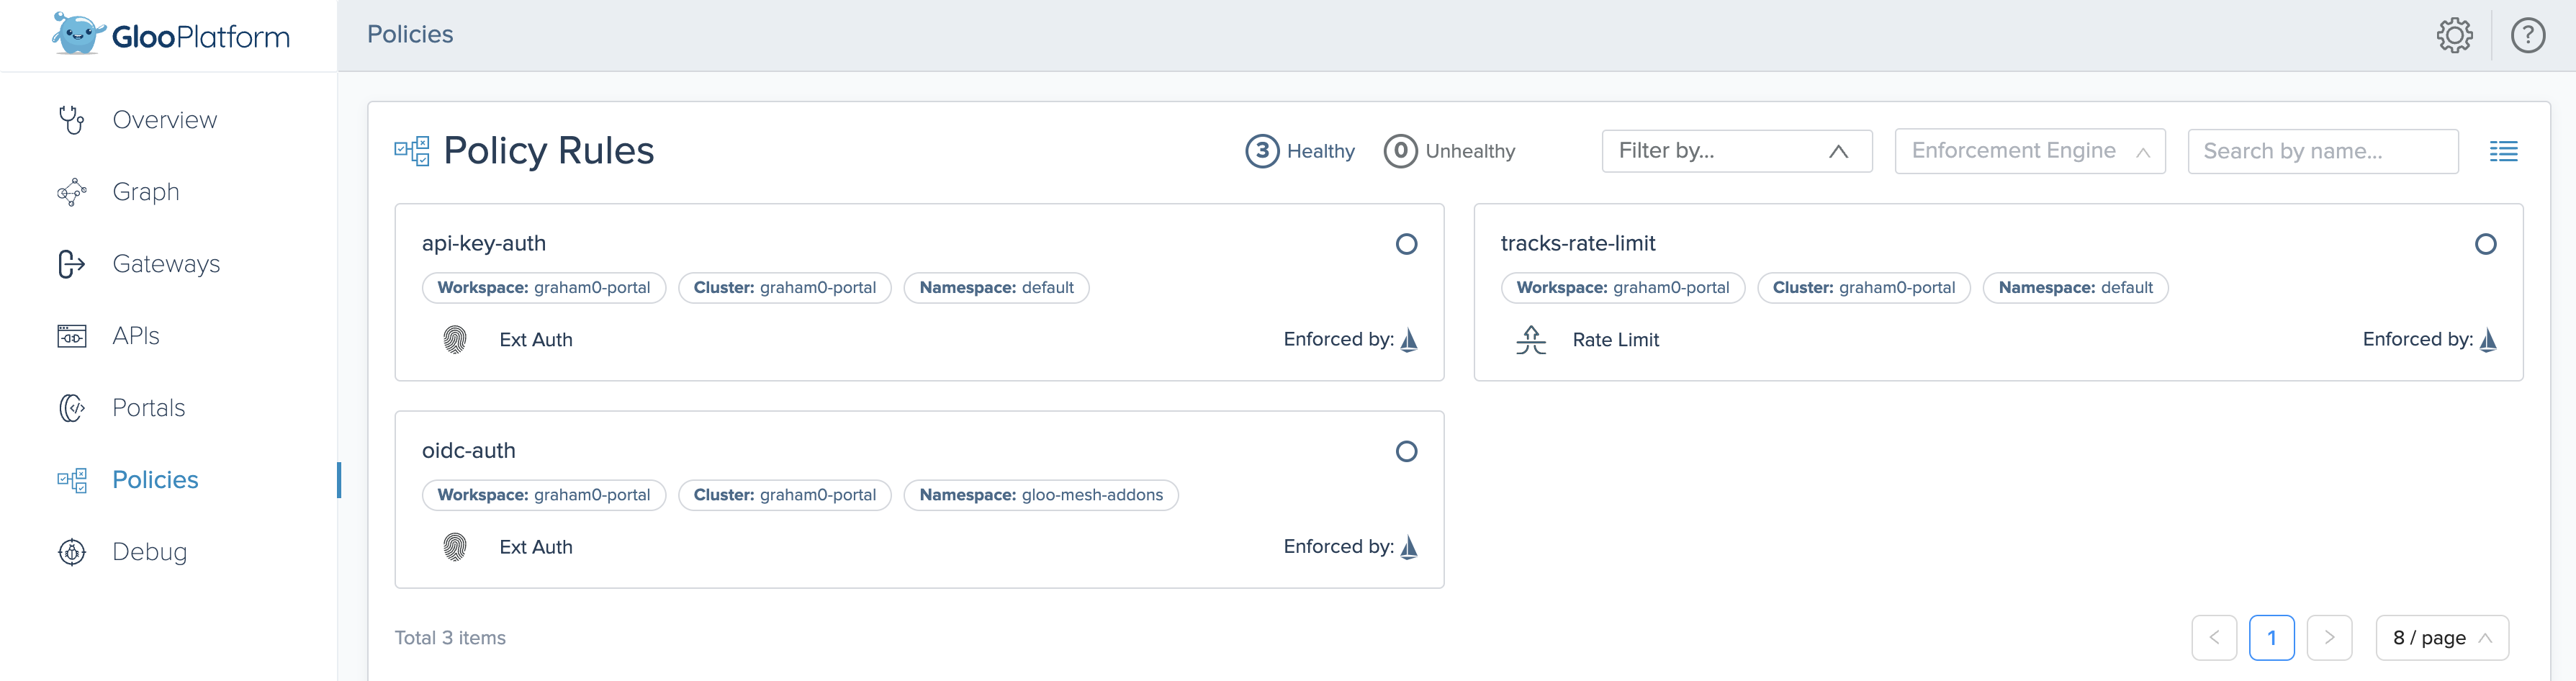
Policies
Use Gloo policies to control the traffic for your workloads. From the Policies page, you can review information in the following ways:
- Review metadata for the names, workspaces, clusters, and namespaces that policies are in.
- Filter by the type of policy, such as Access or Ext Auth, or by the enforcement engine, such as Istio or Cilium.
- Search by name of the policy.
Click a policy to review more details, such as the YAML configuration file and the routes, destinations, or workloads that the policy is applied to. Additional information varies by type of policy.
For more information, see Policies.
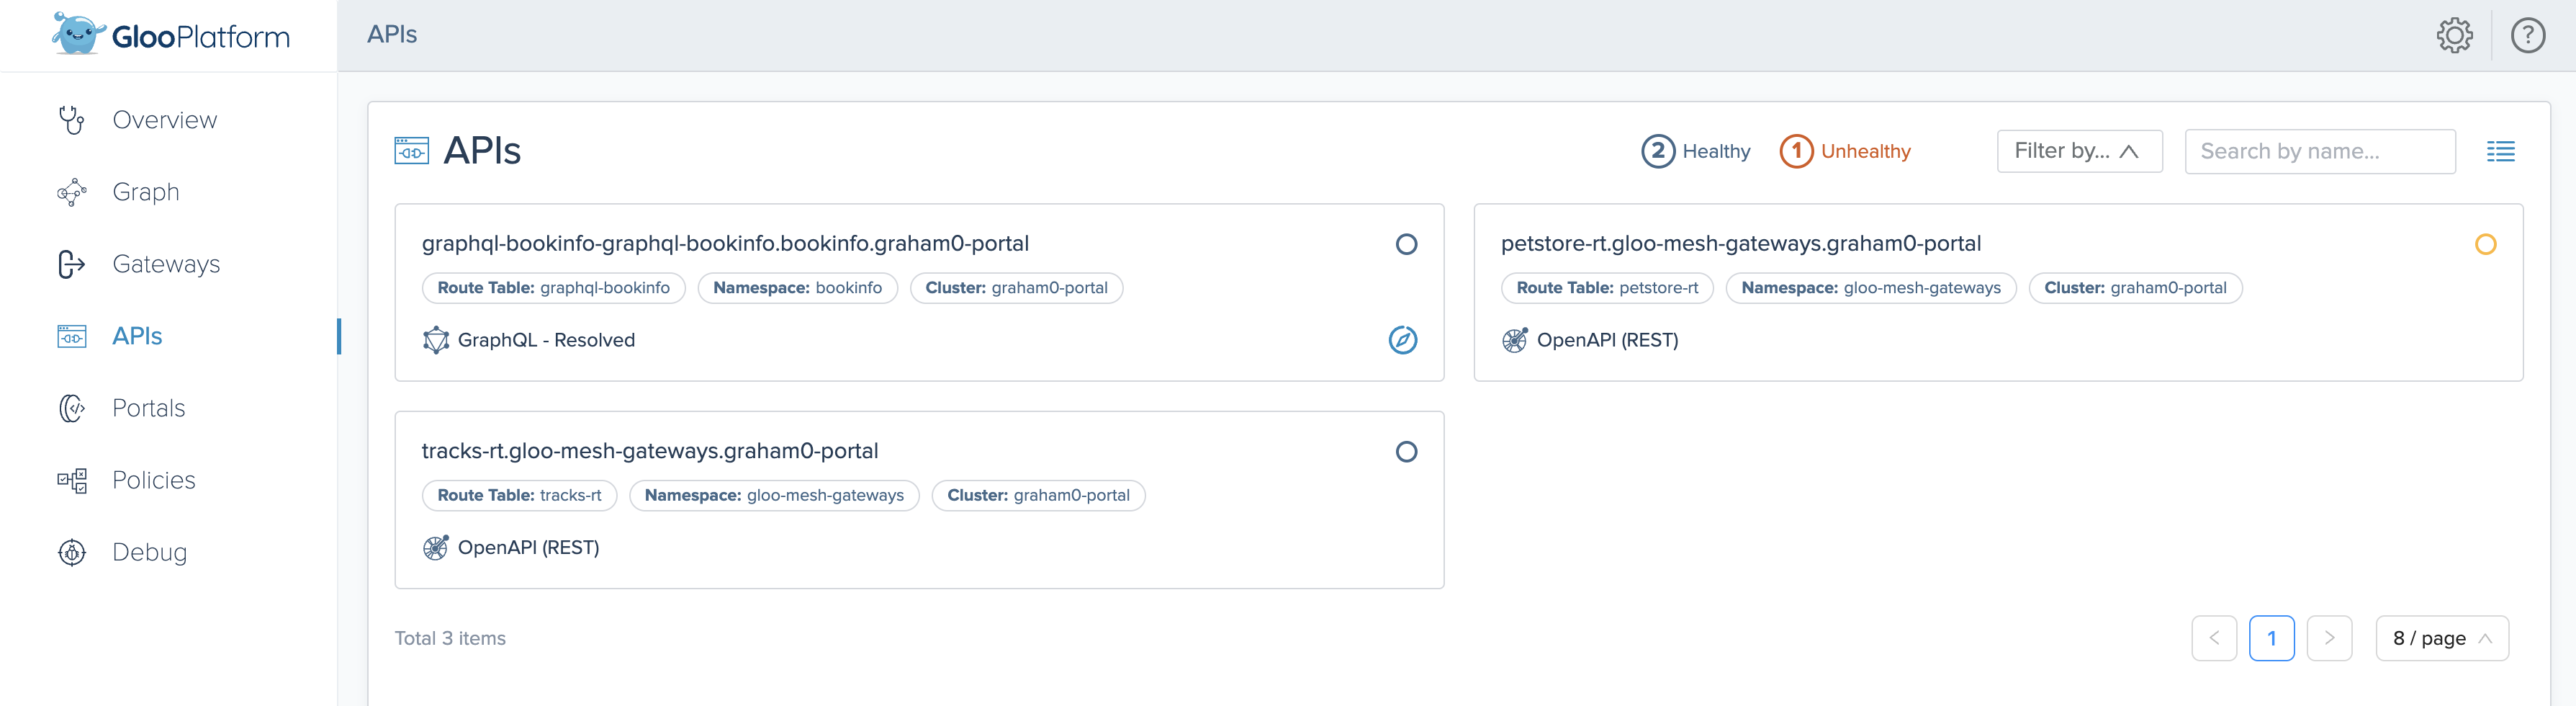
APIs
From the APIs page, you can review route tables that are backed by the following types of APIs:
- REST APIs that you bundle together into API product to use with Gloo Platform Portal.
- GraphQL APIs that you use with Gloo Platform GraphQL.
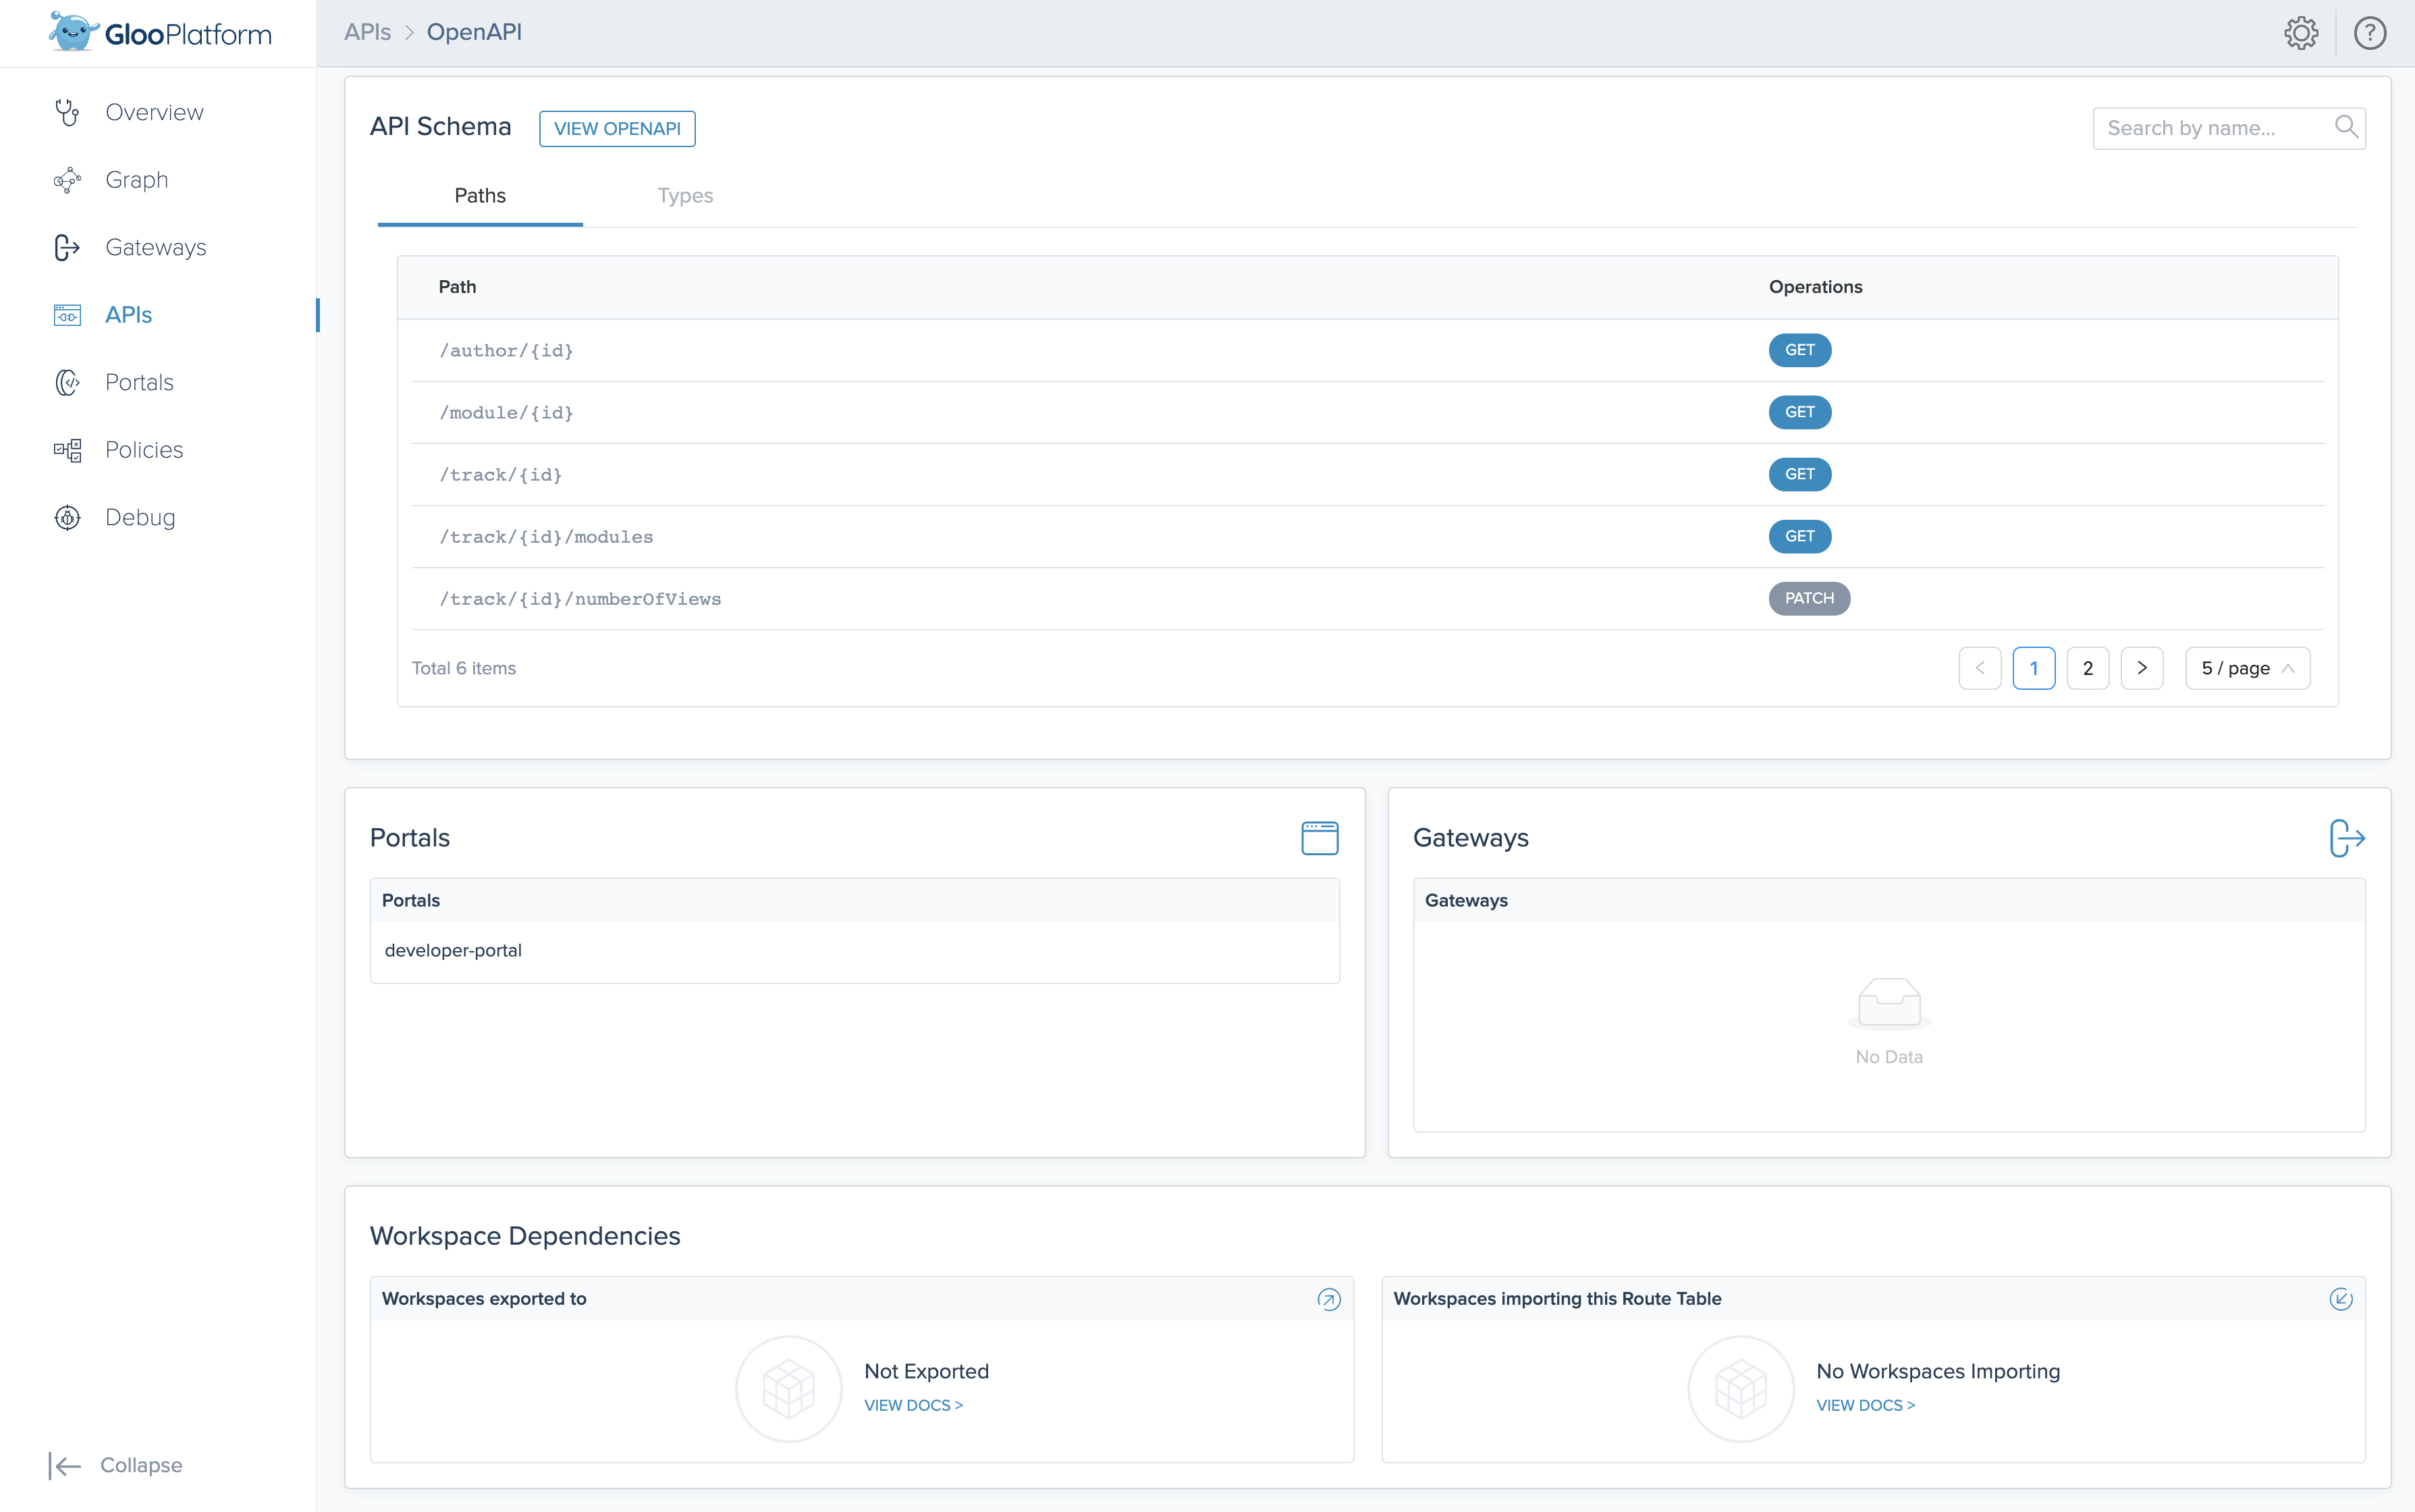
To review the details of the APIs in your route table, click the route table. Then, you can review the OpenAPI schema and paths, as well as other information such as the portals and gateways that the APIs are exposed on or the backing destinations.
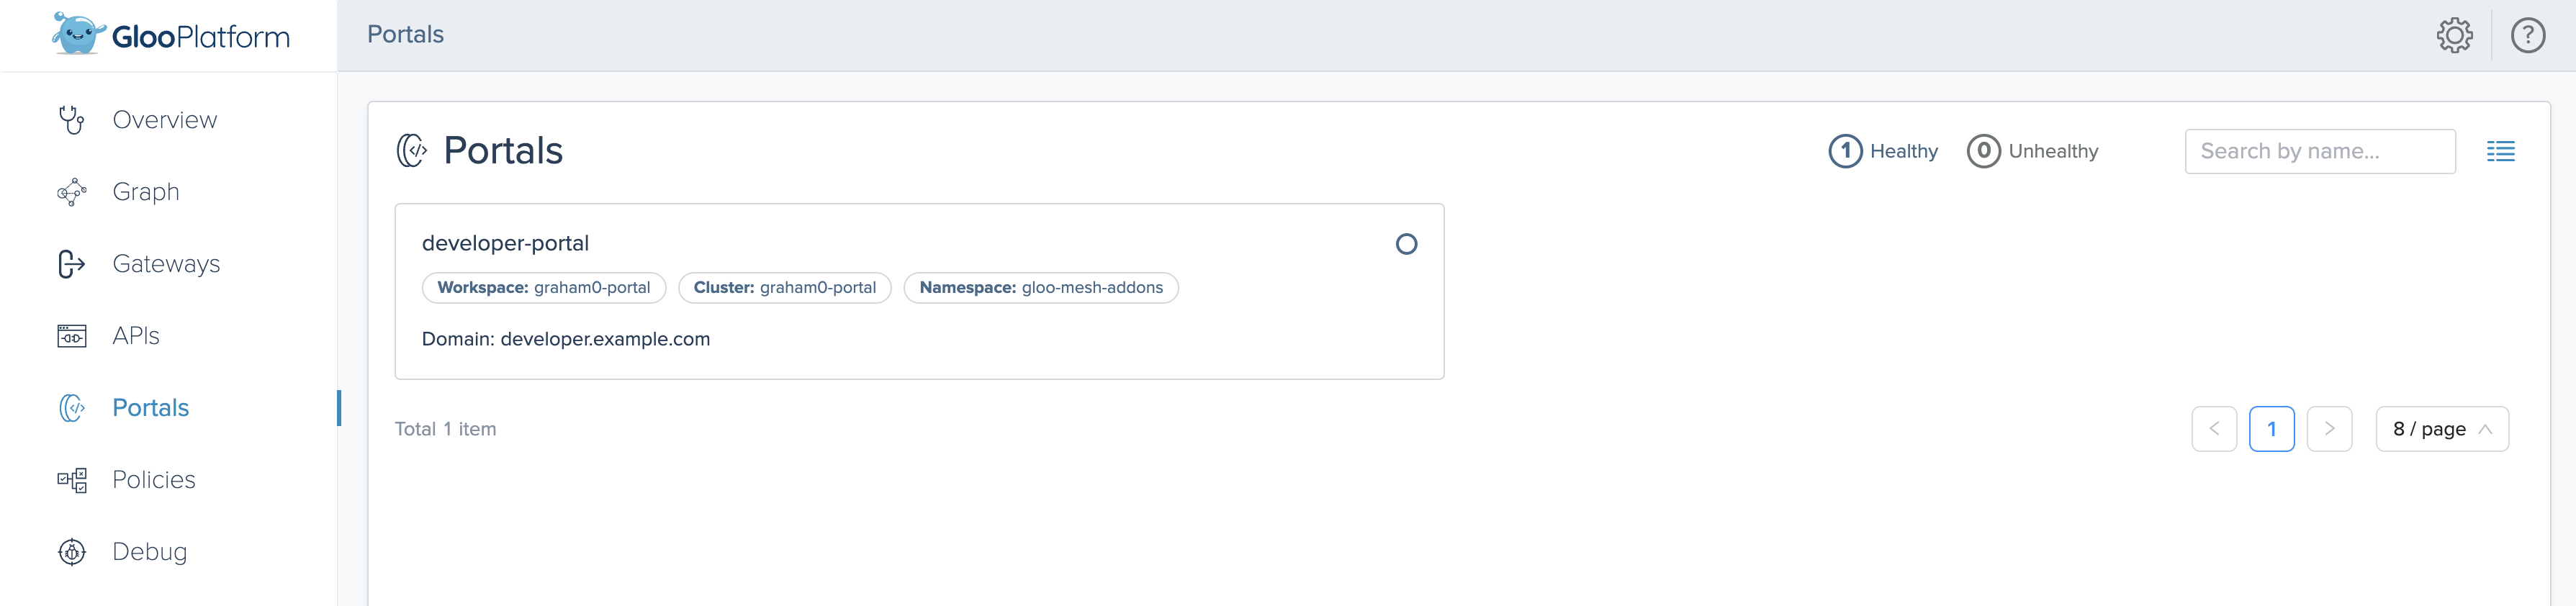
Portals
With Gloo Platform, you can expose your APIs in user-facing developer portals. This way, your end users can browse through your API products, see the usage plans you offer per product, review the OpenAPI docs, and even generate API keys to securely access your APIs. For more information, see Portal.
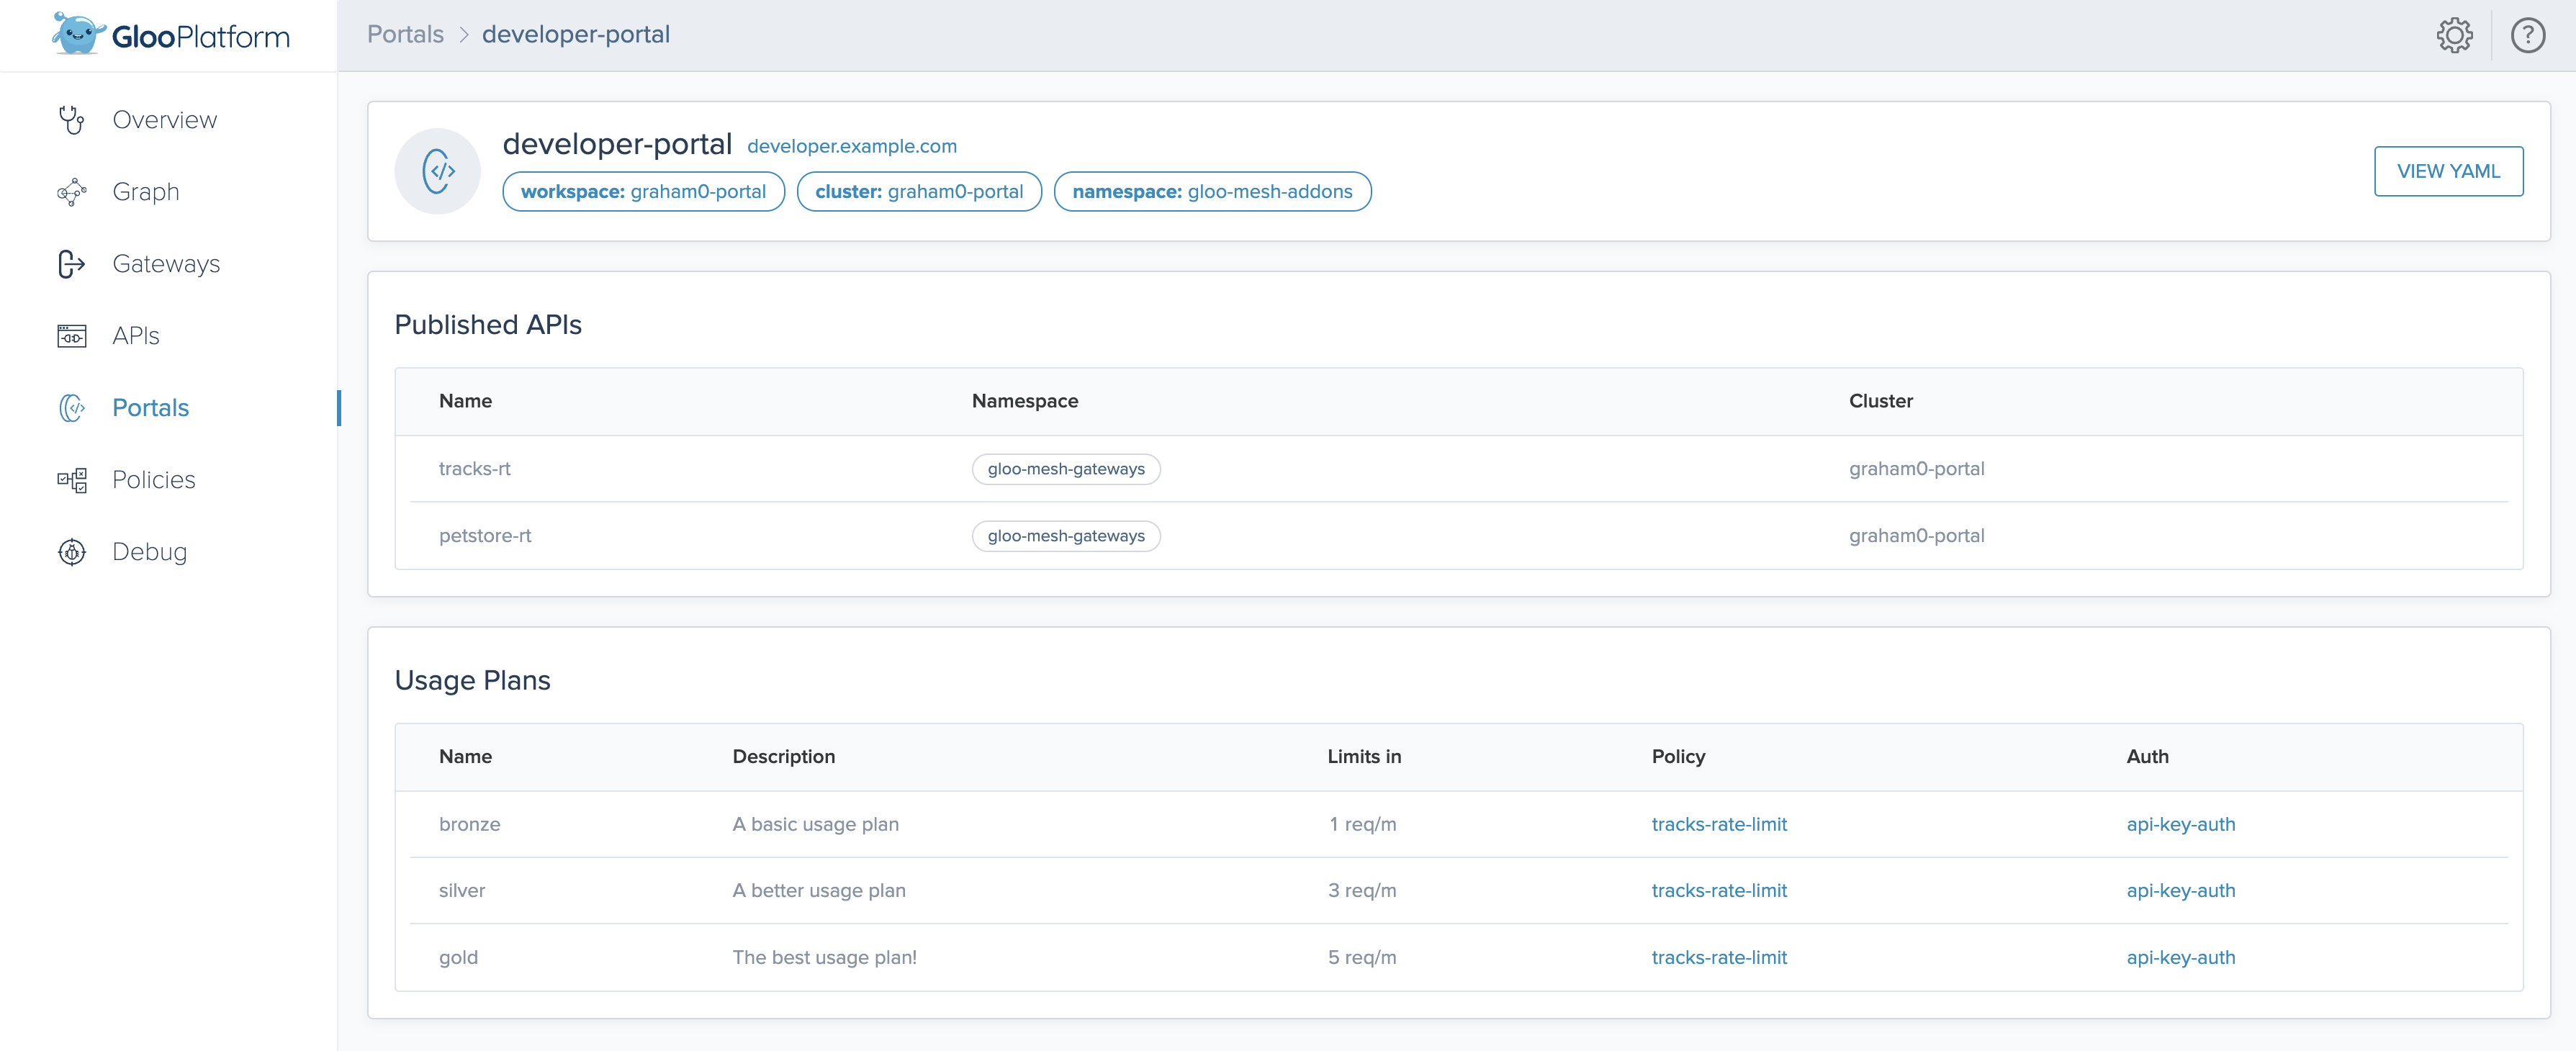
To view more details, click a portal.
- Published APIs are the API products that are exposed in your developer portal. These API products are route table that you can also review in the APIs tab, to see more information such as the OpenAPI spec and paths. For more information, see Bundle your APIs into API products.
- Usage Plans are the rate limiting and external auth policies that are associated with the portal. You create different plans depending on your product and pricing strategies for your APIs. For example, you might have bronze, silver, and gold usage plans, or a “freemium” plan. For more information, see Prepare usage plans.
Debug
From the Debug page, you can view and download the full configuration of the Istio or Cilium resources that your Gloo Platform custom resources are translated into. These translated resources control the service mesh and network traffic within your environment.
When you experience issues, check these translated resources to start debugging. For more information, see Troubleshooting.
Next Steps
If your Gloo UI looks a bit sparse, try creating some Gloo Platform resources such as policies.