Gloo UI
Monitor the health of your gateway and review workspace, networking, and policy configurations with the Gloo UI.
About the Gloo UI
The Gloo UI is automatically installed in the Gloo management cluster. Let's explore some of the key features that you have access to when using the Gloo UI:
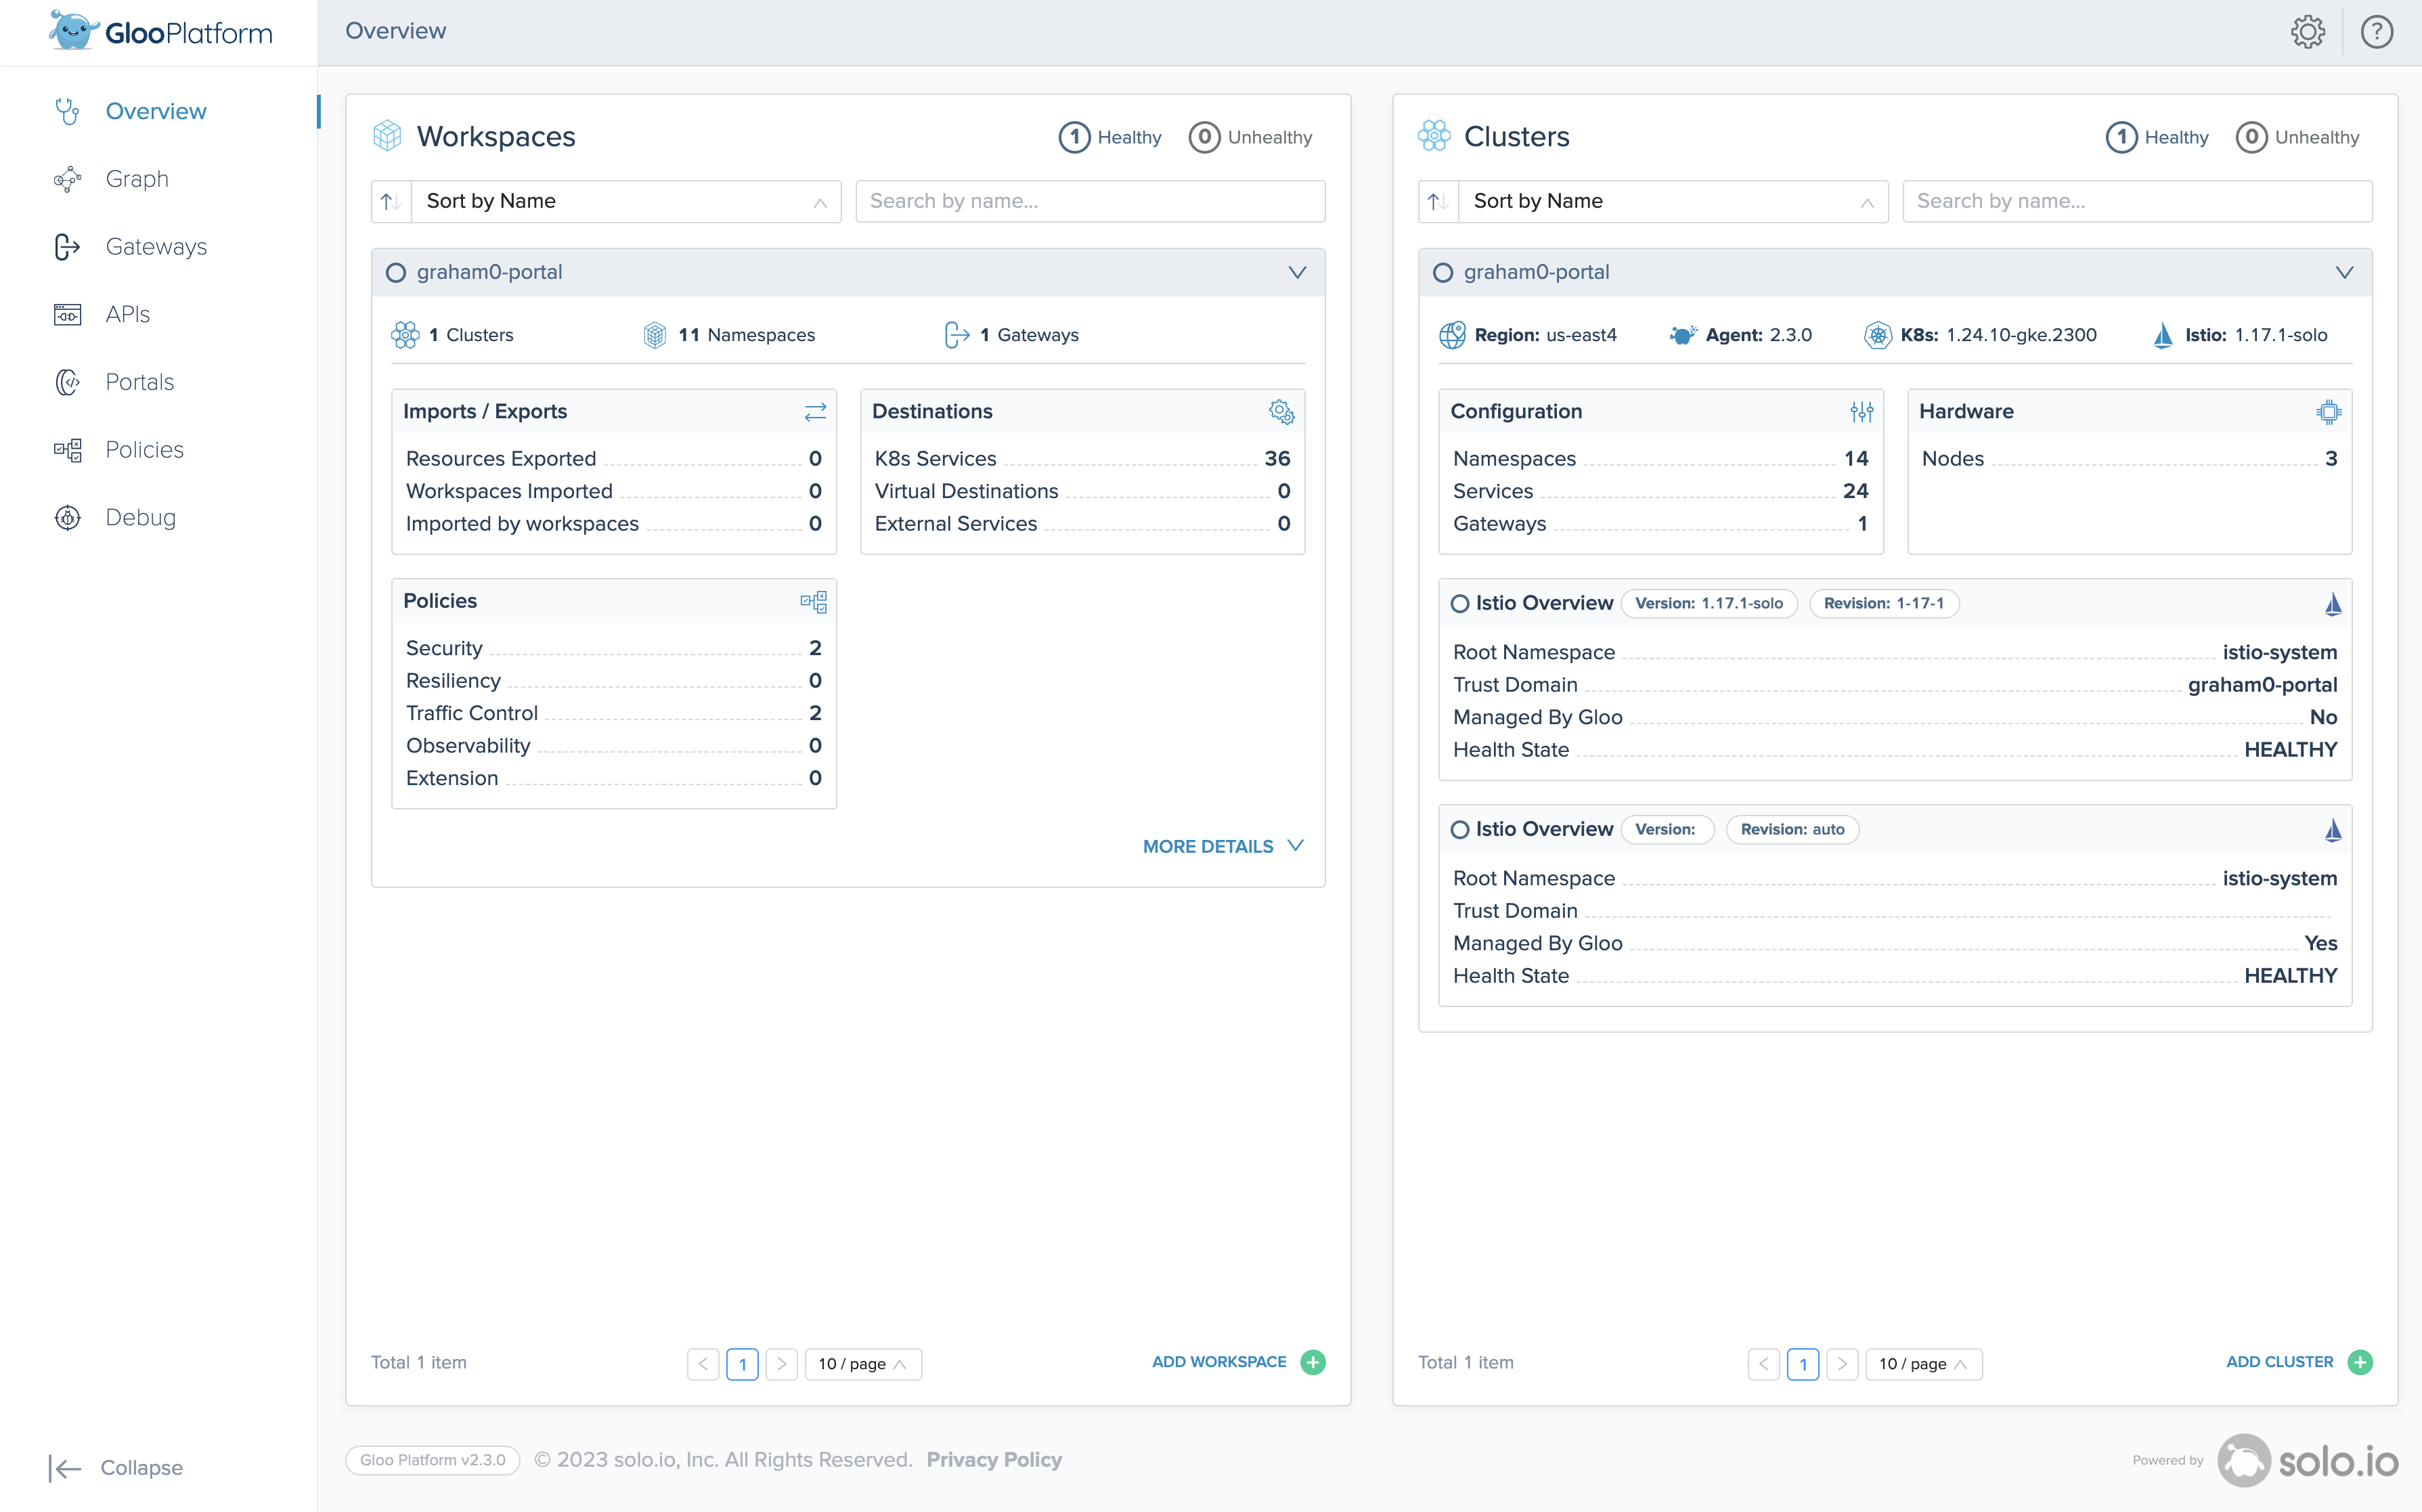
- Gloo Platform overview: With the Gloo UI, you can view information about your Gloo Platform environment, such as the number of clusters that are registered with the Gloo management server and the Istio version that is deployed to them. You can also review your workspace settings and which Gloo Gateway resources you import and export to other workspaces.
- Verify gateway configurations: The Gloo UI lets you quickly find important information about your gateway setup, such as configured listeners and the traffic policies that you applied.
- Drill into apps and services: Review what services can communicate with other services, the policies that are applied before traffic is sent to a service, and how traffic between services is secured.
- Visualize and monitor gateway metrics: With the built-in Prometheus integration, the Gloo UI has access to cluster and gateway-specific metrics, such as the cluster's CPU and memory capacity, unresponsive nodes or nodes with degraded traffic, and the total number of requests that were processed by the gateway. For more information about the Prometheus integration, see Prometheus.
For a detailed overview of what information you can find in the Gloo UI, see Explore the Gloo UI.
To further protect the Gloo UI from unauthorized users, set up authentication and authorization (AuthN/AuthZ) for the Gloo UI by using OpenID Connect (OIDC) and Kubernetes role-based access control (RBAC). The Gloo UI supports OpenID Connect (OIDC) authentication from common providers such as Google, Okta, and Auth0. For more information, see Set up external auth for the Gloo UI.
Monitored metrics in the Gloo UI
The Gloo UI monitors and visualizes the following metrics from the built-in Prometheus server for the workloads in your cluster. You can see and work with these metrics by using the Gloo UI Graph.
istio_requests_total: This metric is used to determine the number of total requests, successful and failed requests that passed the ingress gateway proxy.istio_request_duration_milliseconds_bucket: To determine the latency between microservices, the Gloo UI monitors the milliseconds it takes for a request to be routed from the gateway to its destination.
To learn more about the built-in Prometheus server and the metrics that are available to you, see Prometheus.