Overview
To monitor the health of your Gloo Mesh Gateway components, you can leverage pre-built Grafana dashboards.
About
Grafana is an open source interactive data-visualization platform that allows you to see data via charts and graphs that are unified into one dashboard.
Operations dashboard
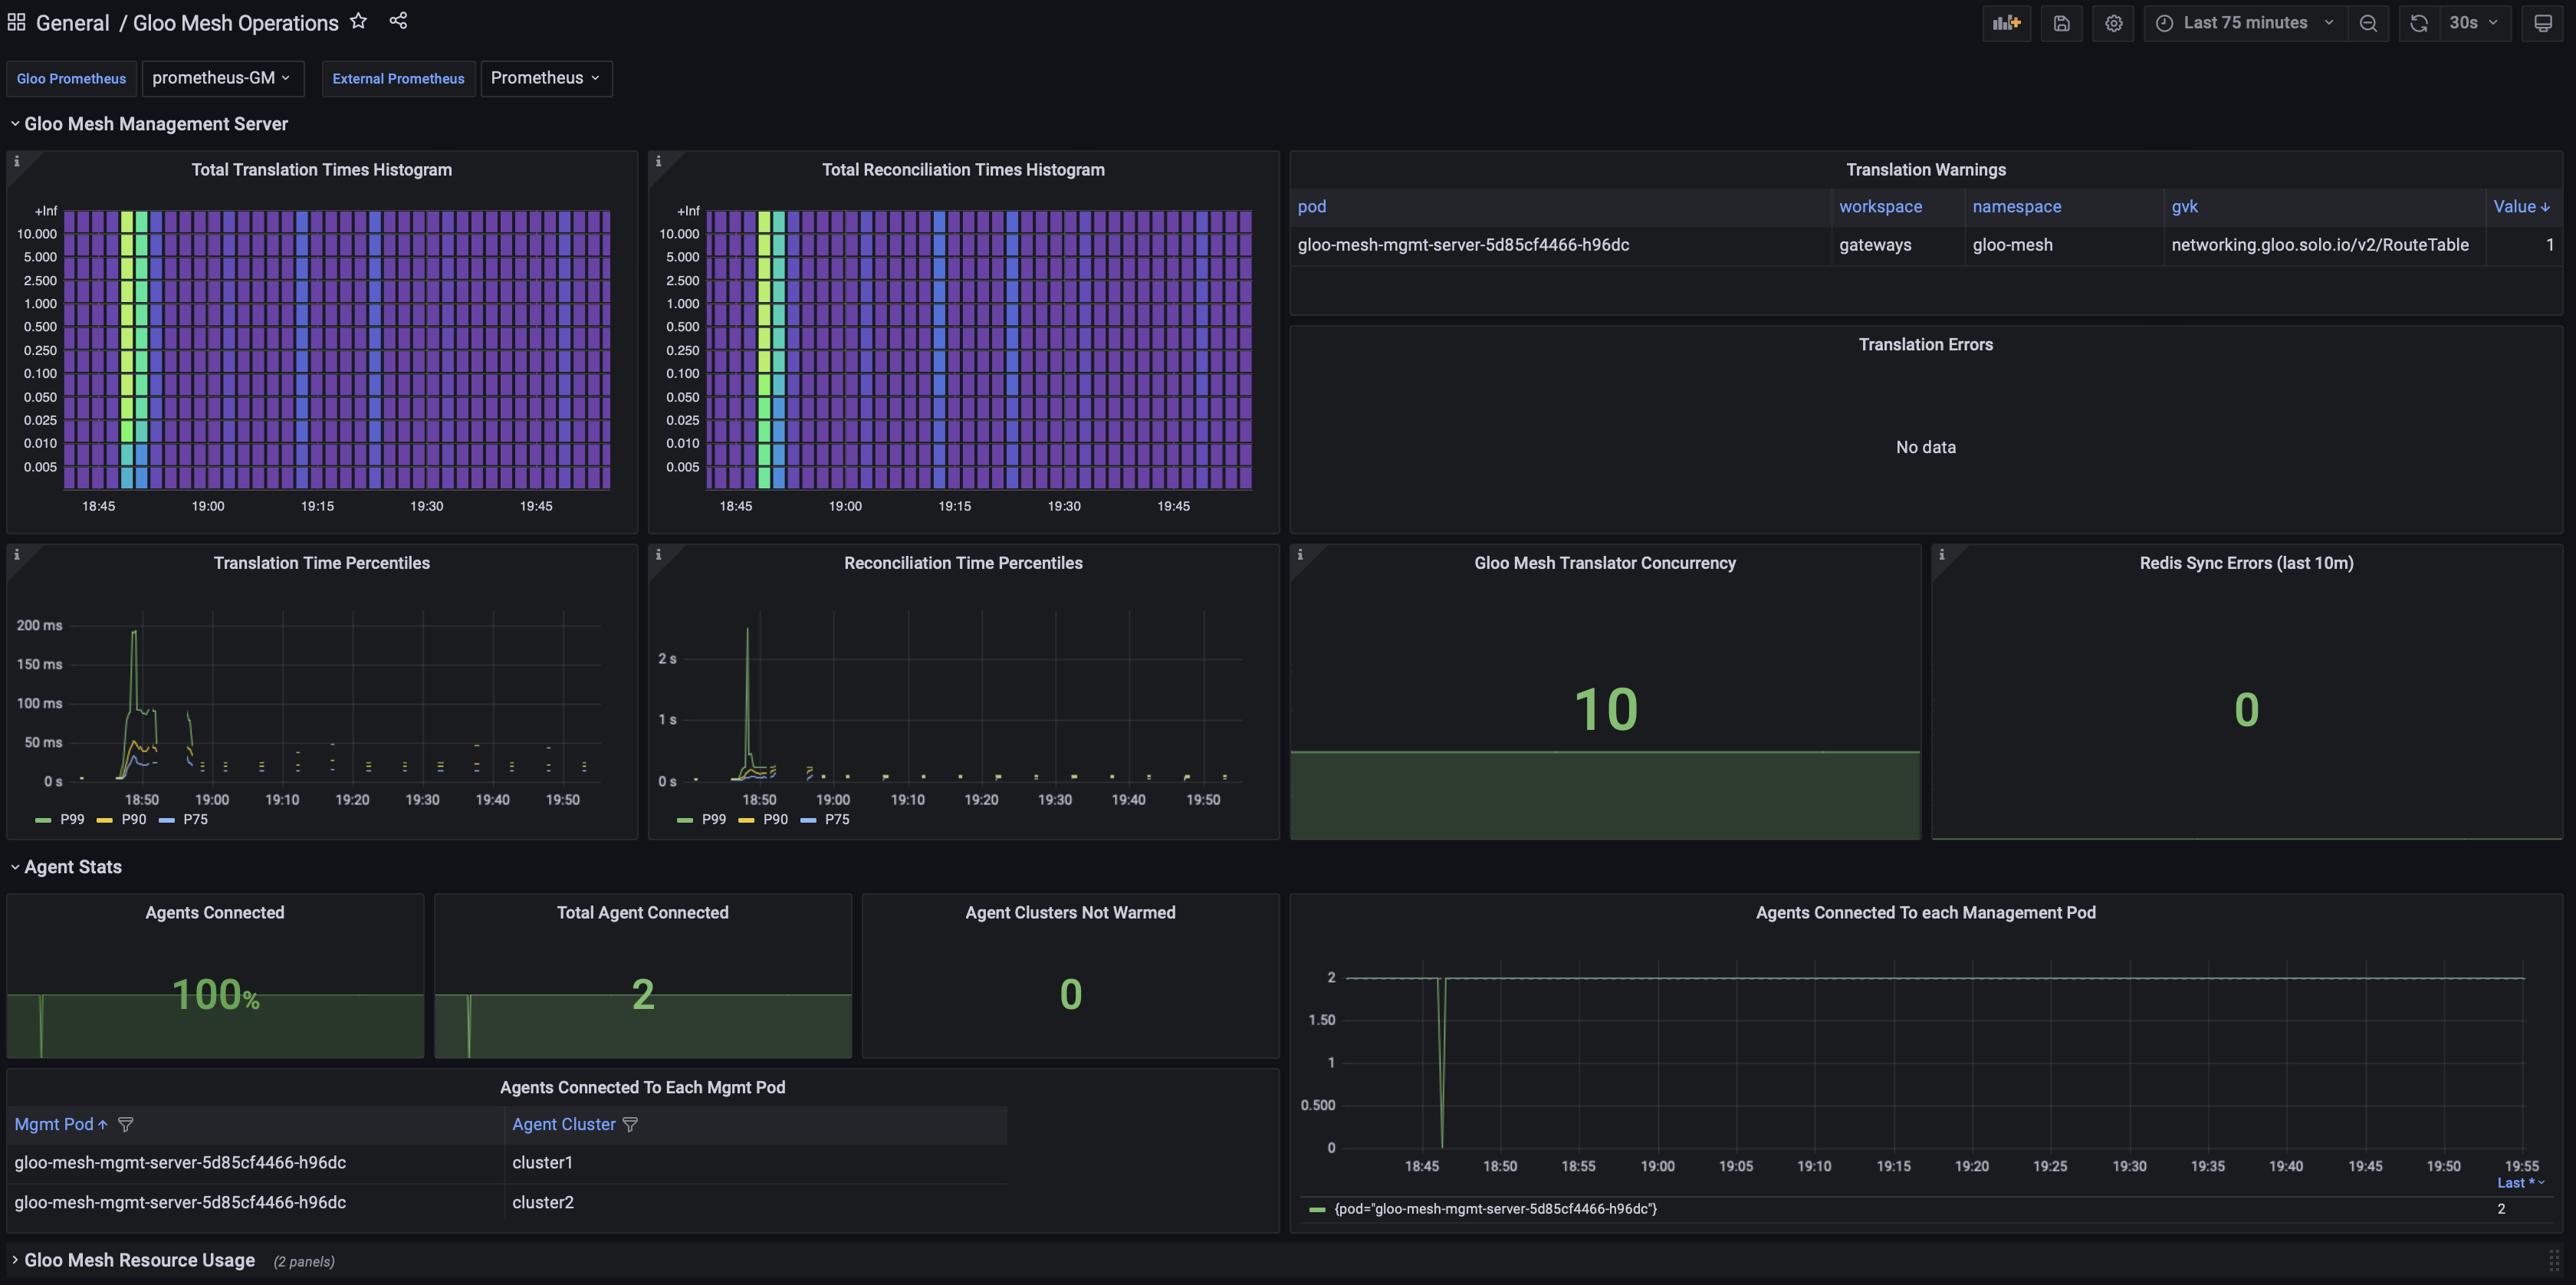
The operations dashboard lets you monitor the health of your Gloo Mesh Gateway environment, such as the average translation and reconciliation time for the Gloo management server, or translation errors that occurred. Built on top of Grafana and integrated with the Gloo Prometheus server, the dashboard is configured to visualize critical Gloo Mesh Gateway metrics and alerts for you so that you can quickly see errors and the performance of Gloo Mesh Gateway components.
With the operations dashboard, you have access to the following key features:
Gloo Mesh Gateway metrics and alerts: Quickly view critical Gloo Mesh Gateway metrics and alerts to determine the health of your Gloo Mesh Gateway environment. The dashboard is organized into different sections that provide an overview of the Gloo management server’s and agent’s status, and the overall Gloo Mesh Gateway resource consumption. Populated metrics and alerts are retrieved from the built-in Prometheus server.
For an overview of available metrics, see Gloo management server metrics. To find a detailed overview of the alerts that are automatically configured for Gloo Mesh Gateway components, see Alerts.
Resource consumption: Monitor the CPU and memory usage of Gloo components, such as the Gloo agents and management server pods.
The operations dashboard is not automatically set up when you install Gloo Mesh Gateway. To access the dashboard, you must follow these steps:
OPA dashboard
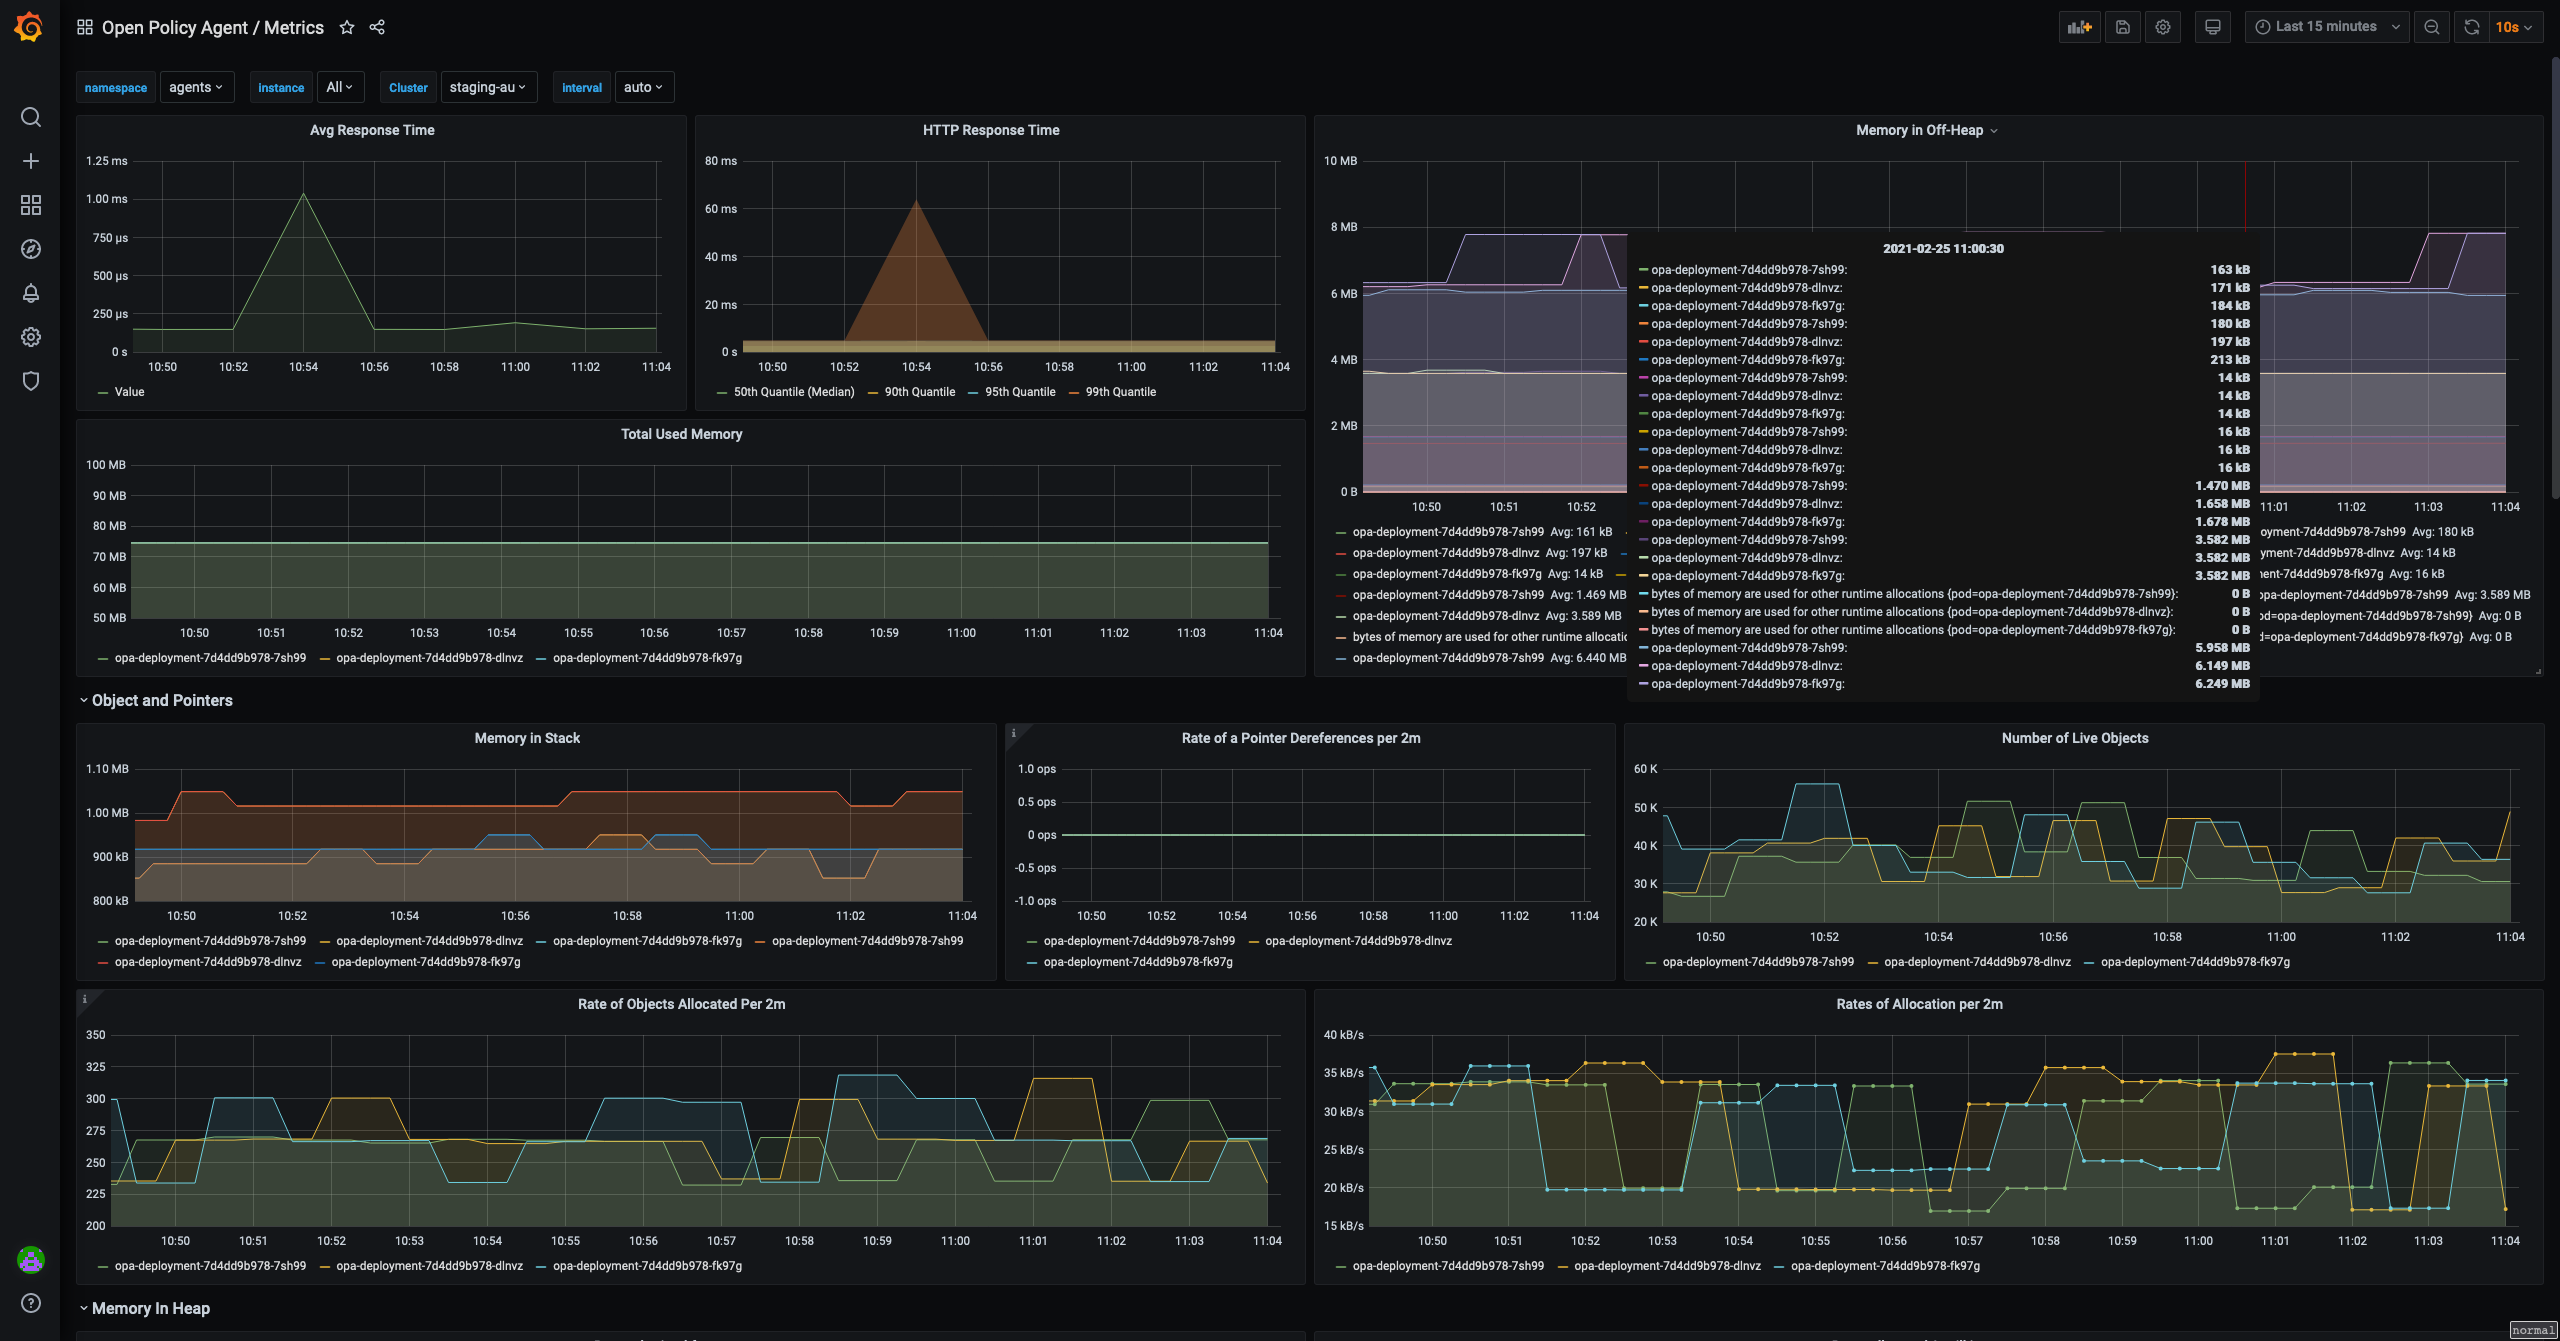
When you import the pre-built OPA dashboard to Grafana, you gain access to the following key features that can help you monitor the health of your Open Policy Agent components:
- Performance metrics for the OPA engine: Monitor the average CPU and memory consumption of the OPA engine.
- Performance metrics for requests and responses: Track the average duration, size, and other key metrics for the requests and responses to and from the OPA engine.
- Status metrics: Monitor the health of your OPA environment, including whether bundles are successfully loaded. This way, you can better troubleshoot issues with policy enforcement that can arise when the bundles or OPA engine is not healthy.
The OPA dashboard is not automatically set up when you install Gloo Mesh Gateway. To access the dashboard, you must follow these steps:
Portal analytics dashboard
You can enable Istio access logs for the ingress gateway and use the pre-built logs/portal and logs/clickhouse pipelines to capture access logs for the Portal server. These logs track when and how your developer portal was accessed, and are stored in the built-in Clickhouse database.
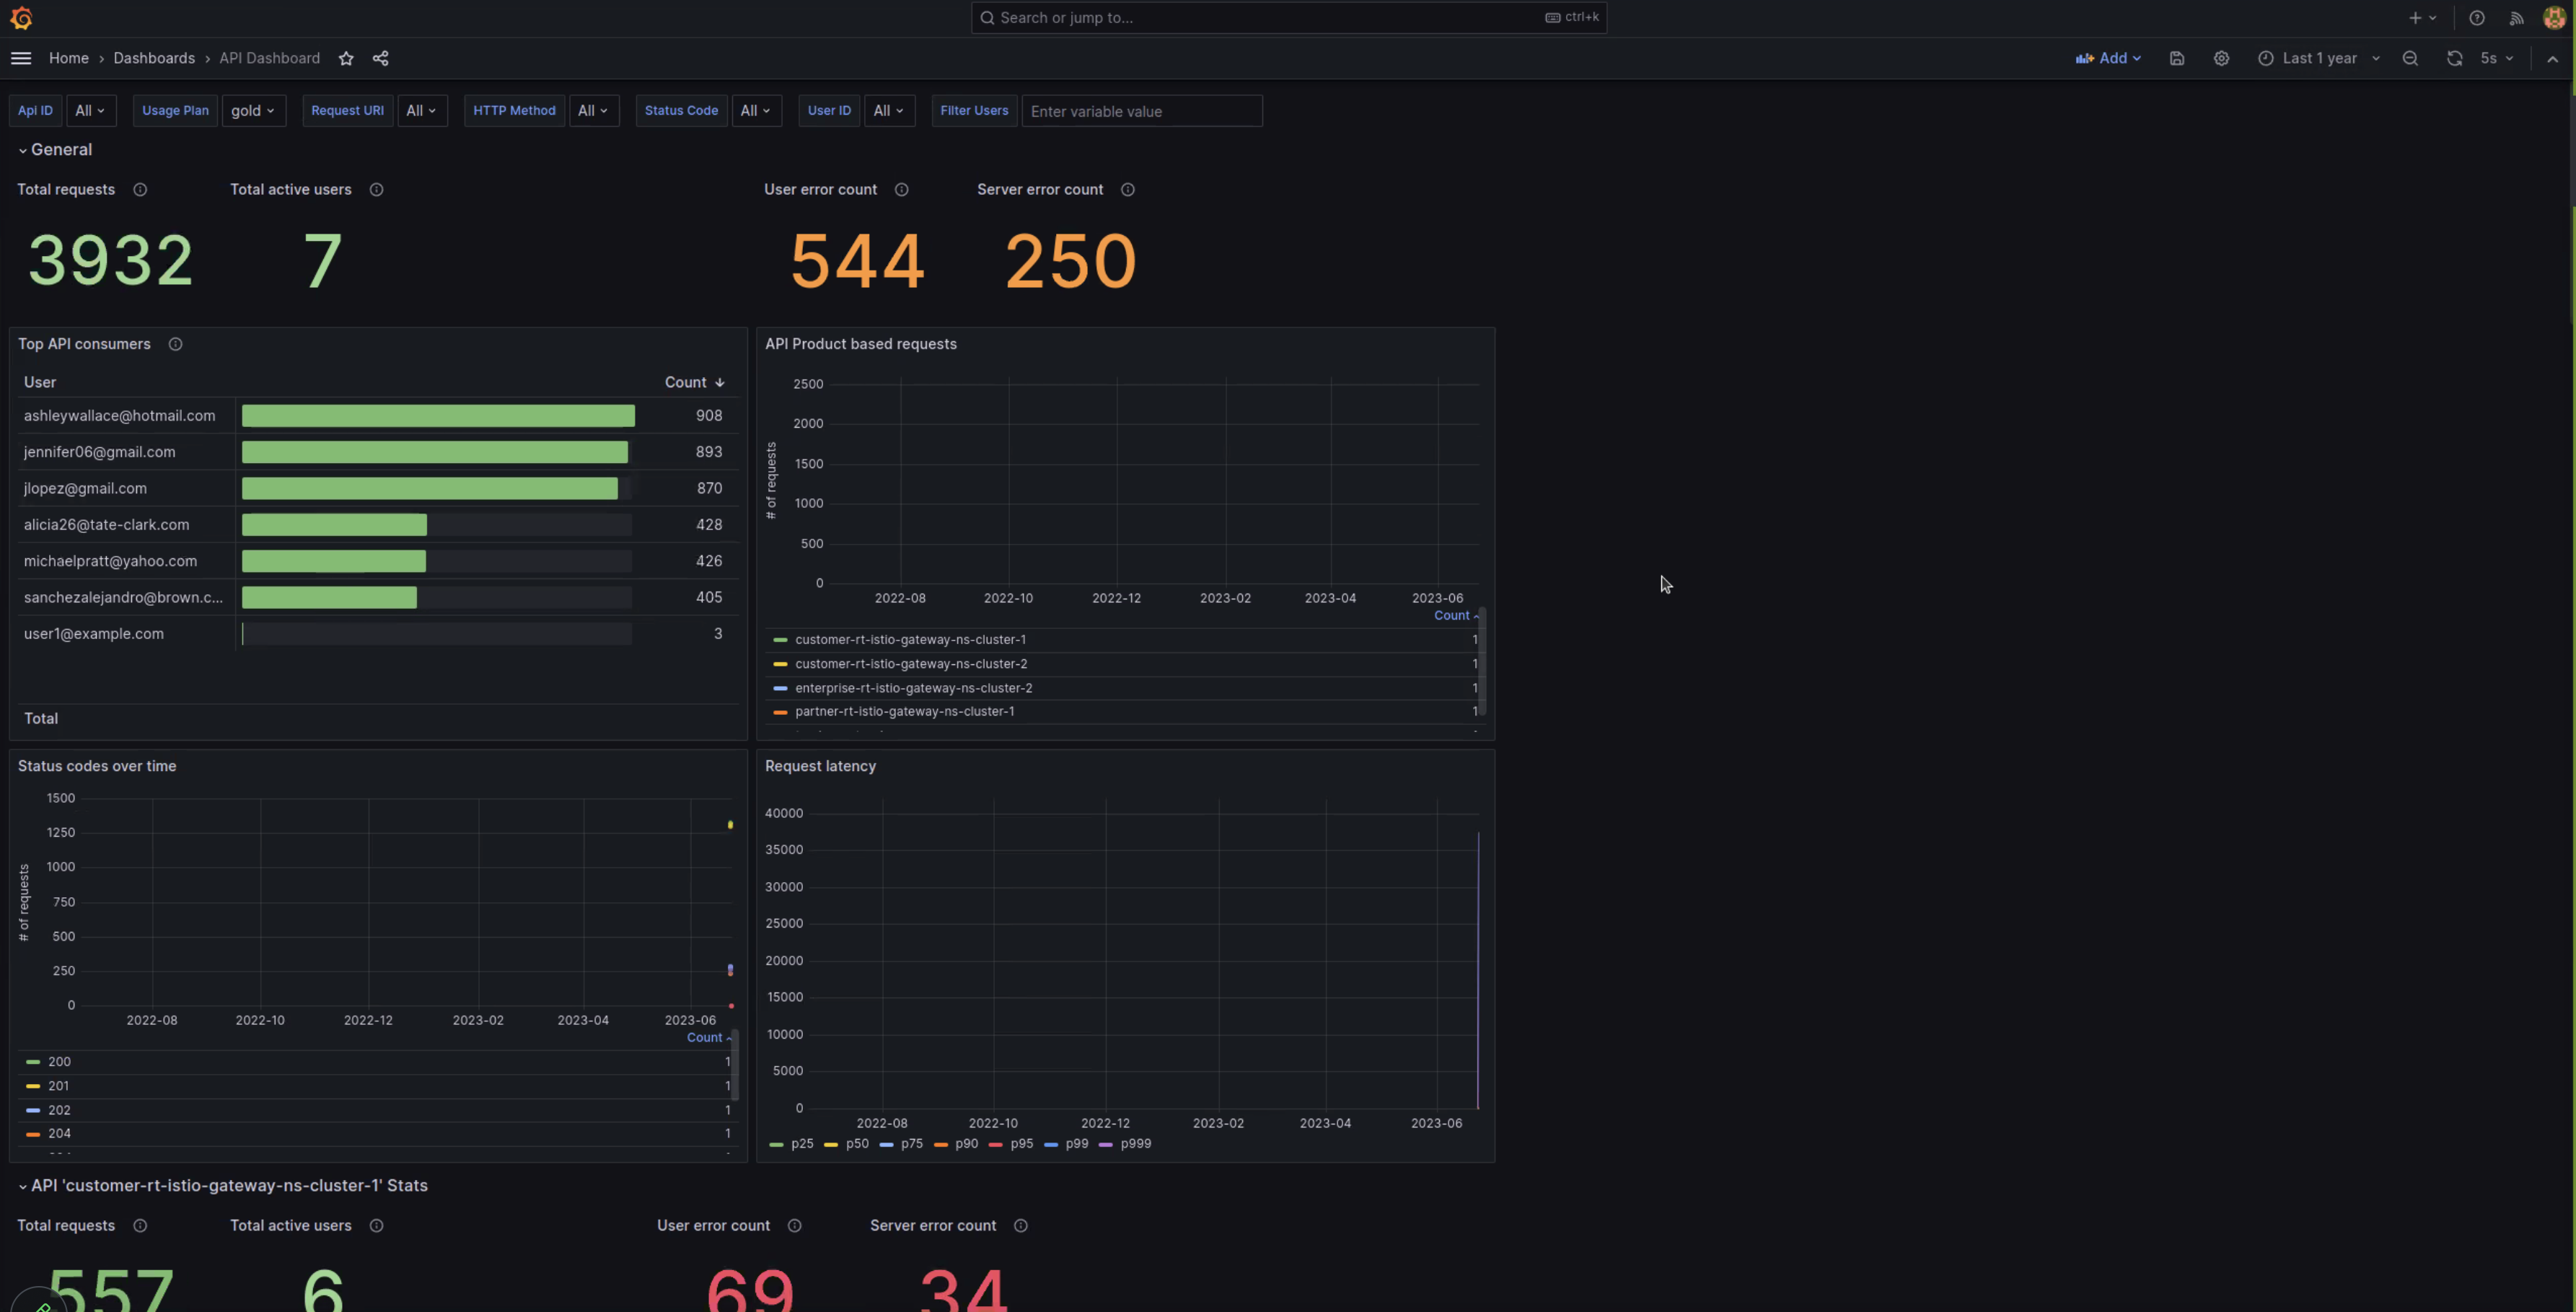
You can configure your Grafana instance to read access logs from the Clickhouse database so that you can Portal analytics in Grafana. Portal analytics help to monitor the following aspects of your Portal setup:
- The number of users that access your developer portal.
- The API products that are accessed.
- The status code that is returned to users when accessing API products.
- The latency for requests to your API products.
Portal analytics are not enabled by default when you install Portal in your Gloo Mesh Gateway installation. To enable Portal analytics, you must configure your ingress gateway to emit Istio access logs, and to store them in the pre-built Clickhouse database by using the Gloo telemetry pipeline.
For more information, see Monitor Portal analytics.