UI graph
If you do not see any data in the Gloo UI graph, review the following steps to debug the metrics pipeline and the Gloo UI deployment.
If you see a No visible data message in the UI, traffic might not be visible as nodes might went idle. Go to the Graph Layouts settings and toggle on Idle Nodes.

If you see a No Graph data found message in the UI, no traffic was detected in the timeframe that you selected. Try changing the timeframe and adjust any filters that you added.

If you still do not see any data, ensure that traffic metrics are captured for your requests by using the built-in Prometheus server.
Enable port-forwarding of the Prometheus server deployment.
Open the Prometheus Graph.
In the Prometheus expression browser, search for metrics, such as
istio_requests_total,gloo_gateway_upstream_rq, andistio_tcp_connections_opened_totaland verify that your requests are captured in metrics. If you get anEmpty query result, follow the steps in Monitor the health of receivers, exporters, and processors to verify that metrics are being scraped by the Gloo collector agents and sent to the telemetry gateway.Open the scraping endpoints that are configured for the Prometheus server.
Check for a green UP state, such as in the following figure.
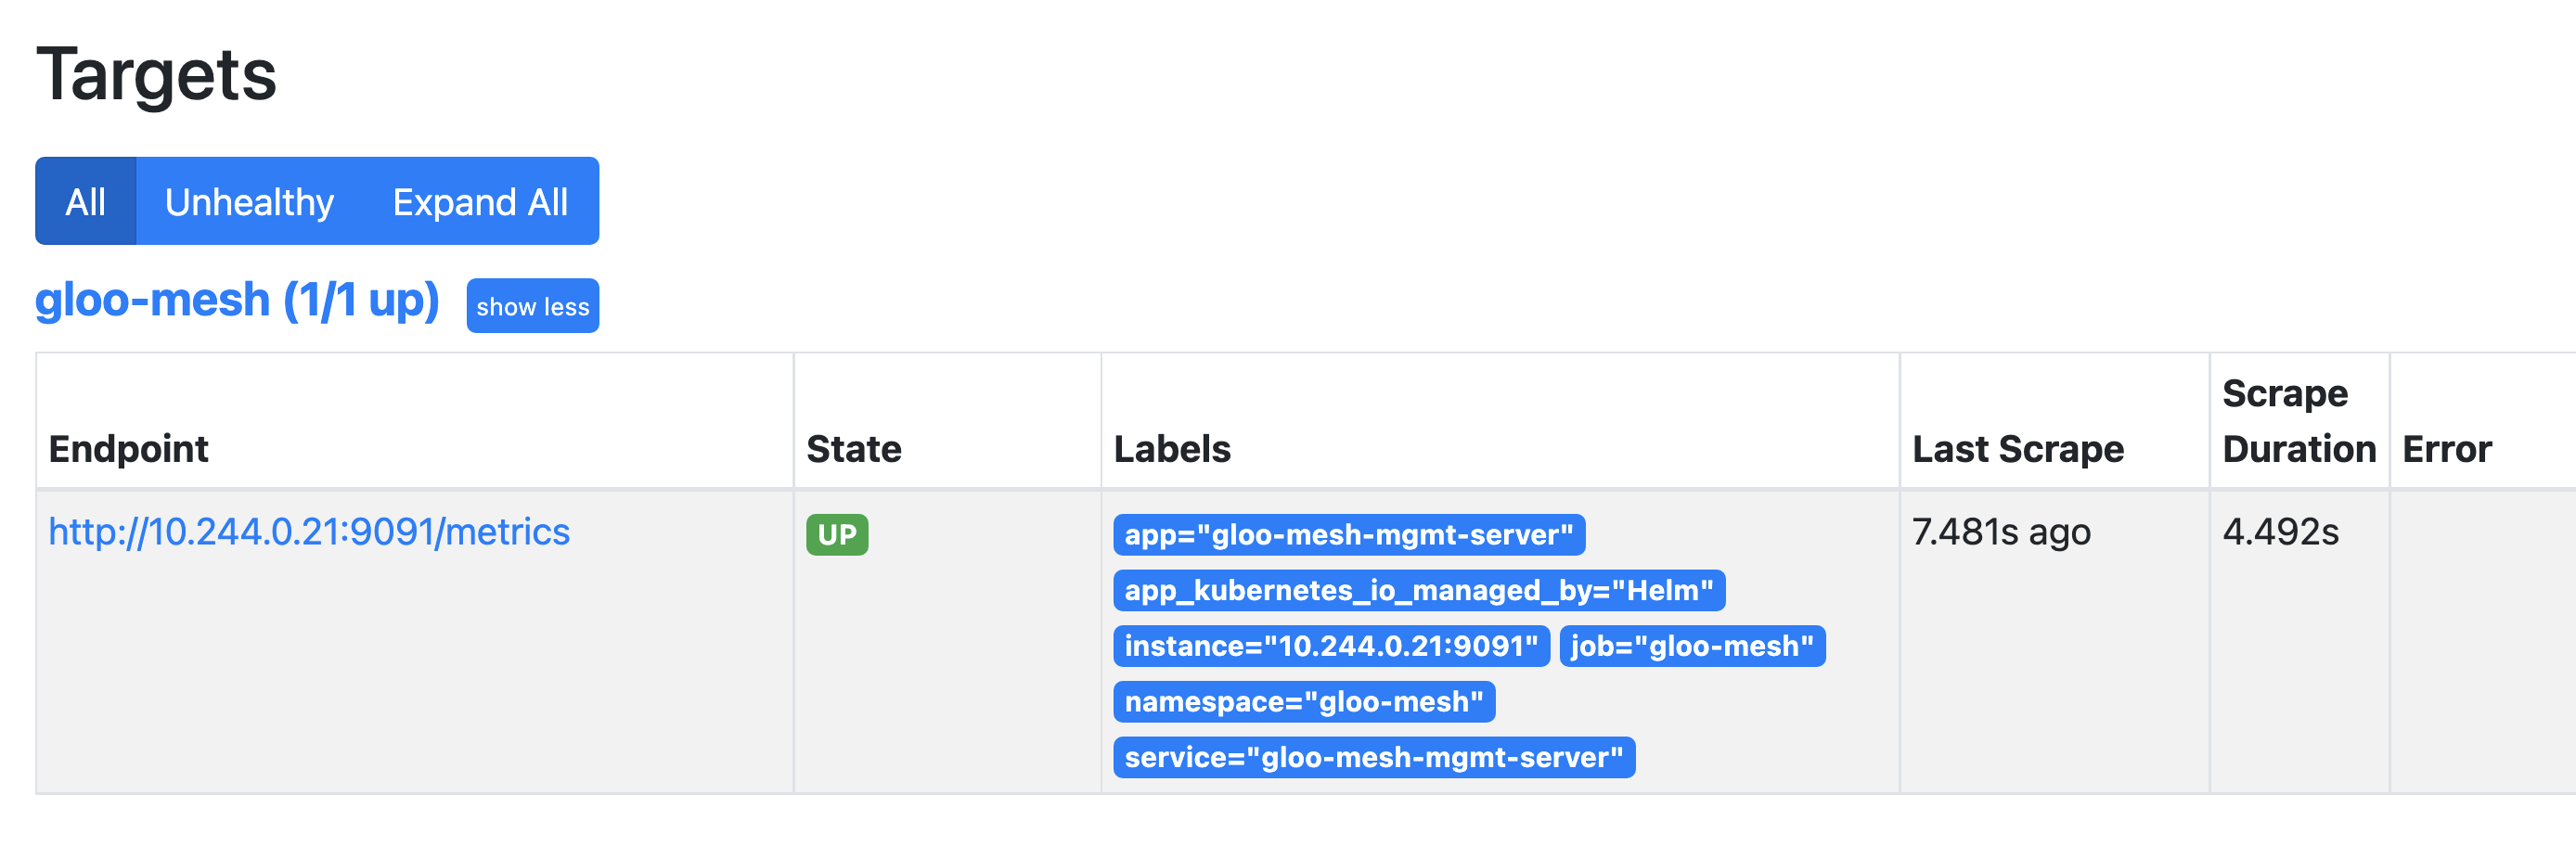
Figure: Example of green **UP** state. Figure: Example of green **UP** state.
If you confirmed that your requests are captured in Prometheus, enable verbose logging for the UI.
If you cannot find the root cause for data not showing up in the Gloo UI Graph, gather a Gloo UI dump and open a ticket with Solo Support.
Open the Gloo UI.
In your web browser, open the console. You can typically access the console when you inspect the web page and navigate to the Network tab.
In the console, enter the following command to get a Gloo UI dump.
Enter a name for your Gloo UI dump and click Ok.
Follow the steps to submit a support request.