Debugging Gloo Edge
At times, you may need to debug Gloo Edge misconfigurations. Gloo Edge is based on Envoy and often times these misconfigurations are observed as a result of behavior seen at the proxy. This guide will help you debug issues with Gloo Edge and Envoy.
The guide is broken into three main sections:
- General debugging tools and tips
- Debugging the data plane
- Debugging the control plane
This guide is intended to help you understand where to look if things aren’t working as expected. After going through, if all else fails, you can capture the state of Gloo Edge configurations and logs and join us on our Slack and one of our engineers will be able to help.
General debugging tools and tips
If you’re experiencing unexpected behavior after installing and configuring Gloo Edge, the first thing to do is verify installation and configuration. The fastest way to do that is to run the glooctl check command. This command will go through the deployments, pods and Gloo Edge resources to make sure they’re in a healthy/Accepted/OK status. Typically if there are problems syncing resources, you would find an issue here.
glooctl check
The output should be similar to:
Checking deployments... OK
Checking pods... OK
Checking upstreams... OK
Checking upstream groups... OK
Checking auth configs... OK
Checking rate limit configs... OK
Checking VirtualHostOptions... OK
Checking RouteOptions... OK
Checking secrets... OK
Checking virtual services... OK
Checking gateways... OK
Checking proxies... OK
No problems detected.
Be sure to use the version of glooctl that matches your installed version, such as 1.13.23.
This will also report errors if the routes or route options were not accepted by the control plane. To better understand the difference between the VirtualService CR, the Gateway CR and the hidden Proxy CR, please check out this concept page. Quickly said, the Proxy CR combines both Gateway and VirtualService resources into a single document.
When using dynamic Upstream discovery (enabled by default), and making changes to those Upstreams (ie, adding TLS), you may end up with misconfigured or Rejected Upstreams that can cause resources that depend on them to show failures (ie, VirtualServices, RouteTable, etc). The command above will also report any wrong configuration.
Another means of verifying the routes sent to Envoy by the Gloo control plane is to run the following command, although it requires some experience with Envoy to decrypt the output:
glooctl proxy served-config
Debugging the data plane
Gloo Edge is based on the Envoy proxy. So, when you find unexpected behaviors with your request handling, here are a few areas to look in Envoy that can aid in debugging. Note, we’ve created some convenience tooling in the glooctl CLI tool which is tremendously helpful here.
Dumping Envoy configuration
If the Proxy resource that gets compiled from your VirtualService and Gateway resources looks okay, your next “source of truth” is what Envoy sees. Ultimately, the proxy behavior is based on what configuration is served to Envoy, so this is a top candidate to see what’s actually happening.
You can easily see the Envoy proxy configuration by running the following command:
glooctl proxy dump
This command dumps the entire Envoy configuration, including all static and dynamic resources. Typically near the end, you can see the VirtualHost and Route sections to verify that your settings are picked up correctly.
A more advanced way of generating the Envoy config dump is to port-forward to one of the gateway-proxy pods and to run the following commands:
# 1. pick a gateway-proxy pod
kubectl -n gloo-system get pod -l "gloo=gateway-proxy"
# 2. port-forward on port 19000
kubectl -n gloo-system port-forward <pod name> 19000 &
# 3a. generate the config dump
curl -X POST 127.0.0.1:19000/config_dump > gateway-config.json
# 3b. optionally include the upstream endpoints in the config dump
curl -X POST 127.0.0.1:19000/config_dump\?include_eds > gateway-config.json
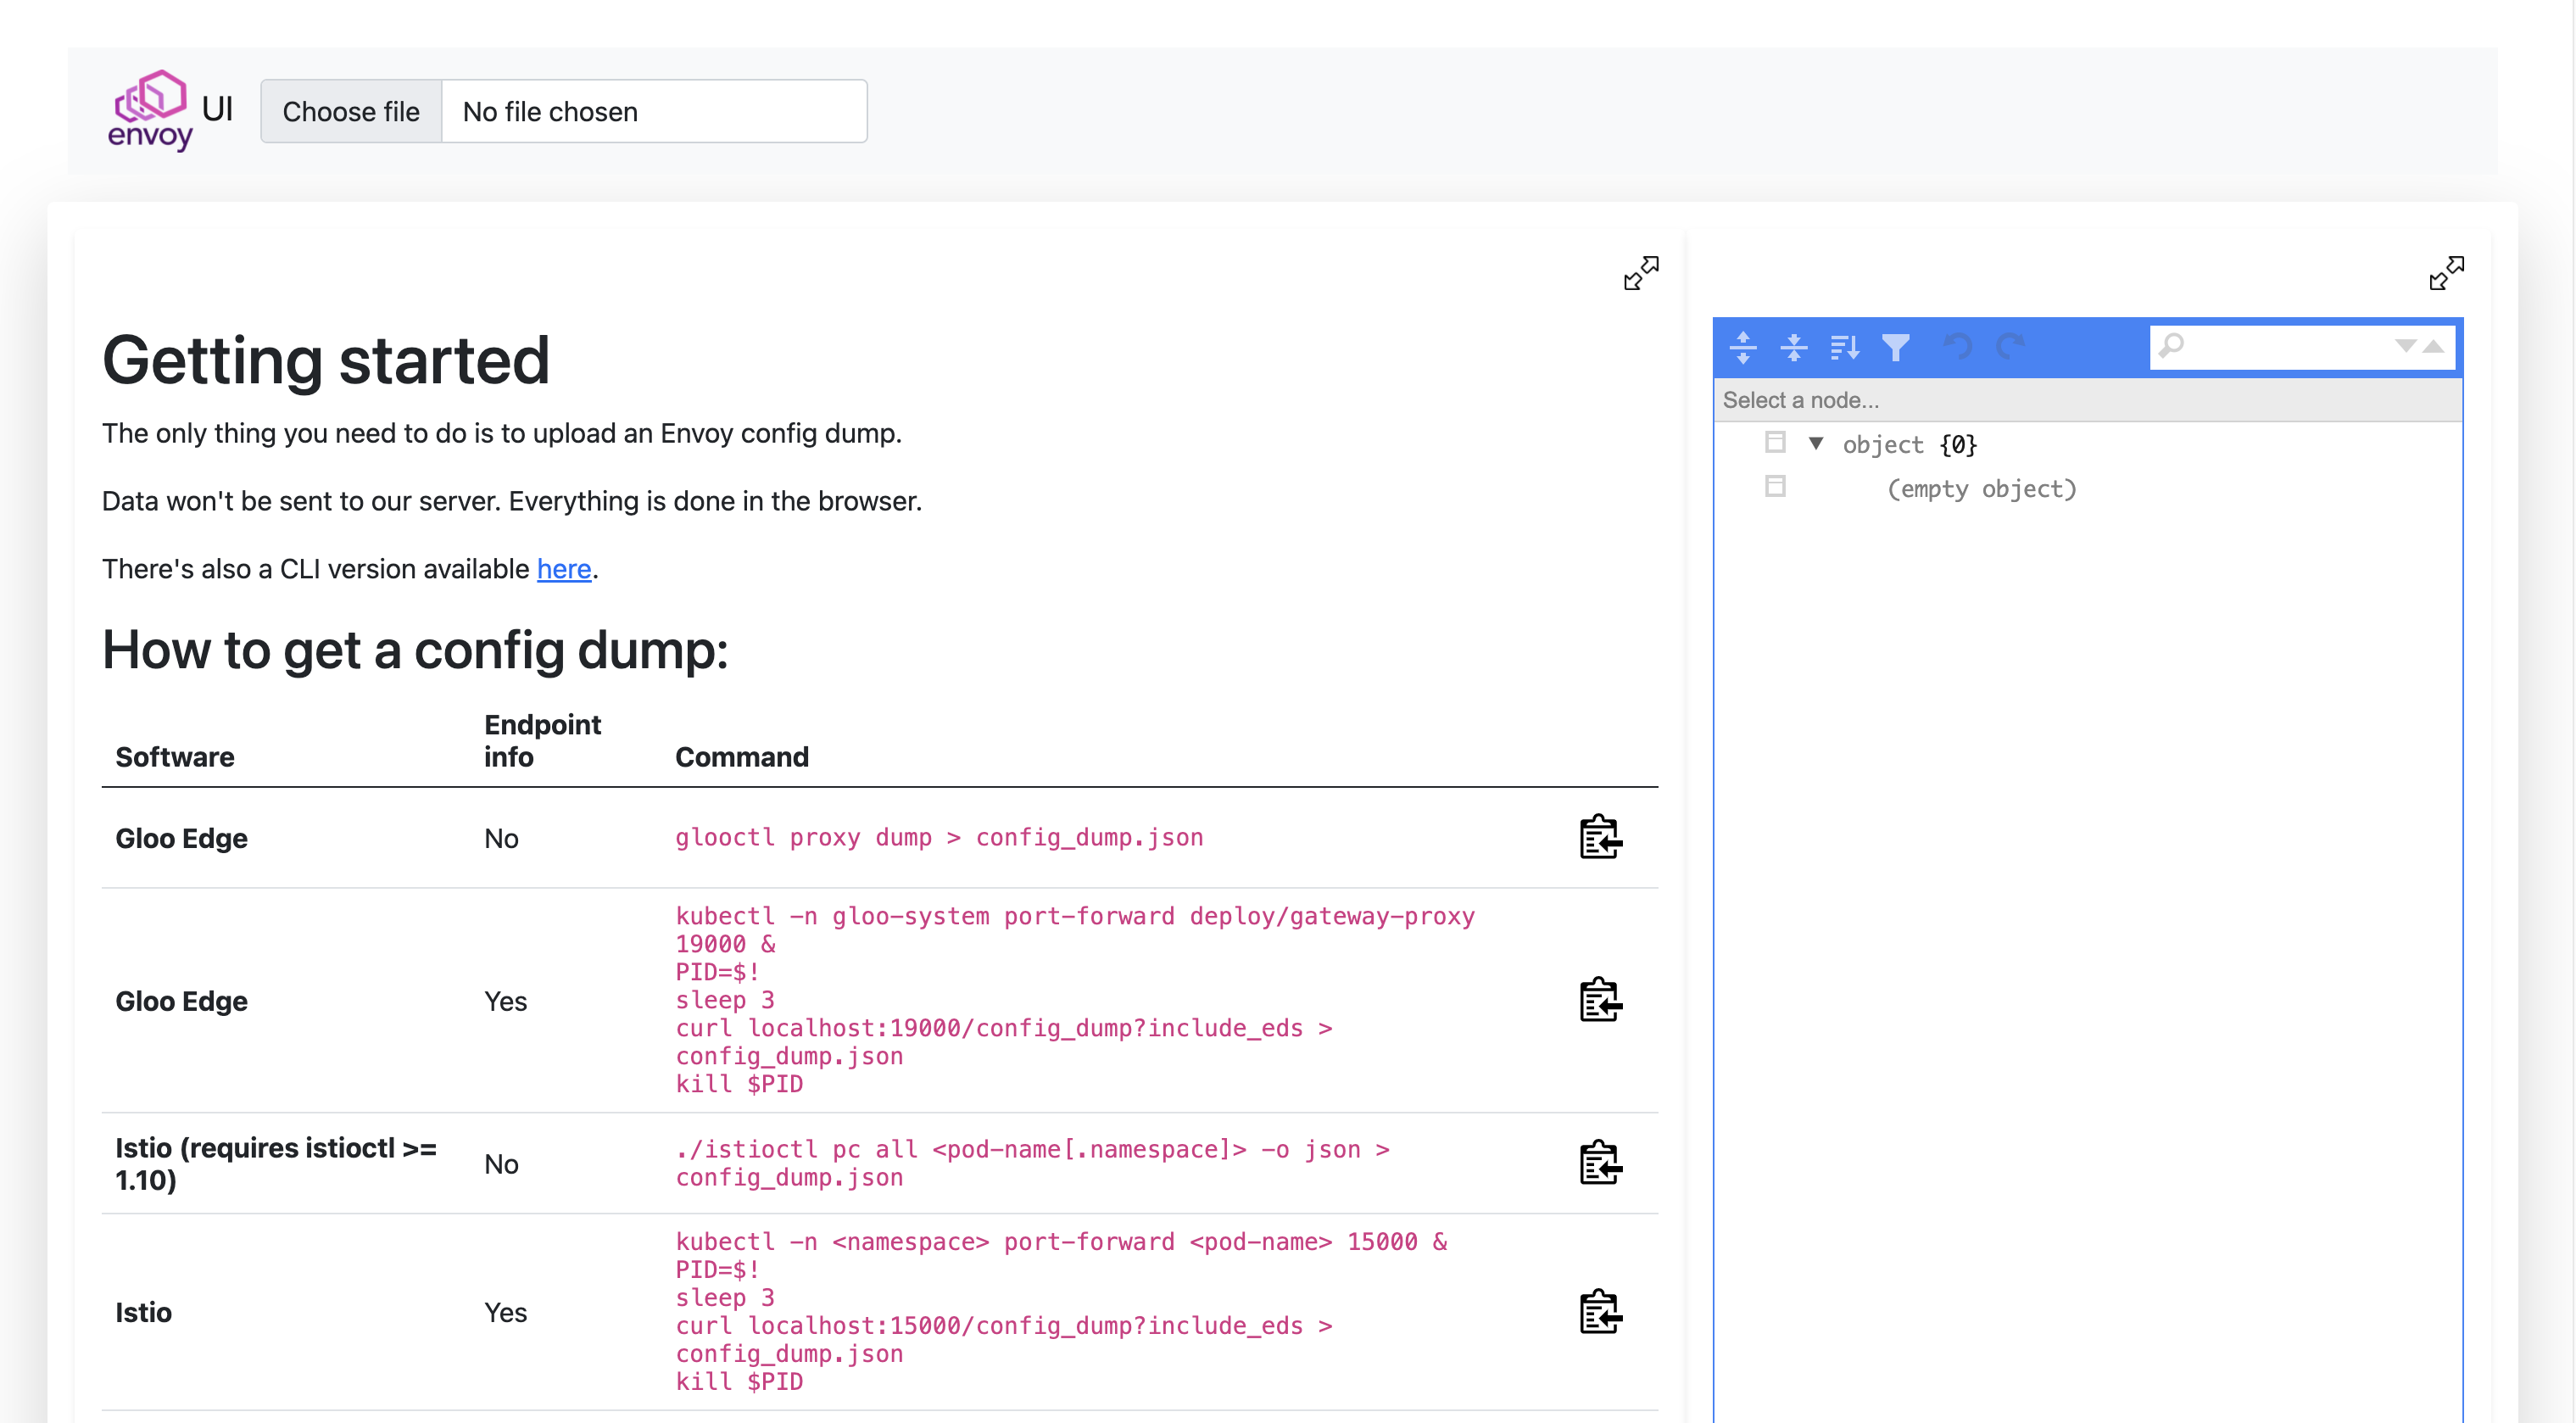
Finally, you can use the Solo.io Envoy UI to browse the config. You can safely upload your config-dump on the website (it will stay offline) and visit or search through the different configuration nodes: https://envoyui.solo.io/
Viewing Envoy logs
If things look okay (within your ability to tell), another good place to look is the Envoy proxy logs. You can very quickly turn on debug logging to Envoy as well as tail the logs with this handy glooctl command:
glooctl proxy logs -f
When you have the logging window up, send requests through to the proxy and you can get some very detailed debugging logging going through the log tail.
Keep in mind that this command will actually change the log level to debug. You might want to revert it to info after that, as shown in the following commands.
A more advanced way of changing the log level, globally or on a per-logger basis, is through the Envoy Admin endpoints:
# 1. port-forward to the gateway-proxy pod
kubectl -n gloo-system port-forward deploy/gateway-proxy 19000 &
# 2. globally change the log level to debug
curl -X POST "127.0.0.1:19000/logging?level=debug"
# 3. change the log level only for the aws logger
curl -X POST "127.0.0.1:19000/logging?aws=debug"
For a full list of the different Envoy loggers, visit the following endpoint: http://localhost:19000/logging
Additionally, you can configure access logging to dump specific parts of the request into the logs. For more information, see Access Logging.
Viewing Envoy stats
Envoy collects a wealth of statistics and makes them available for metric-collection systems like Prometheus, Statsd, and Datadog (to name a few). You can also very quickly get access to the stats from the cli:
glooctl proxy stats
# example with filtering on a particular upstream name:
glooctl proxy stats -n gloo-system --name internal-proxy | grep -i default-httpbin-8000
All else with Envoy: bootstrap and administration
There may be more limited times where you need direct access to the Envoy Admin API. You can view both the Envoy bootstrap config as well as access the Admin API with the following commands:
kubectl exec -it -n gloo-system deploy/gateway-proxy \
-- cat /etc/envoy/envoy.yaml
You can port-forward the Envoy Admin API similarly:
kubectl port-forward -n gloo-system deploy/gateway-proxy 19000:19000
Now you can curl localhost:19000 and get access to the Envoy Admin API.
Debugging the control plane
The Gloo Edge control plane is made up of the following components:
NAME                             READY   STATUS    RESTARTS   AGE
discovery-857796b8fb-gcphh       1/1     Running   0          15h
gateway-5d7dd58d5f-8z48k         1/1     Running   0          15h
gateway-proxy-8689c55fb8-7swfq   1/1     Running   0          15h
gloo-66fb8974c9-8sgll            1/1     Running   0          15h
You will see more components for the Enterprise installation
NAME                                                  READY   STATUS    RESTARTS   AGE
discovery-68dbd794-ssx7b                               1/1     Running   0          107m
extauth-67557744dd-5wc2p                               1/1     Running   0          107m
gateway-595cc67f54-tr6ps                               1/1     Running   0          107m
gateway-proxy-79c9f44b5d-cprg7                         1/1     Running   0          107m
gloo-74bb8b9df7-72t8m                                  1/1     Running   0          107m
gloo-fed-857964dd9f-gq8np                              1/1     Running   0          107m
gloo-fed-console-6f99dddccd-ls64k                      3/3     Running   0          107m
glooe-grafana-865bb9cd45-cdshq                         1/1     Running   0          107m
glooe-prometheus-kube-state-metrics-55ffc89cbb-kr8jx   1/1     Running   0          107m
glooe-prometheus-server-7d5b85764c-2nl2w               2/2     Running   0          107m
observability-5f8ffc8bdc-zggxb                         1/1     Running   0          107m
rate-limit-6d66688567-5tcx8                            1/1     Running   3          107m
redis-57fd559c5c-hcd6n                                 1/1     Running   0          107m
Each component logs the sync loops that it runs, such as syncing with various environment signals like the Kubernetes API, Consul, etc.
You can fetch the latest logs for all the components with the following command:
glooctl debug logs
# save the logs to a file
glooctl debug logs -f gloo.log
# only print errors
glooctl debug logs --errors-only
Likely you just want to see each individual components logs. You can use kubectl logs command for that. For example, to see the gloo components logs:
kubectl logs -f -n gloo-system -l gloo=gloo
To follow the logs of other Gloo Edge deployments, simply change the value of the gloo label as shown in the table below.
| Component | Command |
|---|---|
| Discovery | kubectl logs -f -n gloo-system -l gloo=discovery |
| External Auth (Enterprise) | kubectl logs -f -n gloo-system -l gloo=extauth |
| Gateway | kubectl logs -f -n gloo-system -l gloo=gateway |
| Gloo Control Plane | kubectl logs -f -n gloo-system -l gloo=gloo |
| Observability (Enterprise) | kubectl logs -f -n gloo-system -l gloo=observability |
| Rate Limiting (Enterprise) | kubectl logs -f -n gloo-system -l gloo=rate-limit |
Changing logging levels and more
Each Gloo Edge control plane component comes with an optional debug port that you can enable with the START_STATS_SERVER environment variable. To get access to the port, you can forward the port of the Kubernetes deployment such as with the following command:
kubectl port-forward -n gloo-system deploy/gloo 9091:9091
Now you can navigate to http://localhost:9091 and you get a simple page with some additional endpoints:
/debug/pprof/logging/metrics/zpages
With these endpoints, you can profile the behavior of the component, adjust its logging, view the prometheus-style telemetry signals, as well as view tracing spans within the process. This is a very handy page to understand the behavior of a particular component.
To change the log levels of individual Gloo Edge deployments from the CLI instead of the Admin UI, use commands similar to the following example with the discovery deployment.
kubectl port-forward -n gloo-system deploy/discovery 9091:9091
# Change log level to debug for discovery deployment
% curl -X PUT -H "Content-Type: application/json" -d '{"level": "debug"}' http://localhost:9091/logging
# Change log level to info for discovery deployment
% curl -X PUT -H "Content-Type: application/json" -d '{"level": "info"}' http://localhost:9091/logging
Declaratively setting the log levels
Setting the LOG_LEVEL environment variable within gloo, discovery, gateway or gateway proxy deployments will change the level at which the stats server logs. The default log level for the stats server is info.
Other acceptable log levels for Gloo Edge components are:
debugerrorwarnpanicfatal
With Helm installations, these can be set for you by providing the desired level as a value for the logLevel key for each of those components. You can also define the Envoy log level by setting the envoyLogLevel value on gateway proxies.
Example for Helm values:
gloo:
  gloo:
    logLevel: error
  discovery:
    logLevel: error
  gatewayProxies:
    gatewayProxy:
      envoyLogLevel: error
Additionally, you can change the logging level for other services in the following Helm values example:
global:
  extensions:
    extAuth:
      deployment:
        logLevel: error
    rateLimit:
      deployment:
        logLevel: error
    caching:
      deployment:
        logLevel: error
observability:
  deployment:
    logLevel: error

### All else fails

Again, if all else fails, you can capture the state of Gloo Edge configurations and logs and join us on our Slack (https://slack.solo.io) and one of our engineers will be able to help:

```bash
glooctl debug logs -f gloo-logs.log
glooctl debug yaml -f gloo-yamls.yaml
These commands dump all of the relevant configuration into gloo-logs.log and gloo-yamls.yaml files, which gives a complete picture of your Gloo Edge deployment.