Release notes
Review summaries of the main changes in the Gloo 2.6 release.
Introduction
The release notes include important installation changes and known issues. They also highlight ways that you can take advantage of new features or enhancements to improve your product usage.
For more information, see the following related resources:
- Upgrade guide: Steps to upgrade from the previous minor version to the current version.
- Version reference: Information about Solo’s version support.
Breaking changes
Review details about the following breaking changes.
Upstream Prometheus upgrade
Gloo Network includes a built-in Prometheus server to help monitor the health of your Gloo components. This release of Gloo upgrades the Prometheus community Helm chart from version 19.7.2 to 25.11.0. As part of this upgrade, upstream Prometheus changed the selector labels for the deployment, which requires recreating the deployment. To help with this process, the Gloo Helm chart includes a pre-upgrade hook that automatically recreates the Prometheus deployment during a Helm upgrade. This breaking change impacts upgrades from previous versions to version 2.4.10, 2.5.1, or 2.6.0 and later.
If you do not want the redeployment to happen automatically, you can disable this process by setting the prometheus.skipAutoMigration Helm value to true. For example, you might use Argo CD, which converts Helm pre-upgrade hooks to Argo PreSync hooks and causes issues. To ensure that the Prometheus server is deployed with the right version, follow these steps:
- Confirm that you have an existing deployment of Prometheus at the old Helm chart version of
chart: prometheus-19.7.2.kubectl get deploy -n gloo-mesh prometheus-server -o yaml | grep chart - Delete the Prometheus deployment. Note that while Prometheus is deleted, you cannot observe Gloo performance metrics.
kubectl delete deploy -n gloo-mesh prometheus-server - In your Helm values file, set the
prometheus.skipAutoMigrationfield totrue. - Continue with the Helm upgrade of Gloo Network. The upgrade recreates the Prometheus server deployment at the new version.
Installation changes
In addition to comparing differences across versions in the changelog, review the following installation changes from the previous minor version to version 2.6.
Safe mode enabled by default
Starting in version 2.6.0, safe mode is enabled on the Gloo management server by default to ensure that the server translates input snapshots only if all input snapshots are present in Redis or its local memory. This way, translation only occurs based on a complete translation context that includes all workload clusters.
Enabling safe mode resolves a race condition that was identified in version 2.5.3, 2.4.11, and earlier that could be triggered during simultaneous restarts of the management plane and Redis, including an upgrade to a newer Gloo Mesh Enterprise version. If hit, this failure mode could lead to partial translations on the Gloo management server which could result in Istio resources being temporarily deleted from the output snapshots that are sent to the Gloo agents.
To learn more about safe mode, see Safe mode.
New default values for Gloo UI auth sessions
Some of the default Helm values changed for configuring the Gloo UI auth session storage:
glooUi.auth.oidc.session.backend: The default value changed from""(empty) tocookieto ensure auth sessions are stored in browser cookies by default.glooUi.auth.oidc.session.redis.host: The default value changed from""(empty) togloo-mesh-redis.gloo-mesh:6379to ensure a valid Redis host is set whenglooUi.auth.oidc.session.backendis changed toredis.
To learn how to set up Gloo UI auth session storage, see Store UI sessions.
New features
Review the following new features that are introduced in version 2.6 and that you can enable in your environment.
I/O threads for Redis
A new Helm value redis.deployment.ioThreads was introduced to specify the number of I/O threads to use for the built-in Redis instance. Redis is mostly single threaded, however some operations, such as UNLINK or slow I/O accesses can be performed on side threads. Increasing the number of side threads can help improve and maximize the performance of Redis as these operations can run in parallel.
The default and minimum valid value for this setting is 1. If you plan to increase the number of I/O side threads, make sure that you also change the CPU requests and CPU limits for the Redis pod. Set the CPU requests and limits to the same number that you use for the I/O side threads plus 1. That way, you can ensure that each side thread has an available CPU core, and that an additional CPU core is left for the main Redis thread. For example, if you want to set I/O threads to 2, make sure to add 3 CPU cores to the resource requests and limits for the Redis pod. You can find further recommendations regarding I/O threads in this Redis configuration example.
If you set I/O threads, the Redis pod must be restarted during the upgrade so that the changes can be applied. During the restart, the input snapshots from all connected Gloo agents are removed from the Redis cache. If you also update settings in the Gloo management server that require the management server pod to restart, the management server’s local memory is cleared and all Gloo agents are disconnected. Although the Gloo agents attempt to reconnect to send their input snapshots and re-populate the Redis cache, some agents might take longer to connect or fail to connect at all. To ensure that the Gloo management server halts translation until the input snapshots of all workload cluster agents are present in Redis, it is recommended to enable safe mode on the management server alongside updating the I/O threads for the Redis pod. For more information, see Safe mode. Note that in version 2.6.0 and later, safe mode is enabled by default.
To update I/O side threads in Redis as part of your Gloo Mesh Enterprise upgrade:
Scale down the number of Gloo management server pods to 0.
kubectl scale deployment gloo-mesh-mgmt-server --replicas=0 -n gloo-meshUpgrade Gloo Mesh Enterprise and use the following settings in your Helm values file for the management server. Make sure to also increase the number of CPU cores to one core per thread, and add an additional CPU core for the main Redis thread. The following example also enables safe mode on the Gloo management server to ensure translation is done with the complete context of all workload clusters.
glooMgmtServer:
  safeMode: true
redis:
  deployment:
    ioThreads: 2
    resources:
      requests:
        cpu: 3
      limits:
        cpu: 3
Feature changes
Review the following changes that might impact how you use certain features in your Gloo environment.
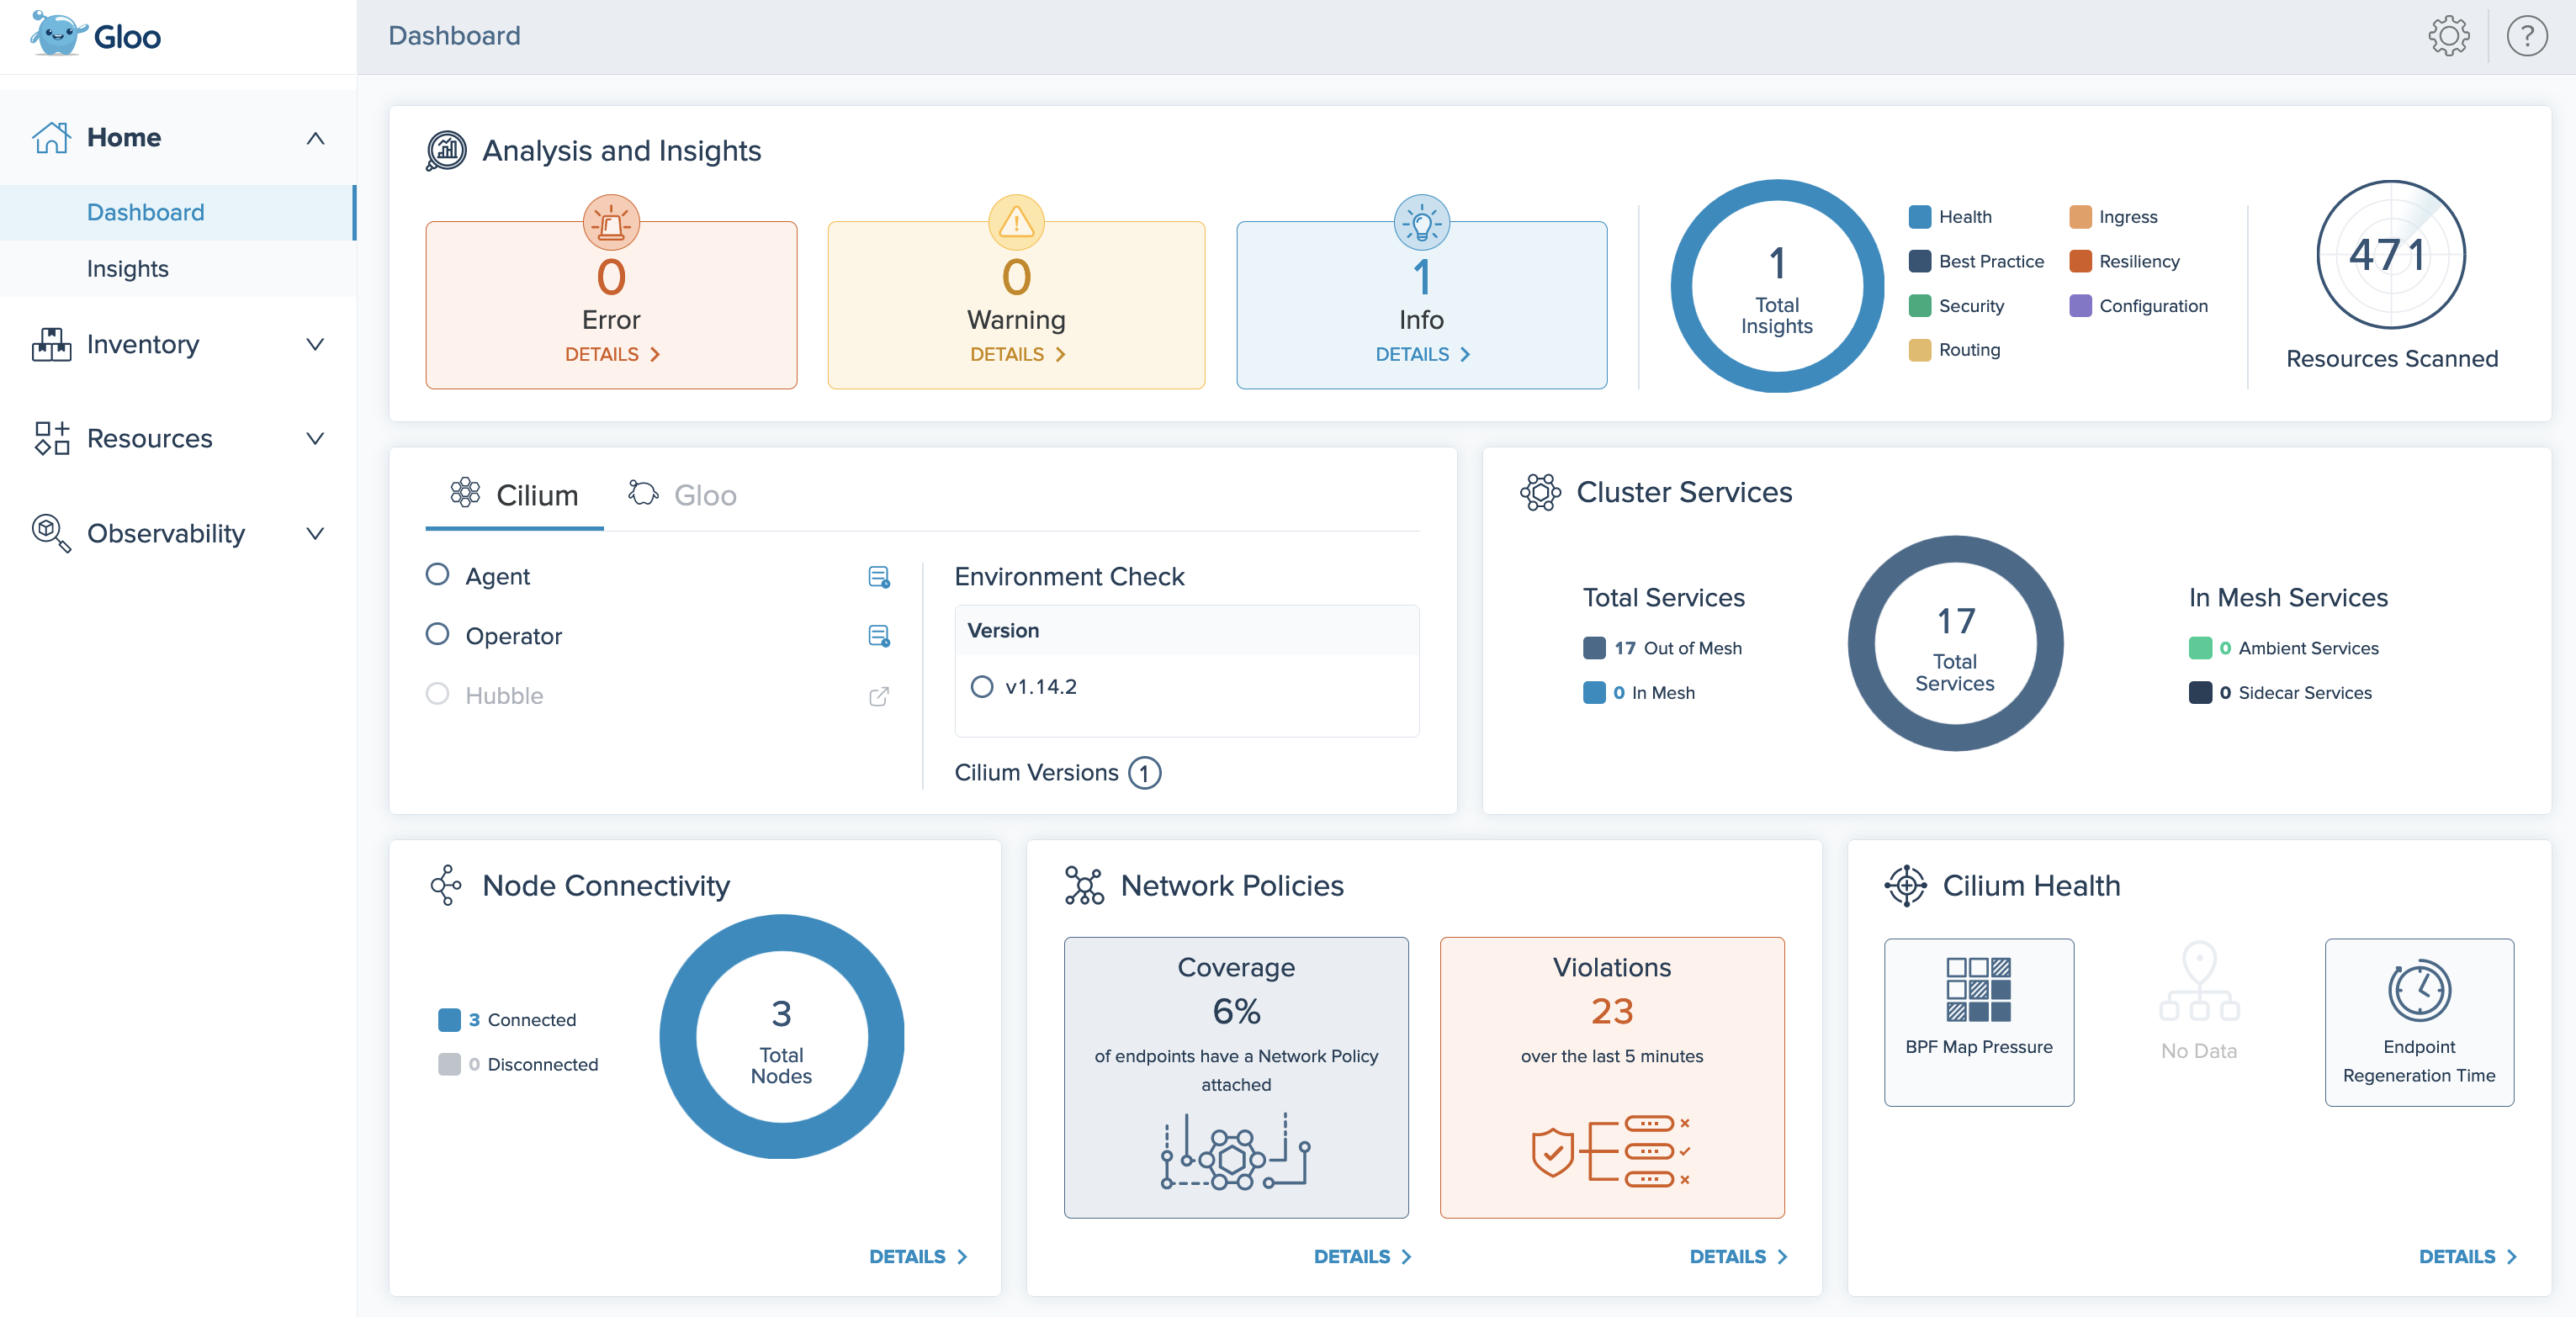
Improved Gloo UI
When you install Gloo Network for Cilium, the Dashboard is now expanded to include several cards that help you quickly monitor the health of your Cilium setup. Additionally, a new list of the nodes in your Gloo Network environment is added in the Inventory > Nodes page.
For more information, see the Gloo UI overview.
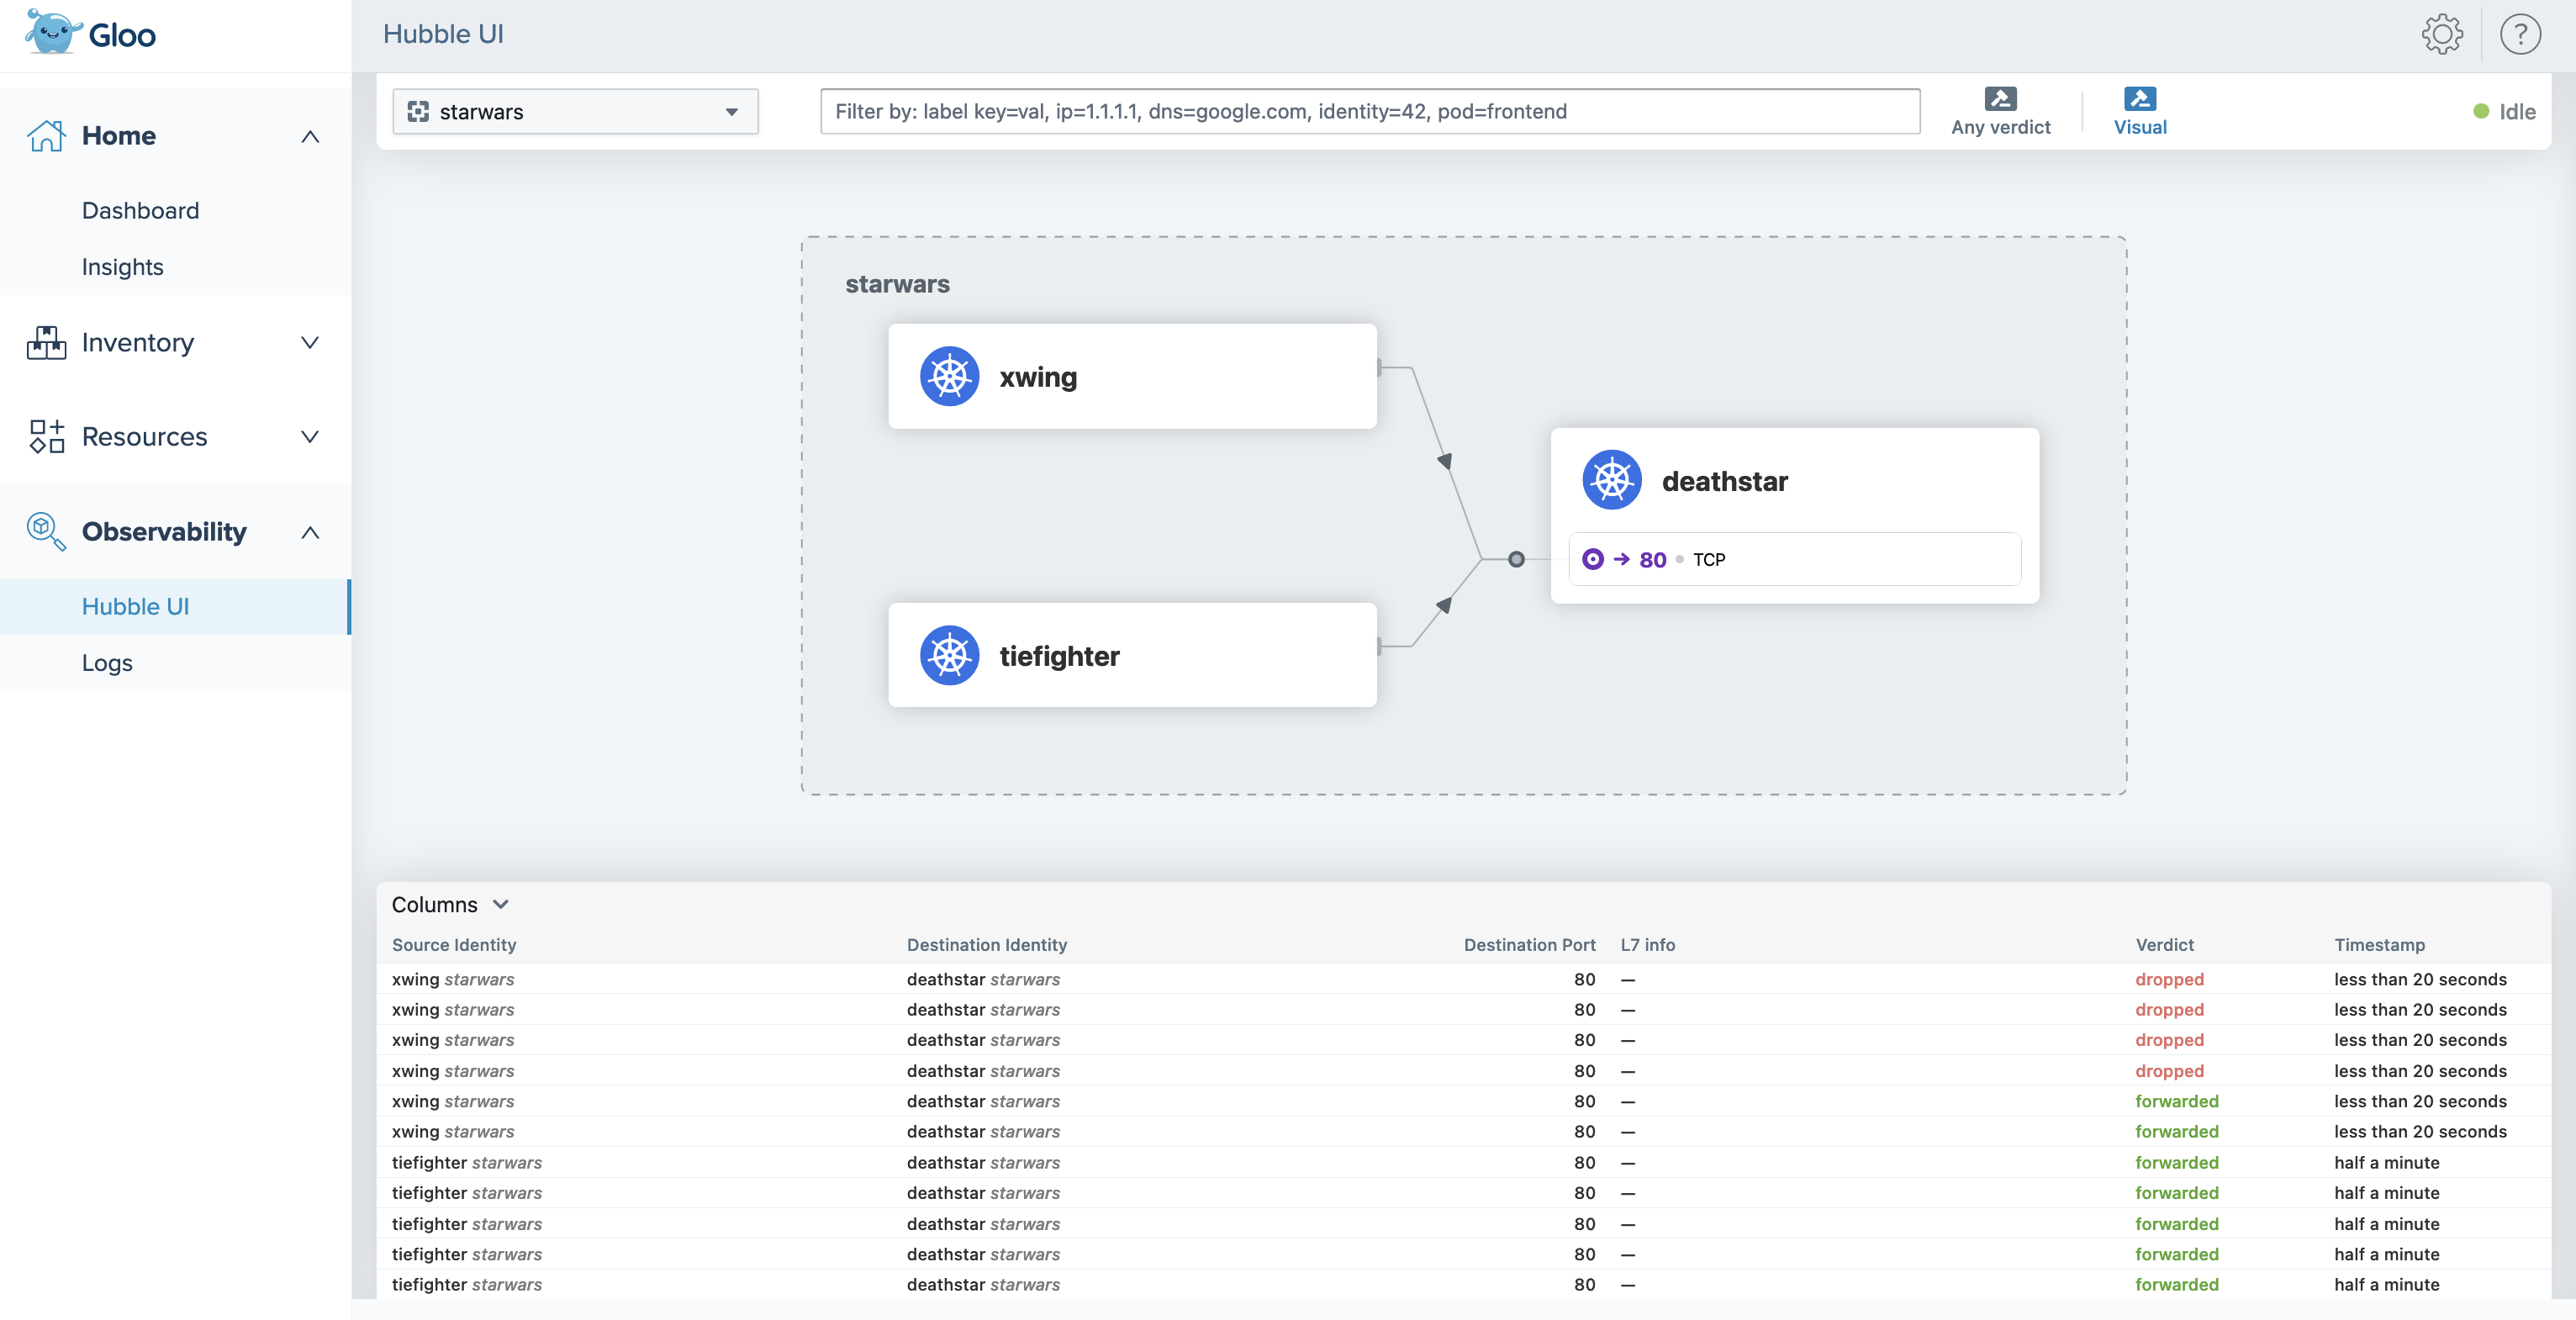
Hubble UI in the Gloo UI
When you install Gloo Network for Cilium, you can now visualize the Cilium flow logs and requests between endpoints in your network by using the Hubble UI. To access the Hubble UI through the Gloo UI, you must include the following settings when you install or upgrade Gloo Network.
  featureGates:
  hubbleUI: true
telemetryCollectorCustomization:
  pipelines:
    logs/cilium_flows:
      enabled: true
   metrics/cilium:
     enabled: true
For more information, see the Hubble UI guide.
Improved error logging
The Gloo management server translates your Gloo custom resources into many underlying Istio resources. When the management server cannot translate a resource, it returns debug logs that vary in severity from errors to warnings or info.
In this release, the management server logs are improved in the following ways:
- All translation errors are now logged at the debug level. This way, the management server logs are not cluttered by errors that do not impact the management server’s health.
- Fixed a bug that caused many duplicate error logs. Now, you have fewer logs to sift through.
For example, you might have a service that does not select any existing workloads. This scenario might be intentional, such as if you use a CI/CD tool like ArgoCD to deploy your environment in phases. Translation does not complete until you update the service’s selector or create the workload. Previously, the translation error would show up many times in the management server logs, even though the situation is intentional and the management server is healthy and can translate other objects. Now, the translation error is logged less verbosely at the debug level.
You can still review translation errors in the following ways:
- Translation errors and warnings are shown in the statuses of Gloo custom resources. For example, if a policy fails to apply to a route, you can review the warning in the policy and the route table statuses.
- In the management server, enable debug logging by enabling the
--verbose=truesetting. Example command:kubectl patch deploy -n gloo-mesh gloo-mesh-mgmt-server --type "json" -p '[{"op":"add","path":"/spec/template/spec/containers/0/args/-","value":"--verbose=true"}]'
Known issues
The Solo team fixes bugs, delivers new features, and makes changes on a regular basis as described in the changelog. Some issues, however, might impact many users for common use cases. These known issues are as follows:
- Cluster names: Do not use underscores (
_) in the names of your clusters or in thekubeconfigcontext for your clusters. - OTel pipeline: FIPS-compliant builds are not currently supported for the OTel collector agent image.