Explore the UI
After connecting to the Gloo UI, explore the basic layout. Review your Gloo Network and Cilium components, insights, your security posture, and more.
The UI offers a view-only experience. Users cannot modify resources.
Launch
The Gloo UI is served from the gloo-mesh-ui service on port 8090. When you have access to the management cluster, you can launch the Gloo UI from your local machine. You can connect by using the meshctl or kubectl CLIs.
Open the Gloo UI. The Gloo UI is served from the
gloo-mesh-uiservice on port 8090. You can connect by using themeshctlorkubectlCLIs.- Optional: If authentication is enabled, sign in.
- Review the dashboard.
Home
View the health and performance of your Gloo components and Cilium setup, and view recommendations to harden your setup by using the Dashboard and Insights pages.
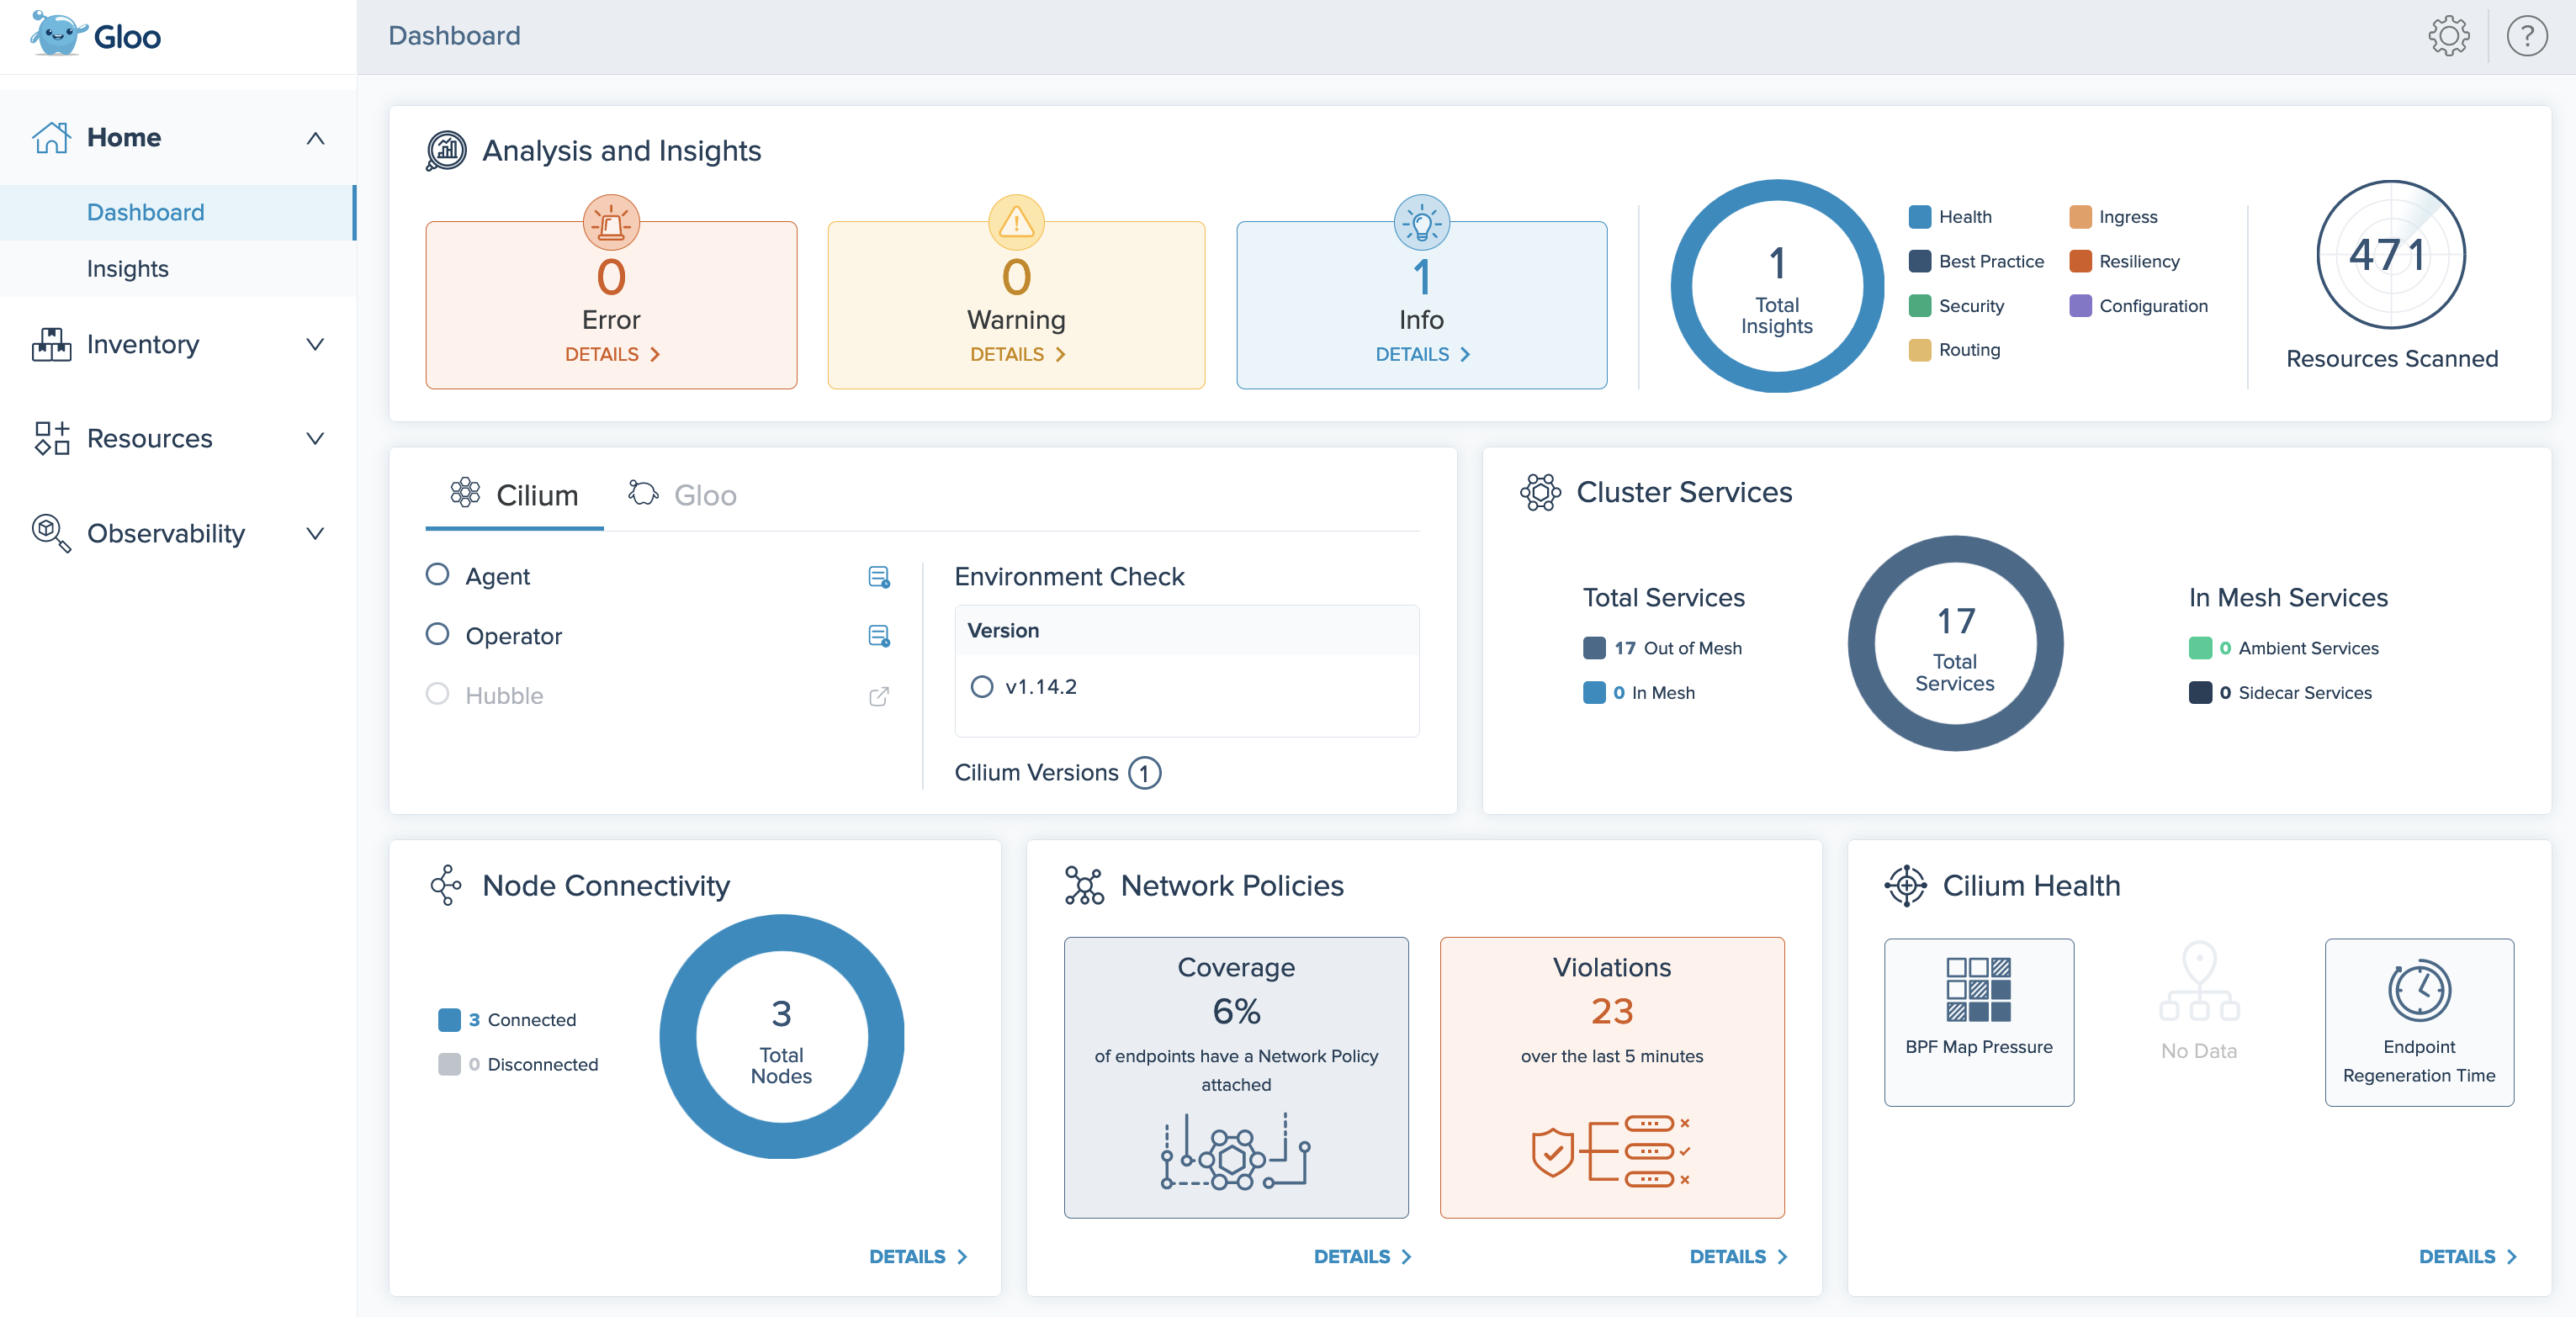
Dashboard
The Gloo UI dashboard provides an at-a-glance overview of the health of your Gloo components, your Cilium setup, and different tiles to quickly determine the security posture, compliance, inventories, and health of your Gloo Network environment.
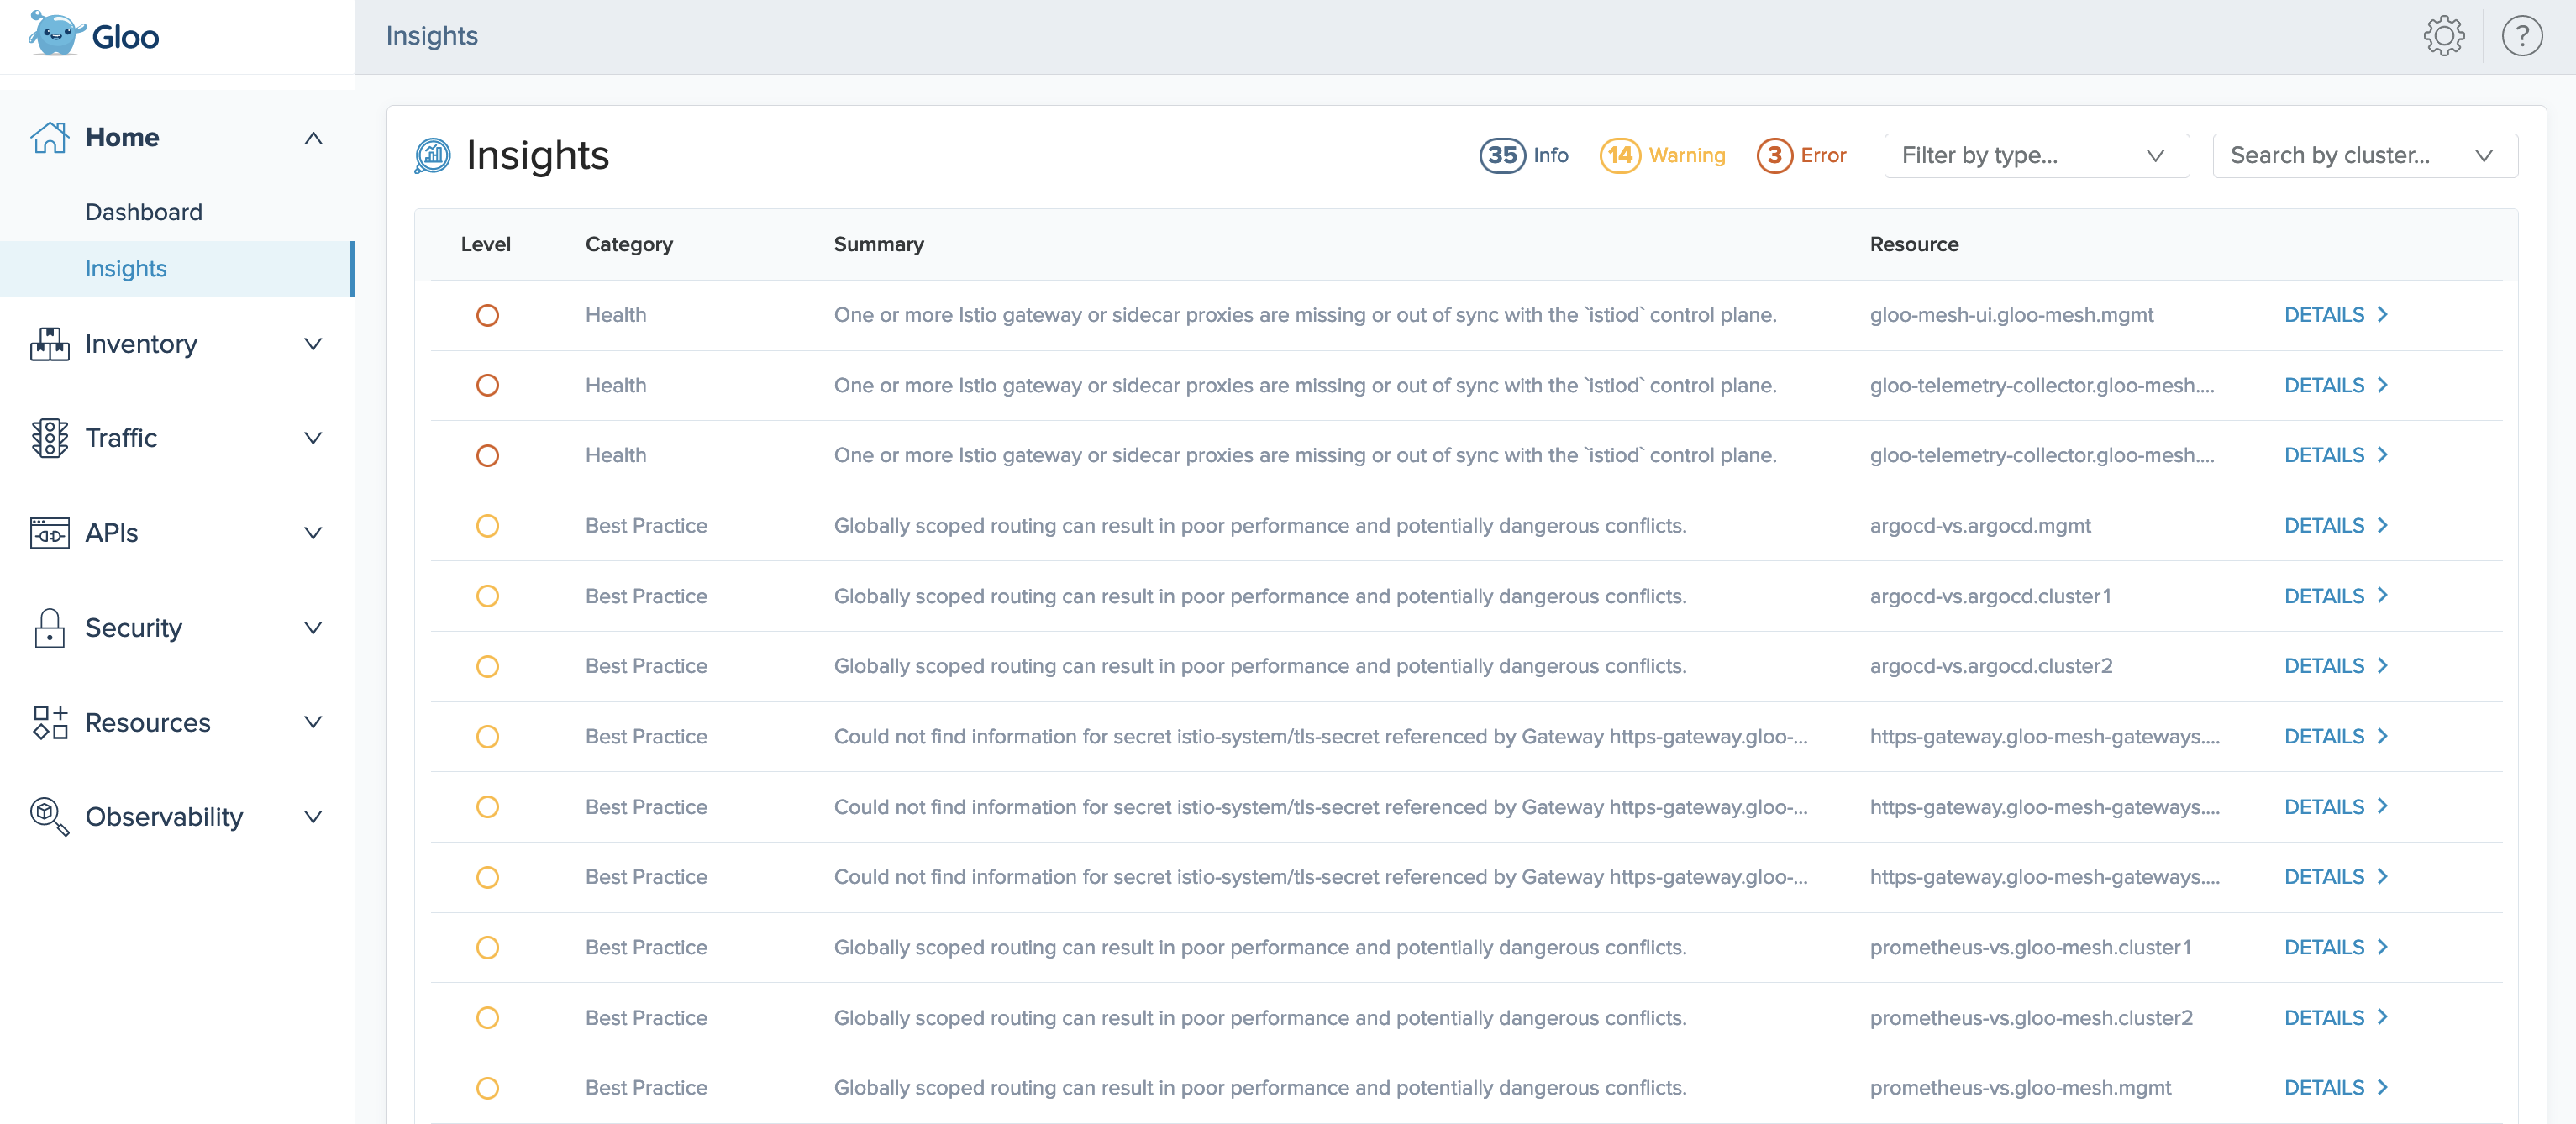
Insights
Gloo Network comes with an insights engine that automatically analyzes your Cilium setup for health issues. Then, Gloo shares these issues along with recommendations to harden your Cilium setup. The insights give you a checklist to address issues that might otherwise be hard to detect across your environment. For an overview of available insights, see Insights.
Inventory
The Inventory section provides an at-a-glance look at the health of registered clusters and discovered services that make up your Gloo environment.
Clusters
On the Clusters page, review basic details of each cluster that you registered with the Gloo management plane.
To filter clusters by the cluster’s Gloo Network installation health, click the Healthy and Unhealthy buttons. You can also use the Sort by Name dropdown or the search bar to filter clusters by name.
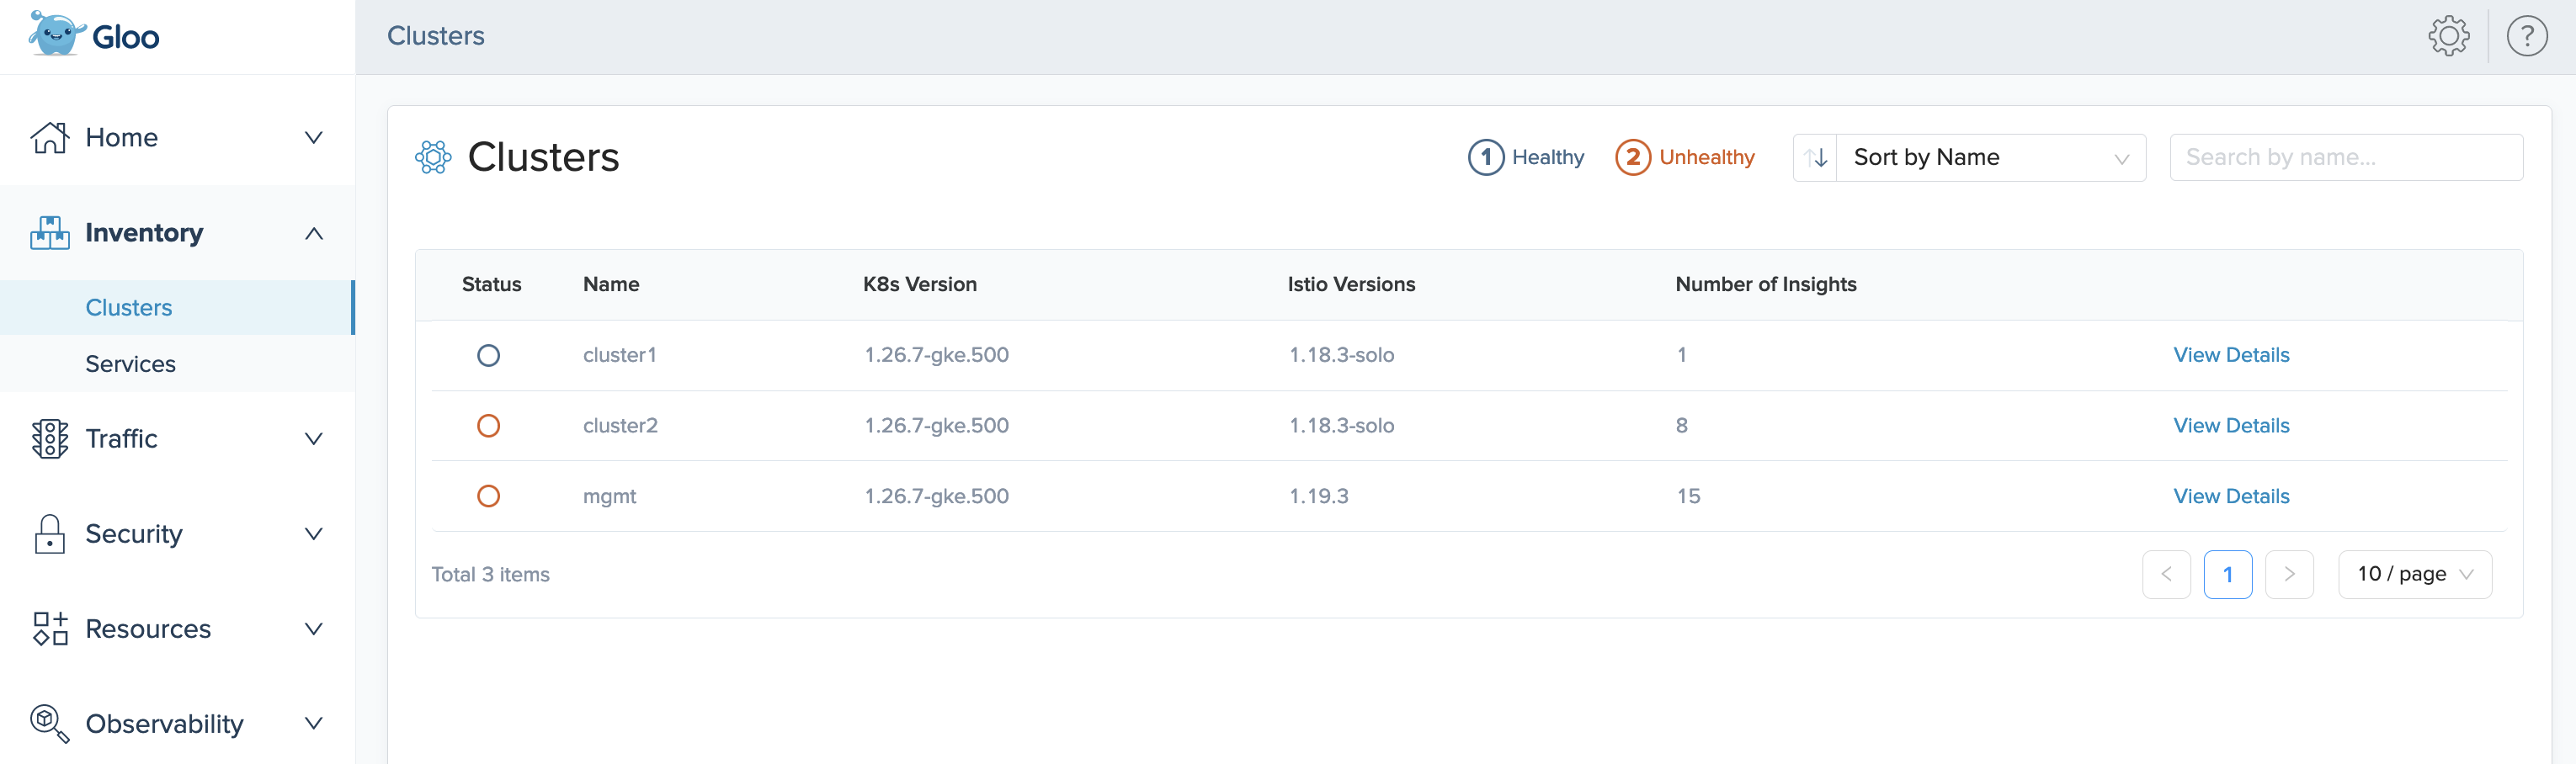
Figure: Clusters page Click More Details to see a more detailed dashboard for the cluster. This dashboard can help you find errors in your Gloo, Istio, and Cilium setups.
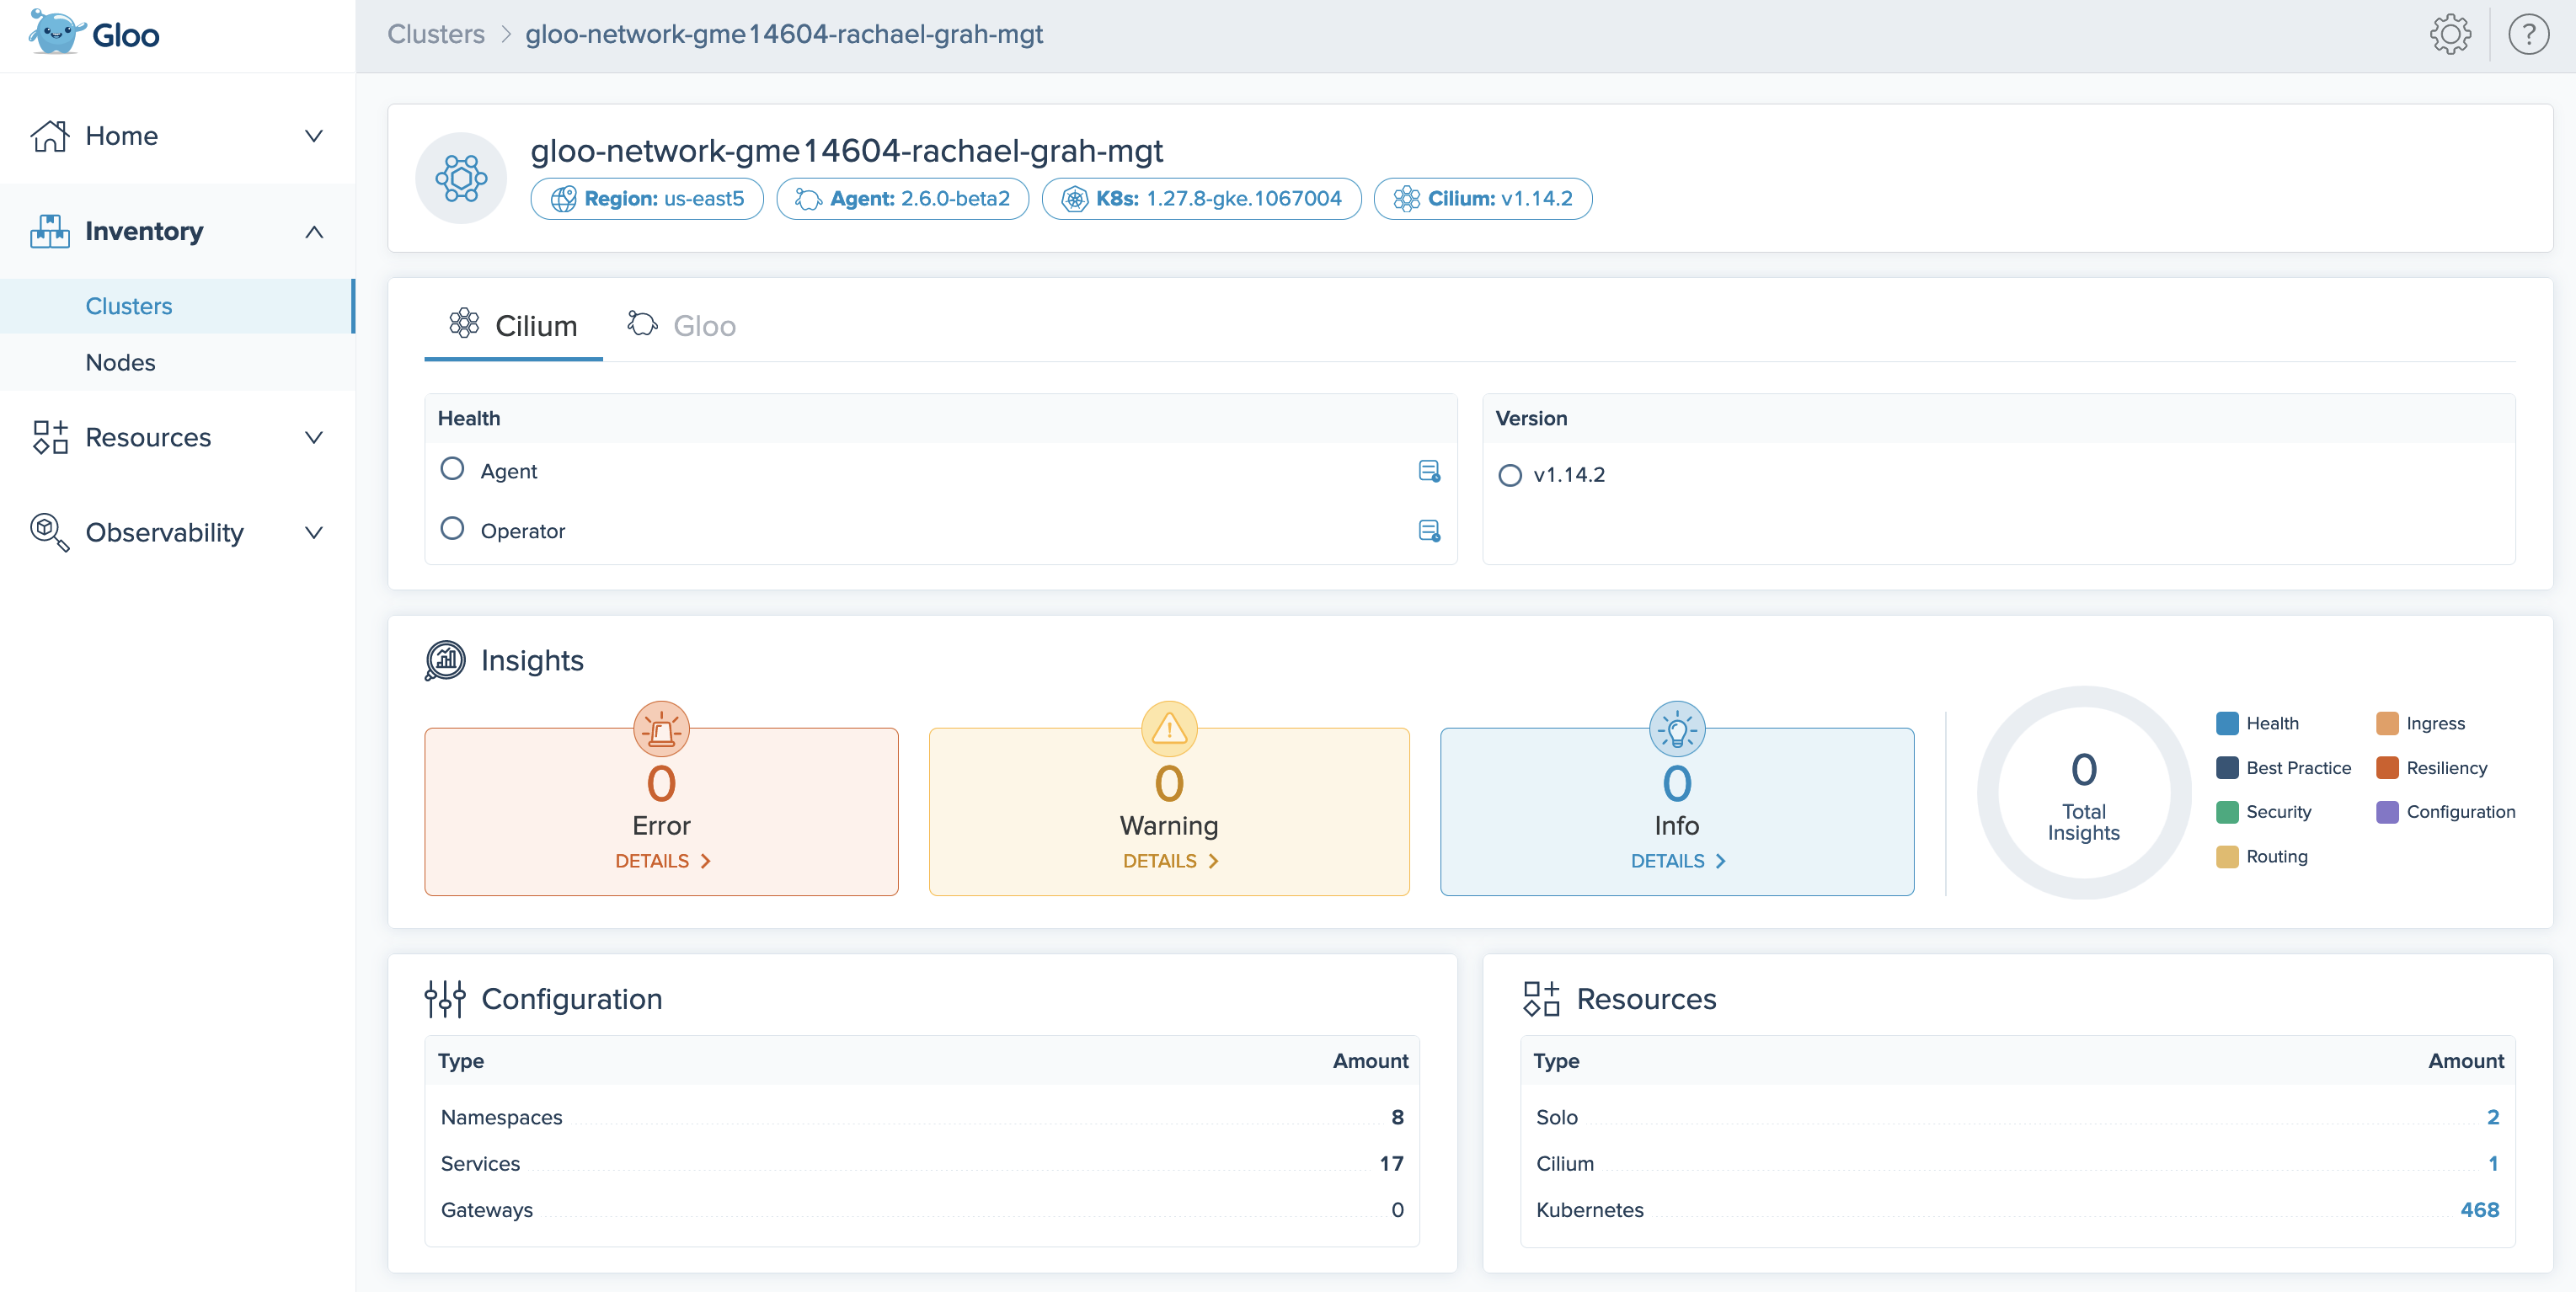
Figure: Cluster details page
Nodes
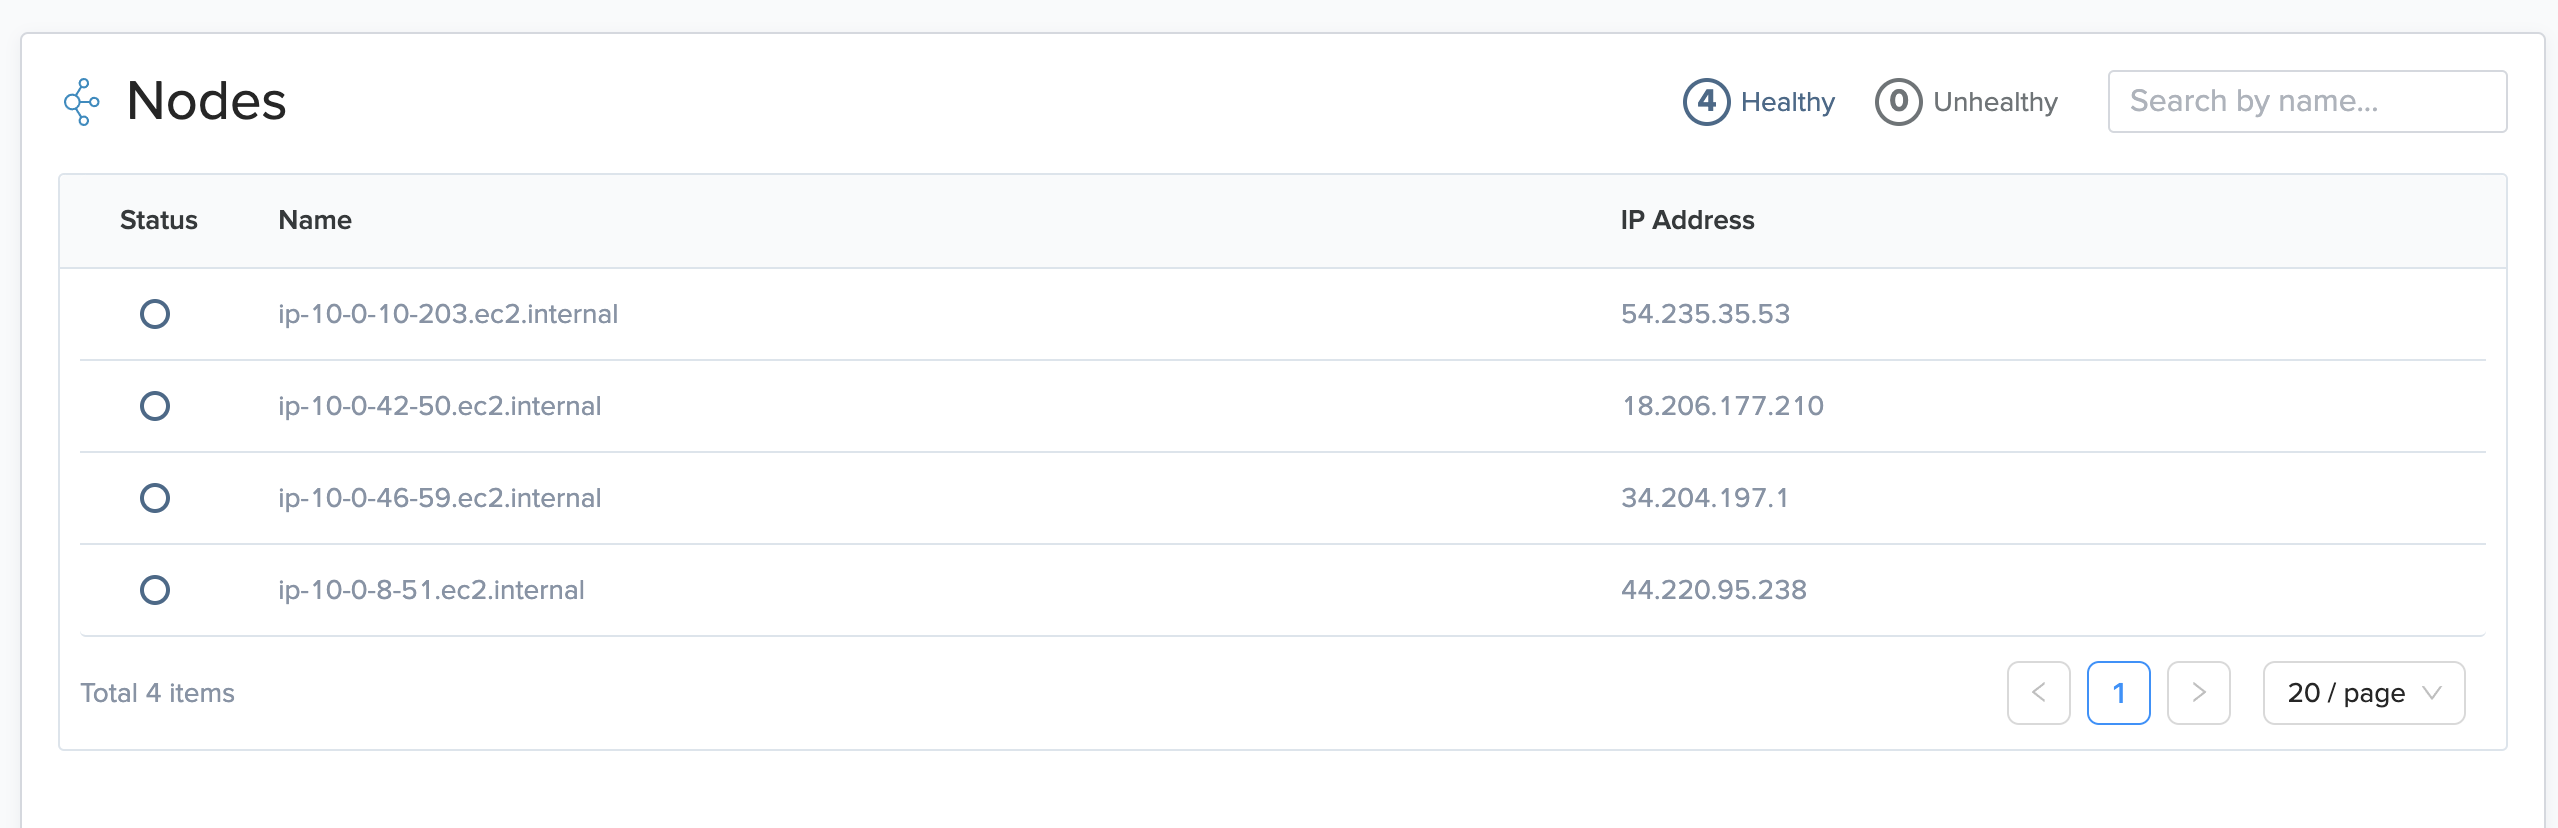
On the Nodes page, you can review the number of nodes that Cilium reports as connected or disconnected across all clusters in your Gloo Network setup.
Cilium tracks each node’s ability to connect to other nodes by performing connectivity checks between the Cilium agent on the node and other Cilium nodes. When a node is reported as disconnected, it implies one or more other nodes are unable to establish connectivity to it. You can use the Healthy and Unhealthy buttons to sort the nodes, such as to find disconnected nodes.
Security
Security insights
The Dashboard and Security Insights pages of the Gloo UI can help you review the overall security posture of your Istio setup, including insights and recommendations regarding your certificates, encrypted traffic, FIPS compliance, and more.
For more information, see Review your security posture.
Resources
Find an overview of resources that are deployed in your cluster and use the filter options in the Gloo UI to find the resource that you need.
Solo
View the Gloo resources in your Gloo Network environment, such as Dashboard resources. Use the Filter by options to filter the list by resource type. To view the YAML configuration for a resource, click View YAML.
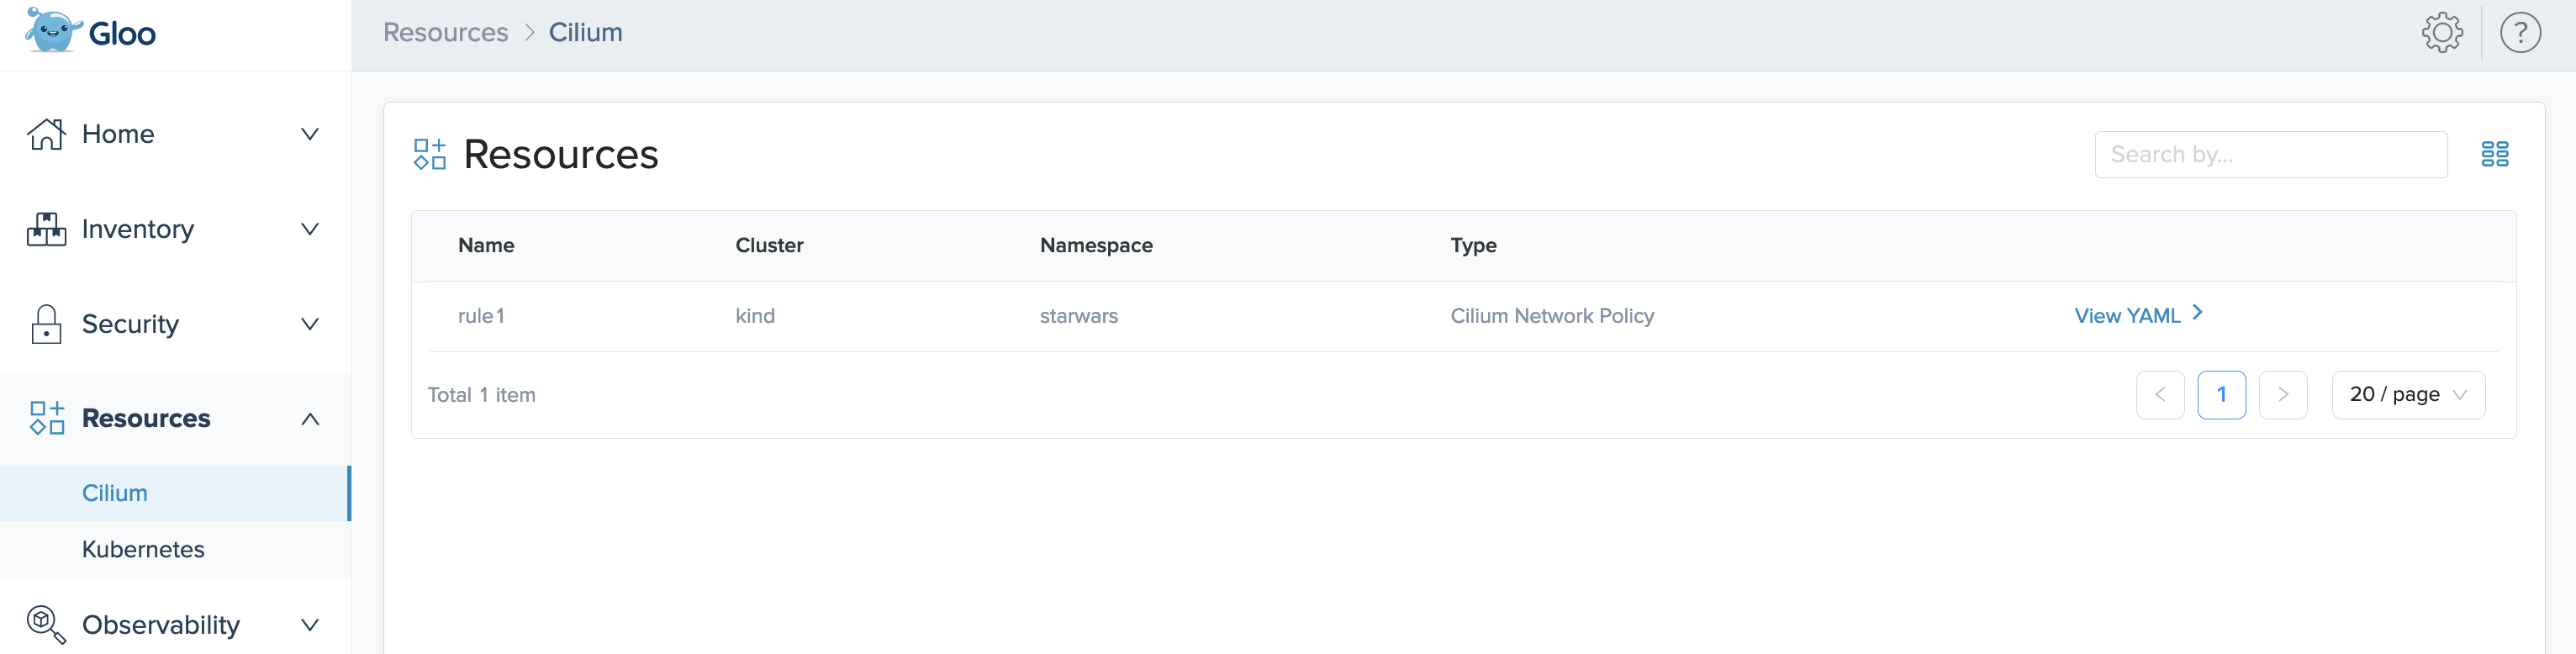
Cilium
View the Cilium network policies that you applied to your workloads. In the following example, the rule1 Cilium policy that you can create in the quickstart guide is listed.
Gateway API
View all Kubernetes Gateway API resources in your environment. For more information, see the Kubernetes Gateway API guide in the Istio documentation.
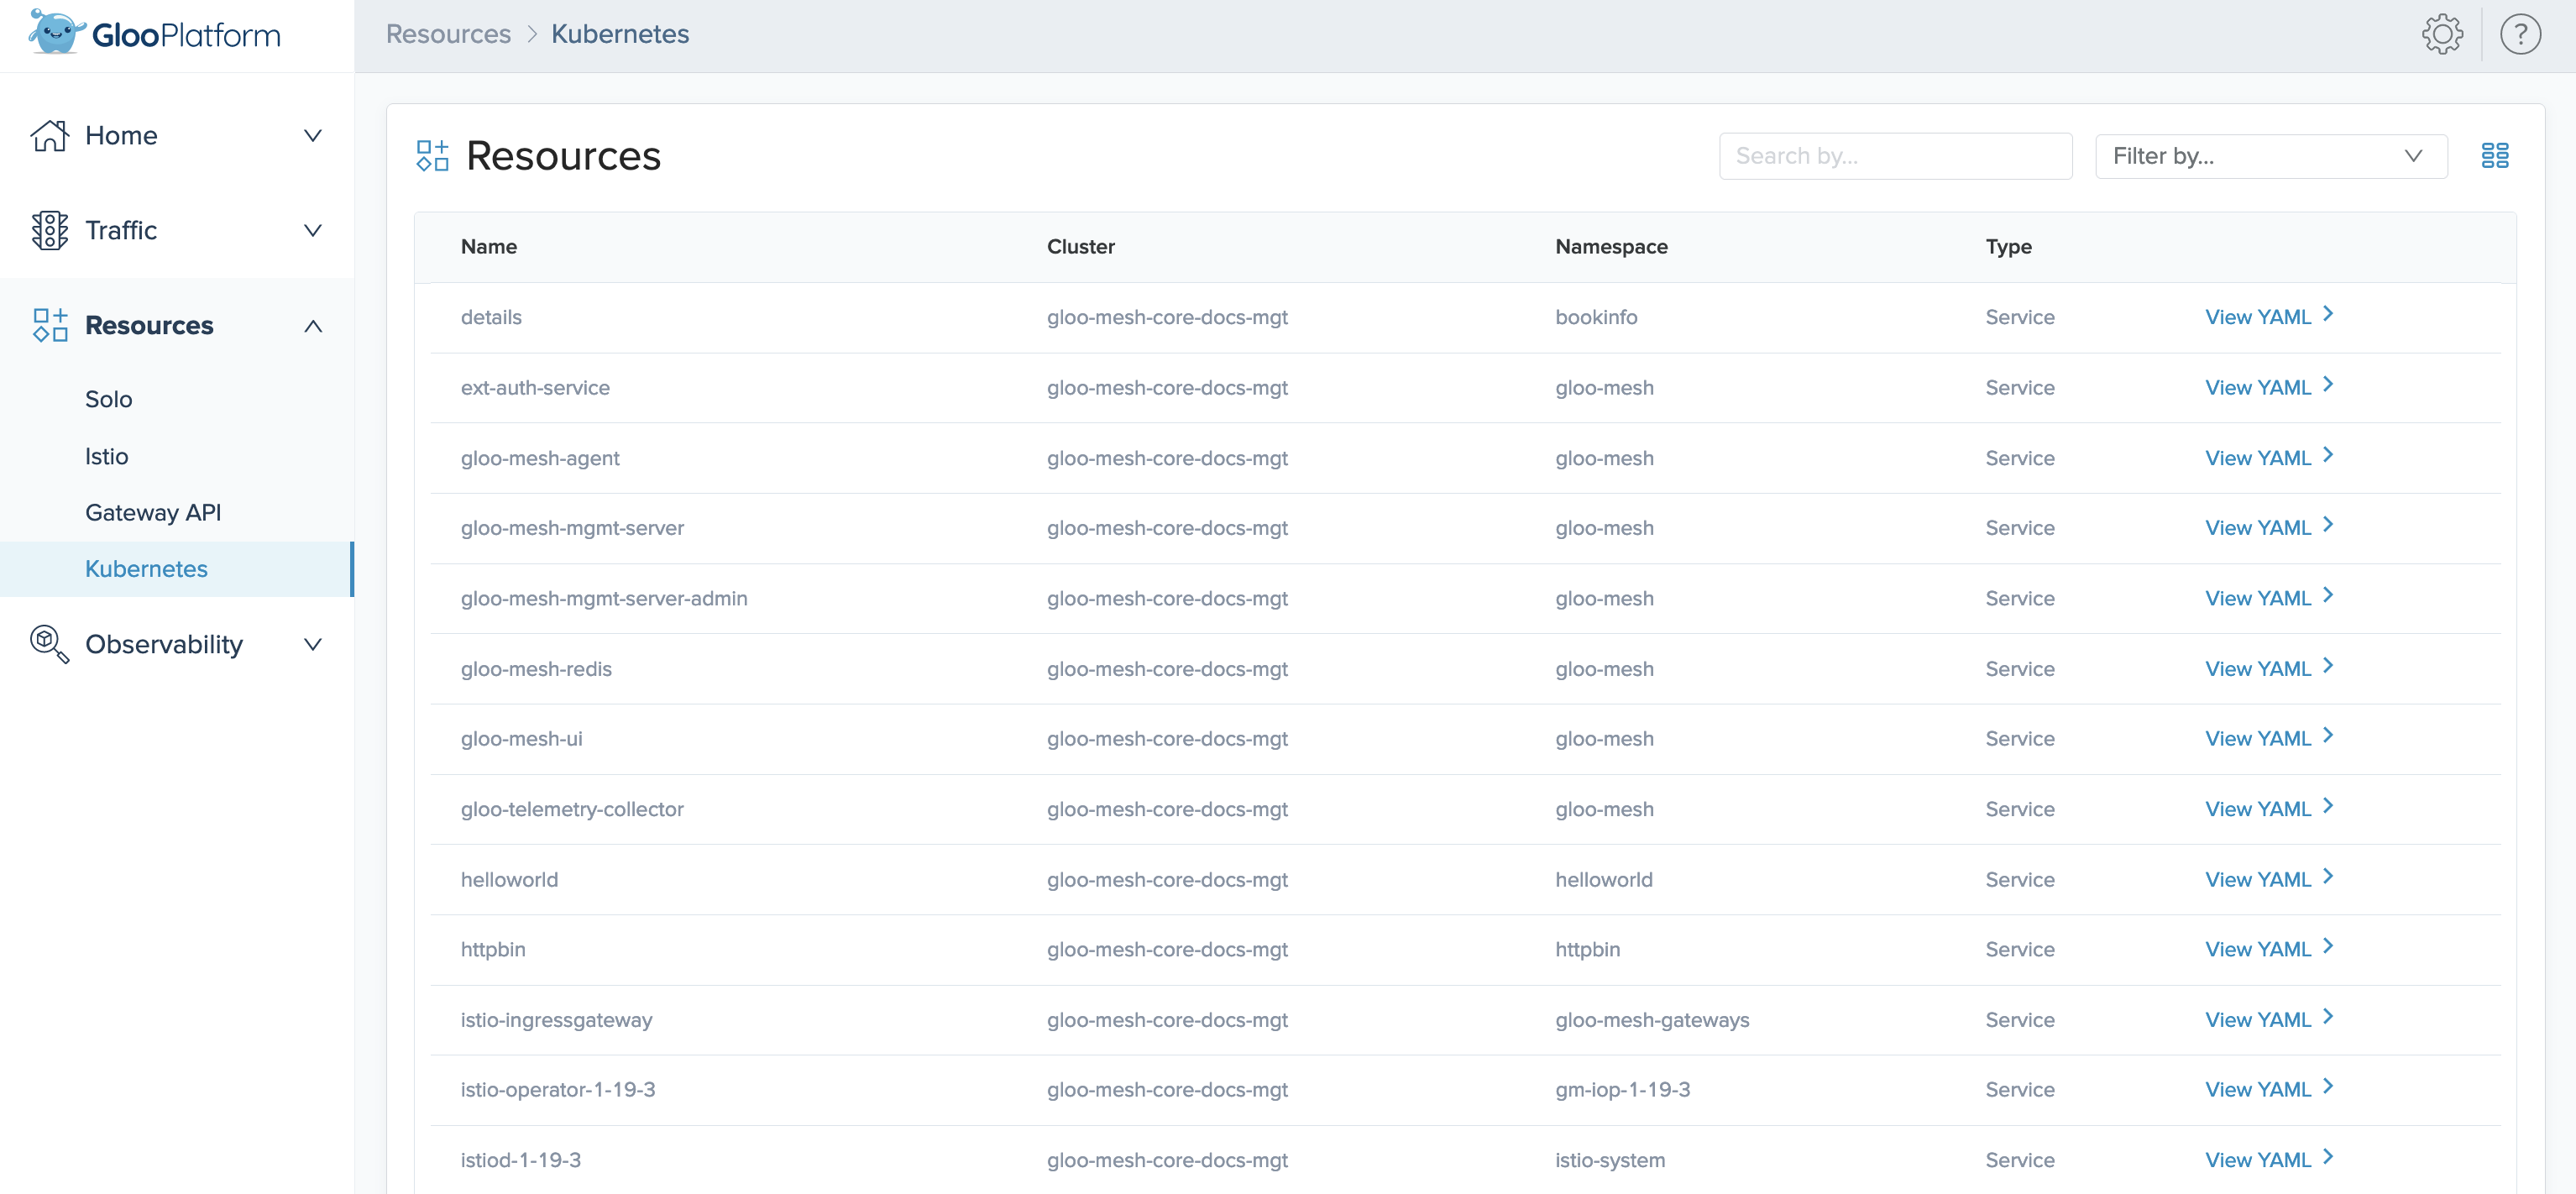
Kubernetes
View all Kubernetes resources in your cluster, such as services, service accounts, secrets, or cluster roles. Use the Filter options to filter the list by namespace and Kubernetes resource type. To view the YAML configuration for a resource, click View YAML.
Observability
The Gloo UI consumes telemetry data from Prometheus and Jaeger and visualizes this data in the Observability section.
Hubble UI
On the Hubble UI page, you can visualize the Cilium flow logs between endpoints in your network.
Enable Hubble in the Gloo UI
To access the Hubble UI through the Gloo UI, you must include the following settings when you install Gloo Network. If you installed Gloo Network by using the quickstart or advanced installation guide, the following settings are already enabled.
  featureGates:
  hubbleUI: true
telemetryCollectorCustomization:
  pipelines:
    logs/cilium_flows:
      enabled: true
   metrics/cilium:
     enabled: true
Using the Hubble UI
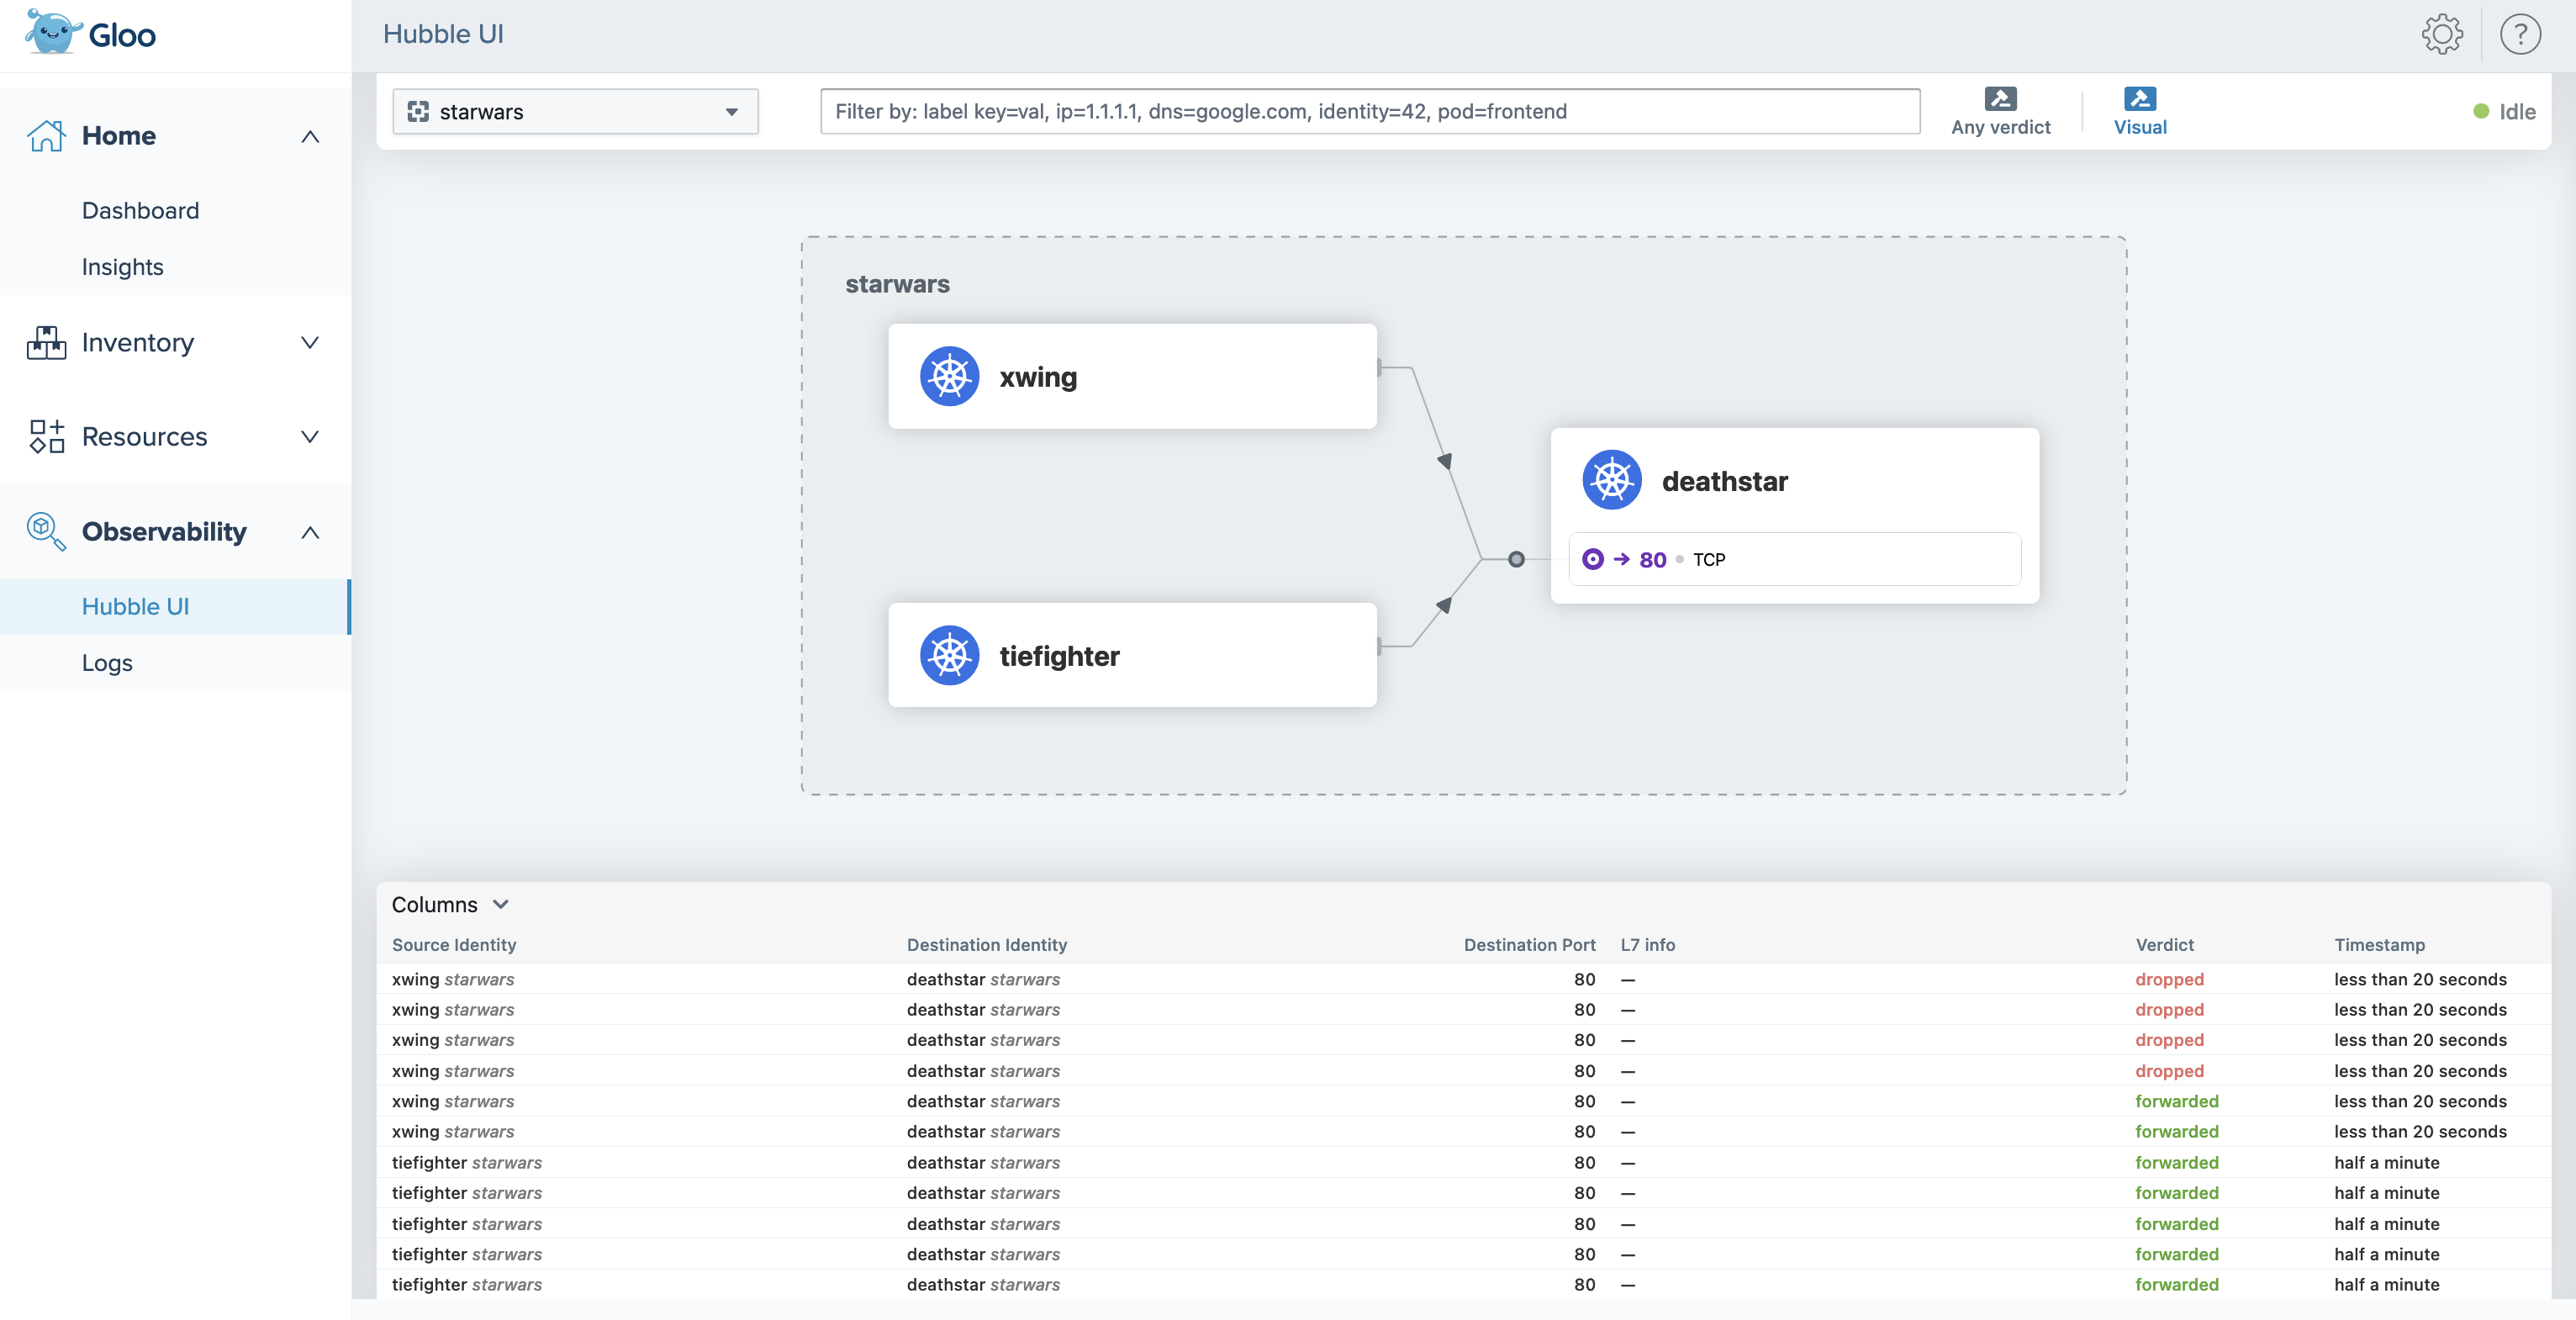
The Hubble UI can help you determine whether requests are being correctly allowed or denied, depending on the Cilium network policies that you apply.
Choose a namespace from the dropdown menu to see the services that are communicating in your Cilium network setup. Note that the graph might take a few minutes to populate based on the communication between your apps.
Below the graph you can see the details of each request, such as the source and destination, whether the connection was allowed or denied, and the timestamp. Note that you can filter requests by searching for specific labels, or by using the Any verdict selector. In the following example, requests with any verdict are displayed, including both dropped and forwarded requests.
For more information on how to customize the Hubble UI, see the Cilium docs.
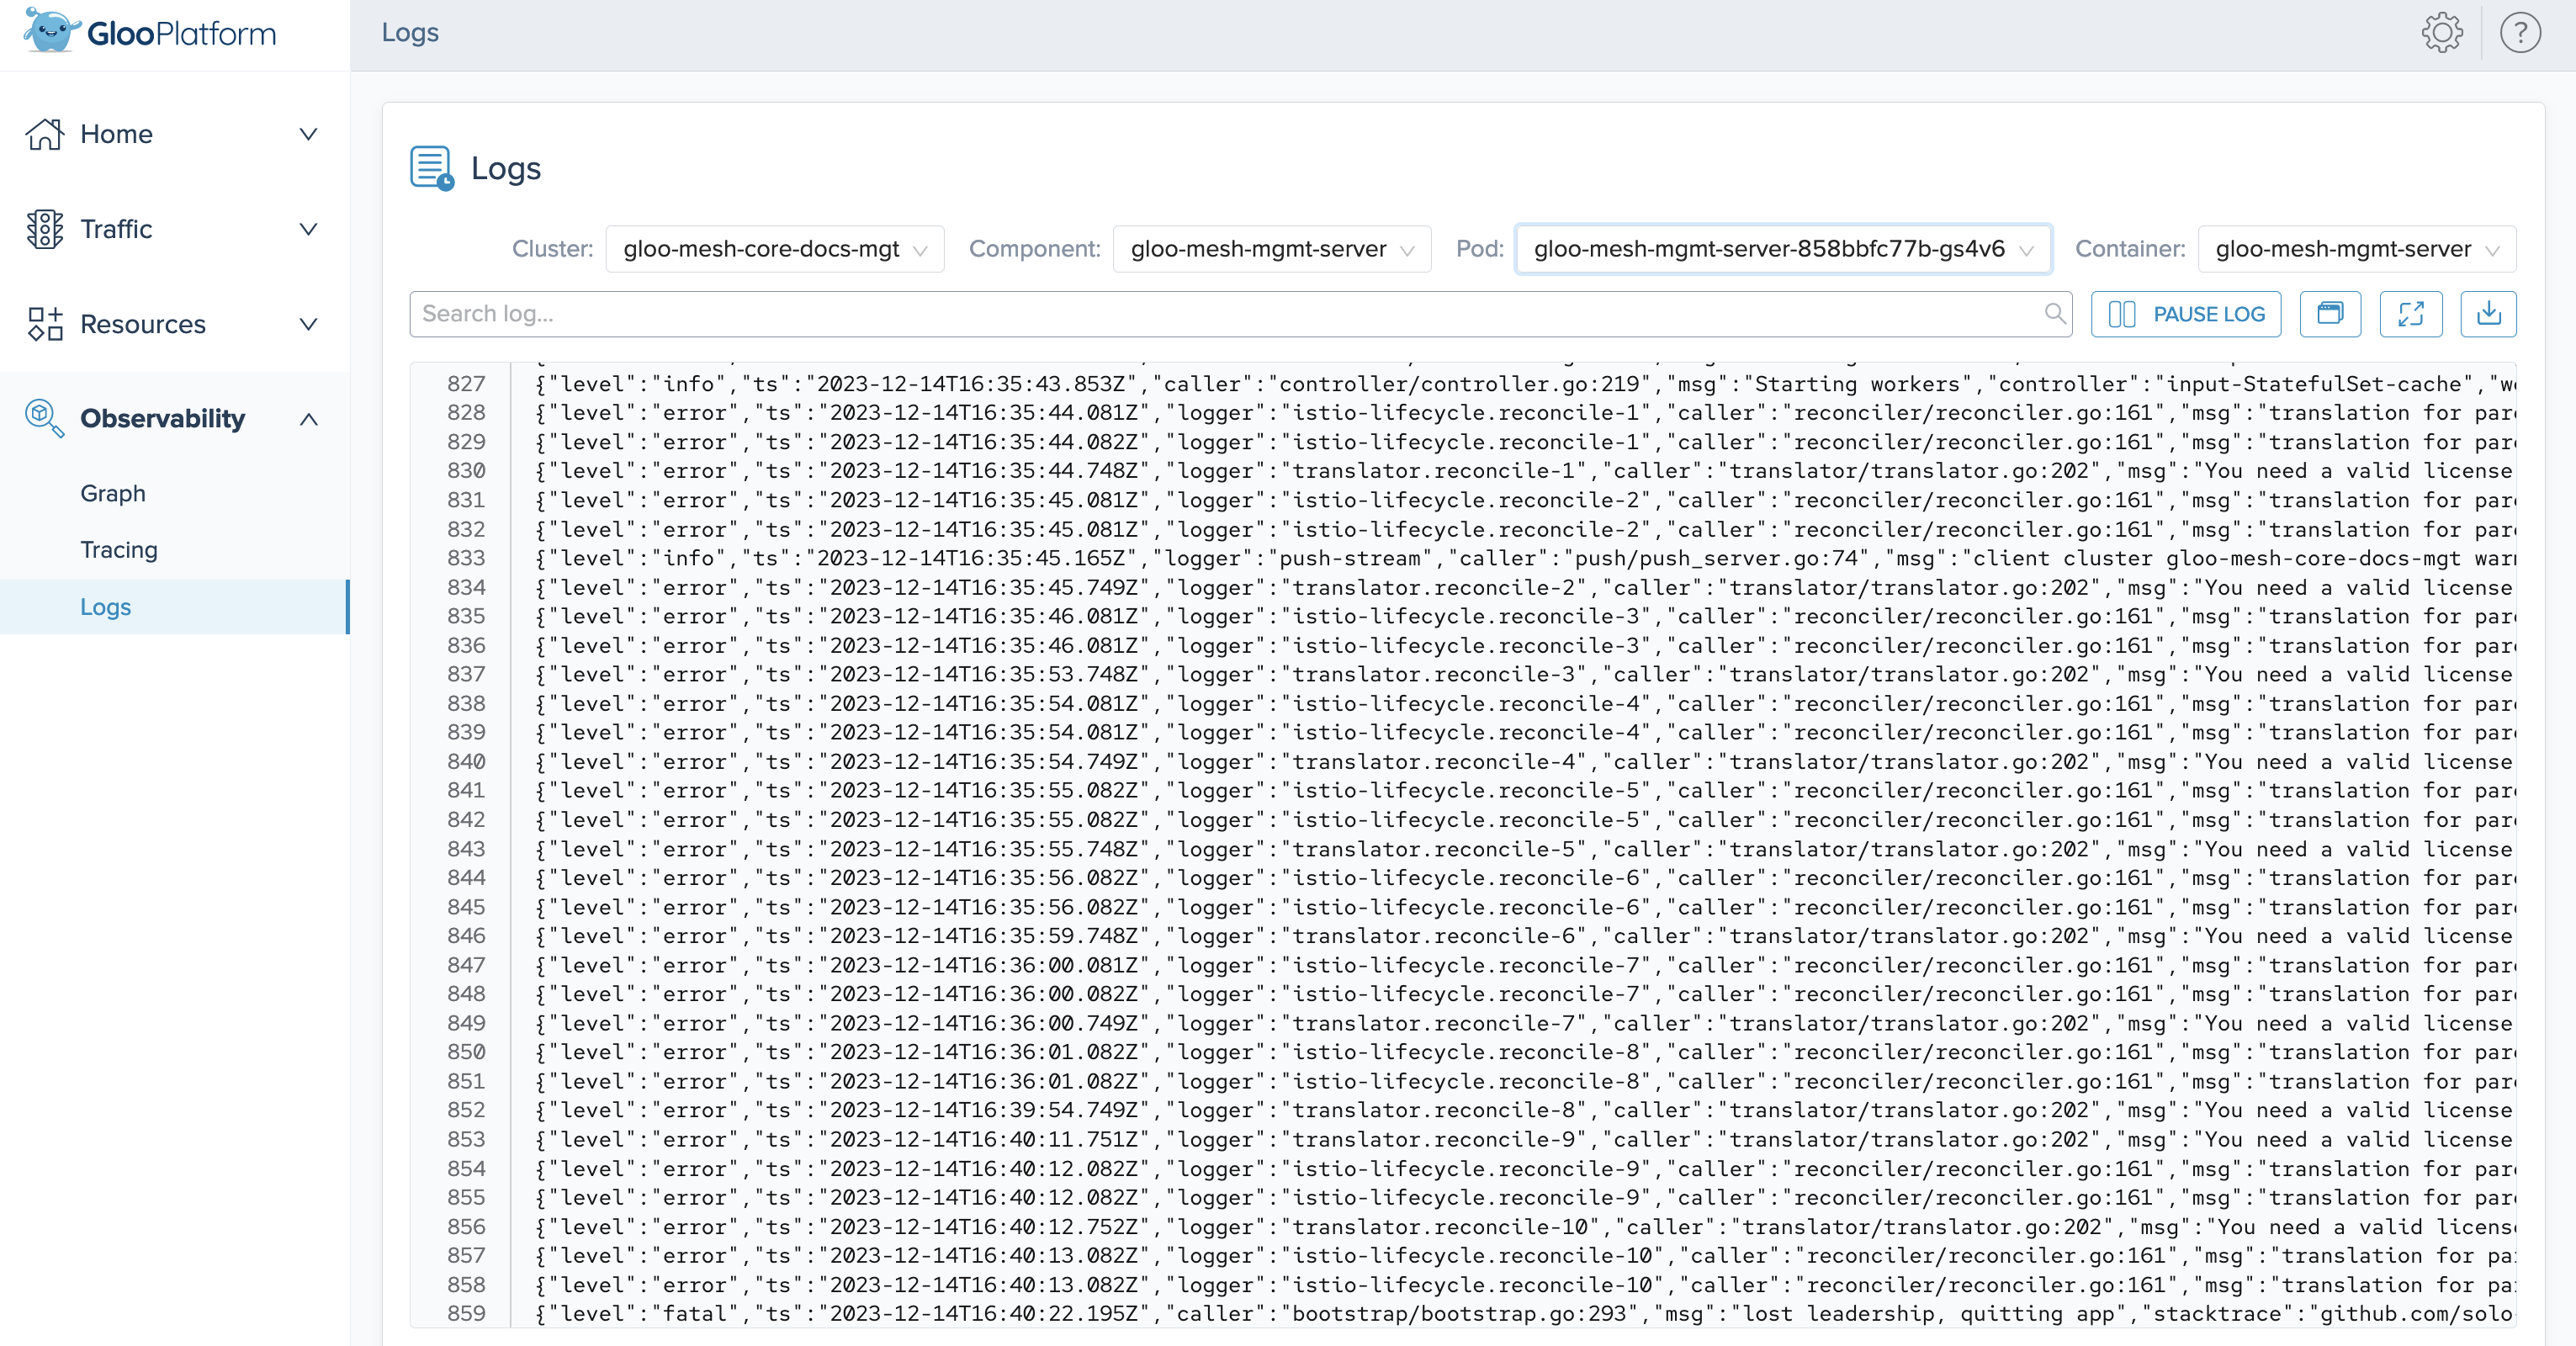
Logs
You can use the Gloo UI log viewer to see the logs of Gloo components, such as the Gloo management server, the Gloo telemetry collector agent, or the Gloo UI. These logs can help you monitor the health of your Gloo components and troubleshoot issues.
To view logs, use the log viewer filter options to select the cluster, Gloo Network component, pod name, and, if applicable, the container that you want to check the logs for. You can also use the search capability to find logs that match a specific search term, or download the logs so that you can share them with your team.