General debugging
Running into an issue while using Gloo Network? Try the following general debugging steps to find why things might not behave as expected.
Debug your environment
- Make sure that you run a supported version of Gloo, Istio, and Kubernetes and their related command line interface (CLI) tools. If not, upgrade your version and CLIs.
- Review your infrastructure provider for any errors, incidents, or outages that might impact your clusters, load balancers, and related infrastructure. Common configuration problems happen in the following resources:
- Firewalls
- Application load balancer (ALB) settings
- Expired or malformatted certificates, tokens, and secrets
- Check your Gloo Network environment for errors, such as an expired license or an unhealthy pod.
- Depending on which component has issues, try one of the debugging guides:
- To help you debug issues in your environment, you can generate a
.tar.gzfile of your Gloo and Istio operational information. For more information, see the CLI reference.meshctl debug report- To generate a file for multiple clusters:
meshctl debug report --kubecontext cluster1,cluster2,cluster3 - To include information from application namespaces in addition to the
gloo-meshand Istio namespaces:meshctl debug report --include-namespaces app1,app2 - To upload the debug information to a secure repo owned by Solo.io, you can set a folder structure that makes it easy to identify your upload.
meshctl debug report --upload true --upload-dir <your_name>/<issue_name>
- To generate a file for multiple clusters:
Debug with the UI
The Gloo UI provides a single pane of glass from which you can assess what might be wrong in your environment.
Open the Gloo UI. The Gloo UI is served from the
gloo-mesh-uiservice on port 8090. You can connect by using themeshctlorkubectlCLIs.- Review the following sections to help you scan your environment for errors or warnings.
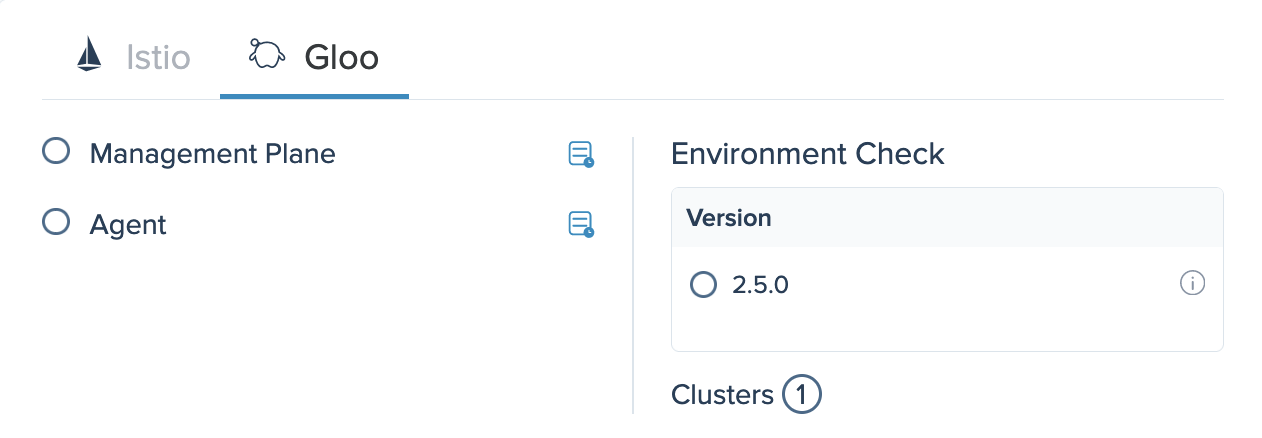
Dashboard
The Gloo and Istio health card of the dashboard provides a check of the Gloo Network and Istio installations in your clusters. Each tab provides an at-a-glance status of the health of each Gloo Network and Istio component. You can click the link button beside each component to see more details about its health. The environment check shows all versions of Gloo Network or Istio that are installed in your environment, the state of each installation, and the number of clusters in your environment. The environment checks can help you identify overall issues with your installations, such as version mismatches between the control and data planes.
Inventory
The Inventory section provides an at-a-glance look at the health of registered clusters and discovered services that make up your Gloo environment.
Clusters
On the Clusters page, review basic details of each cluster that you registered with the Gloo management plane.
To filter clusters by the cluster’s Gloo Network installation health, click the Healthy and Unhealthy buttons. You can also use the Sort by Name dropdown or the search bar to filter clusters by name.
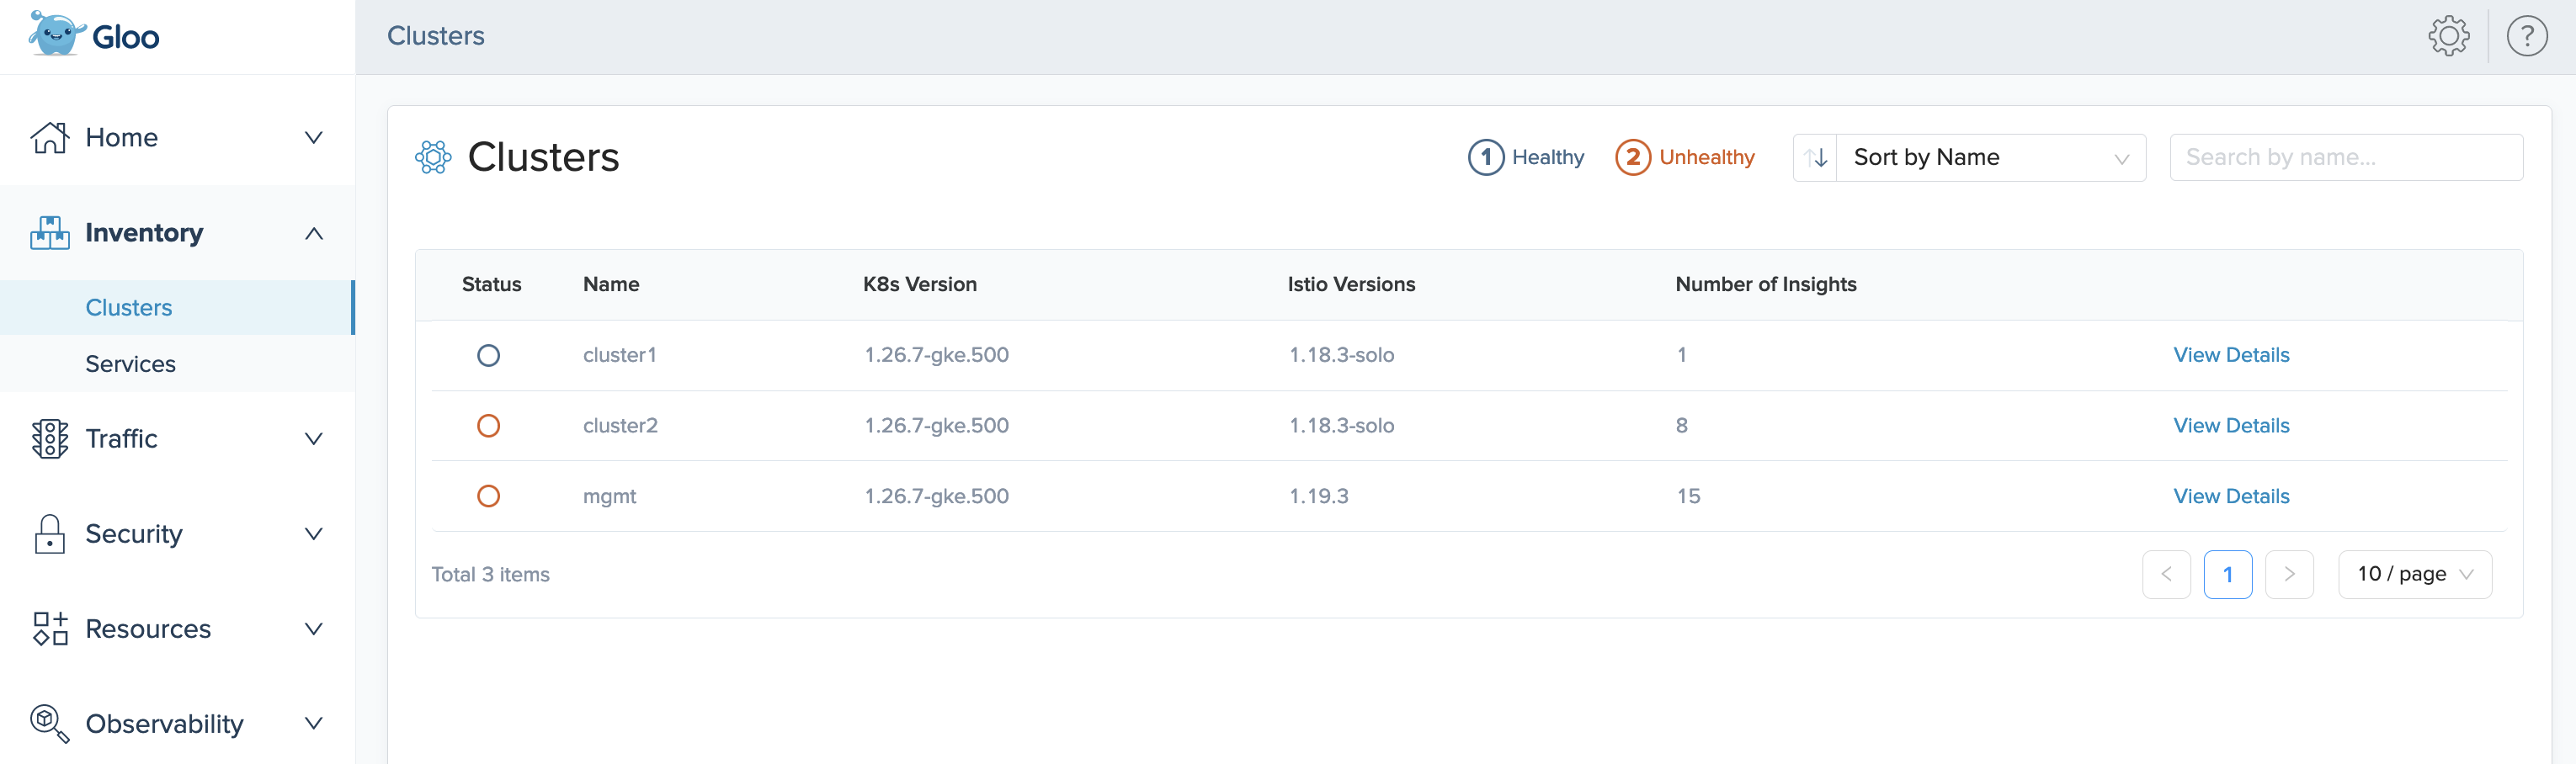
Figure: Clusters page Click More Details to see a more detailed dashboard for the cluster. This dashboard can help you find errors in your Gloo setup.
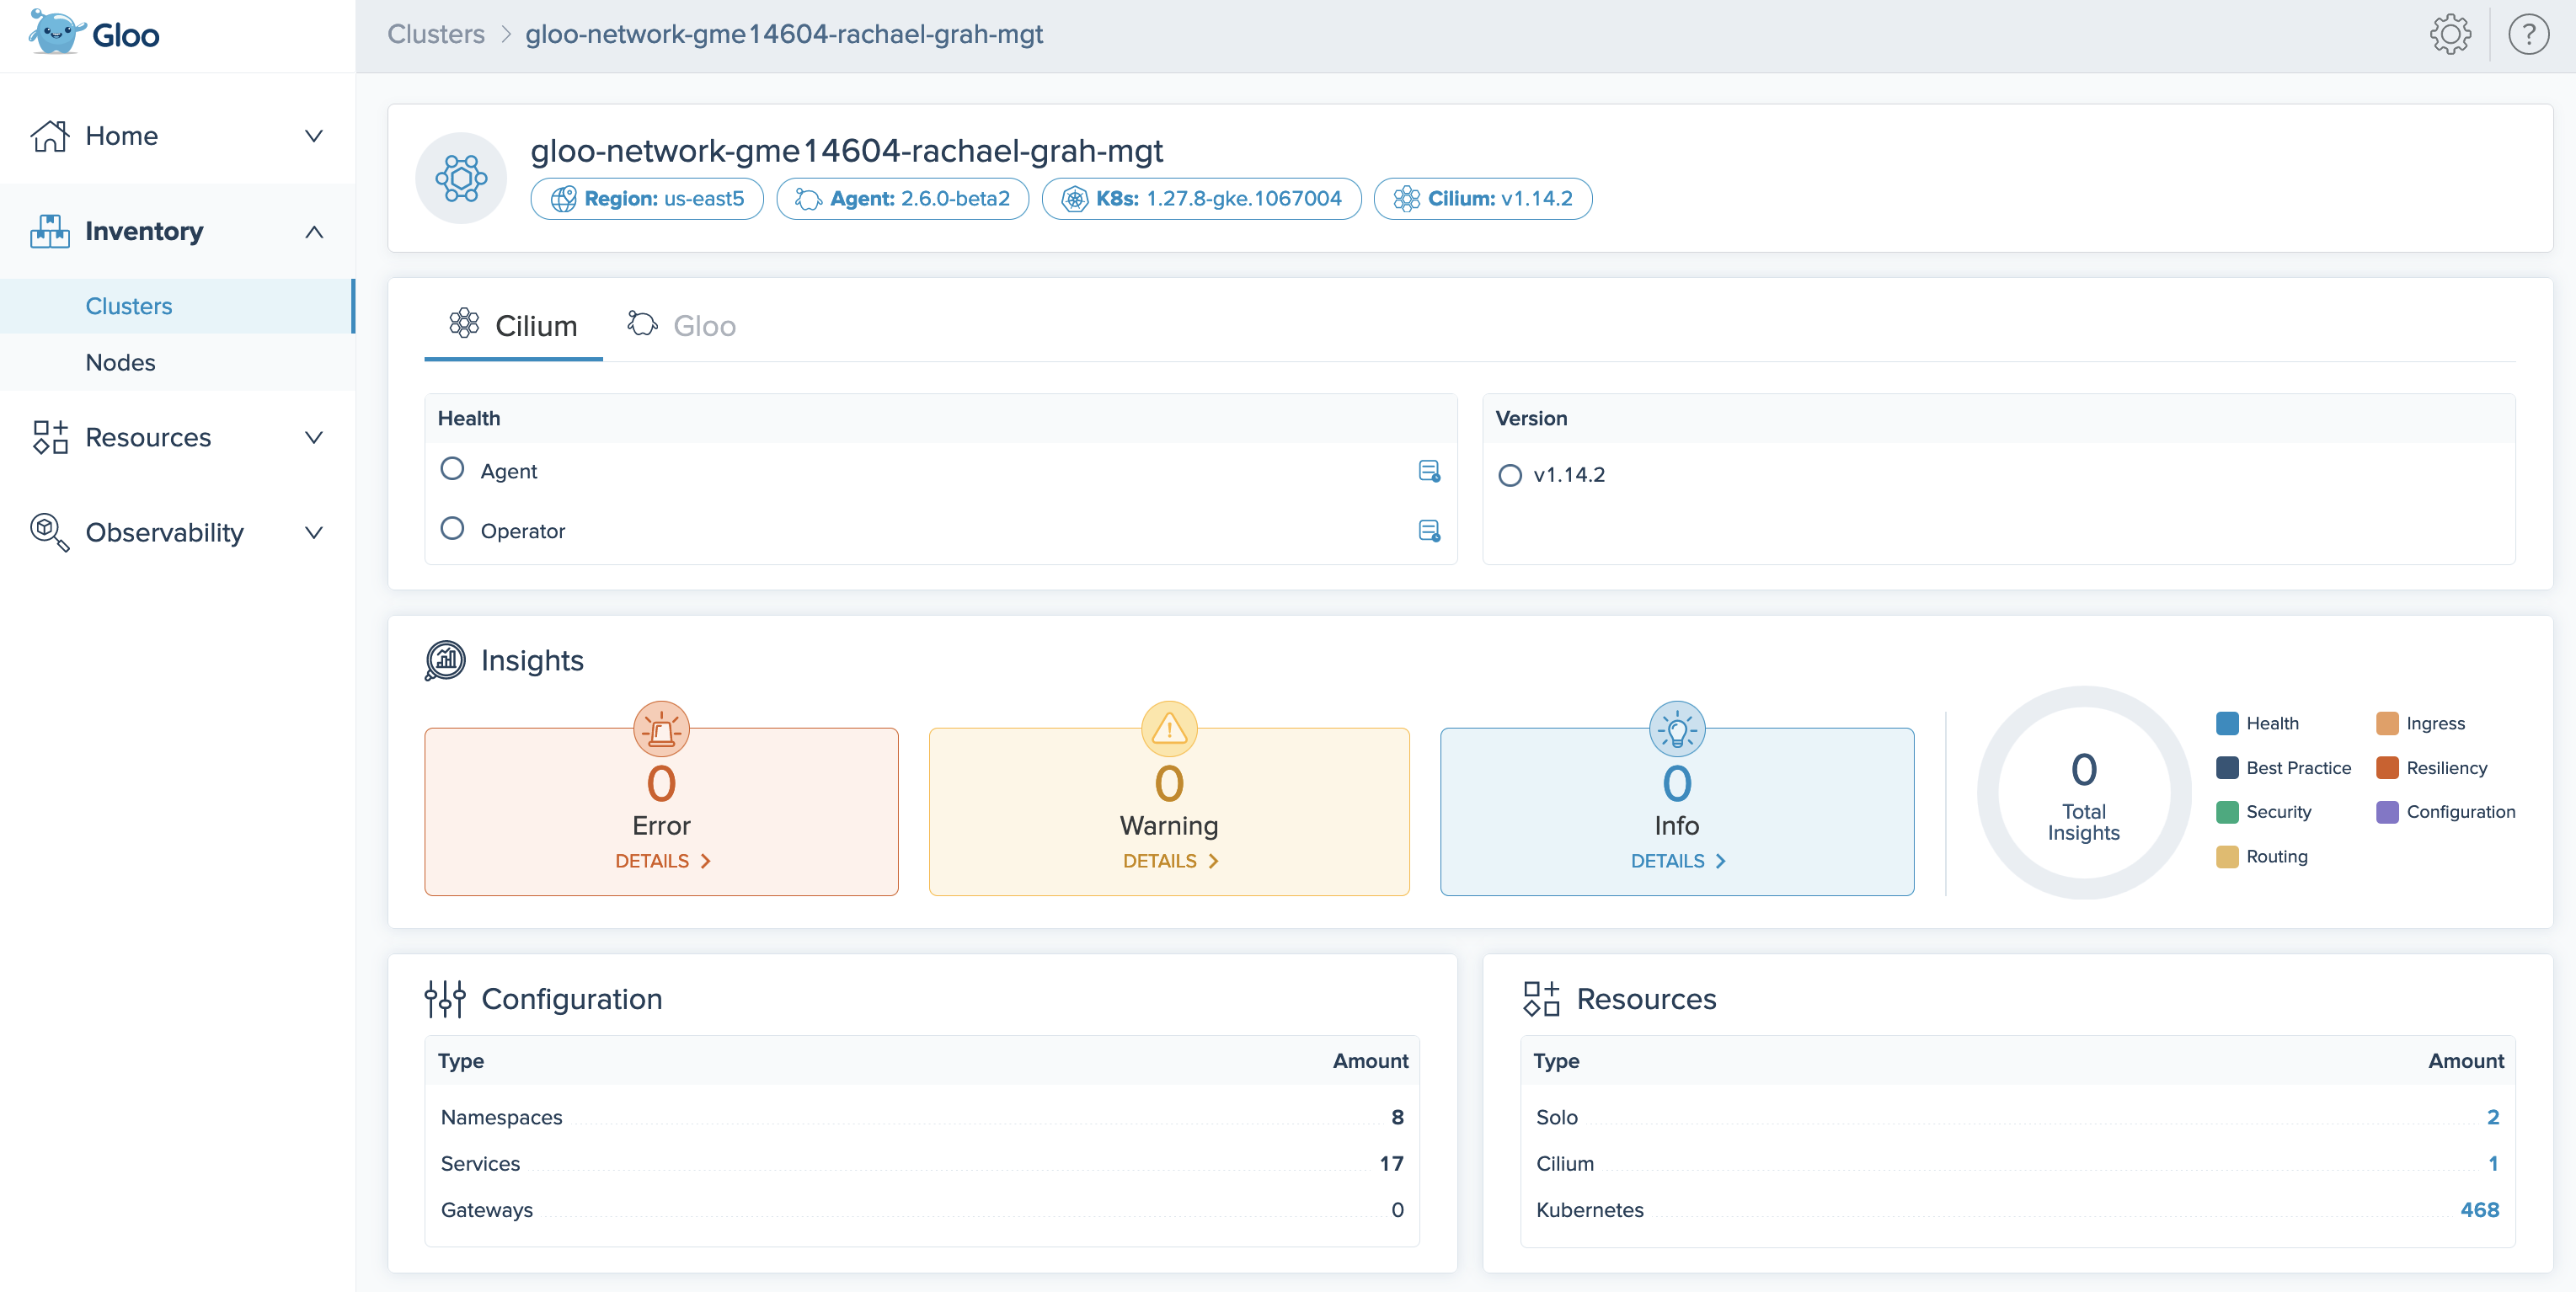
Figure: Cluster details page
Services
On the Services page, review a list of the discovered services across all clusters in your Gloo setup. Quickly find out if traffic cannot reach your services by clicking the Healthy and Unhealthy buttons. You can also filter services by name using the search bar, filter by in-mesh and out-of-mesh services, and modify the timeframe that services are available in by using the dropdown menu.
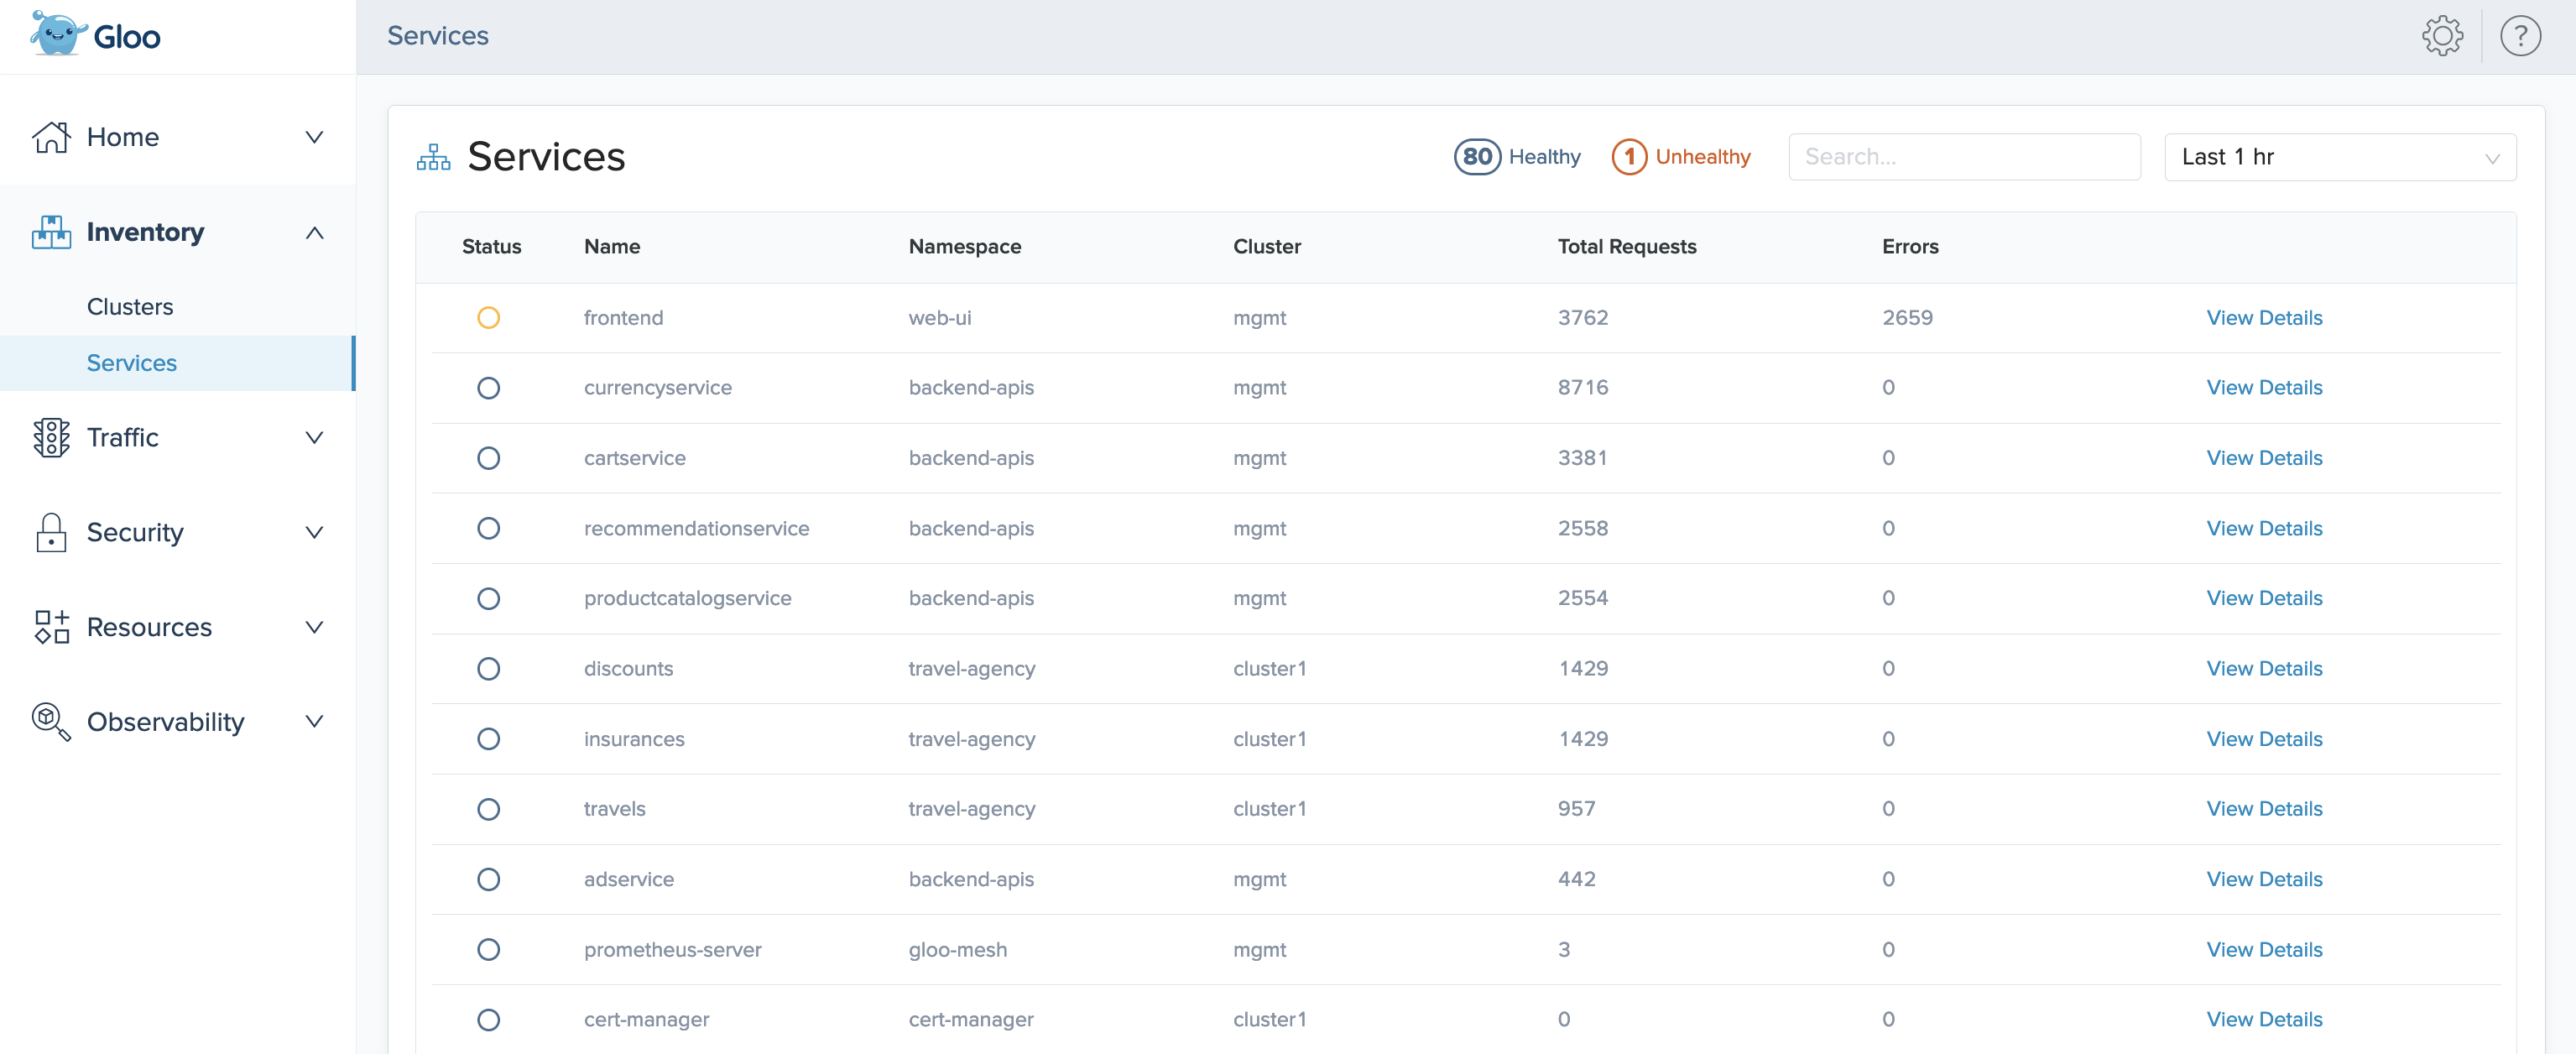
Note that the health of your services on the Services overview page refers to whether network traffic requests are getting fulfilled by the service. You can review the configuration health of the service by clicking Details.
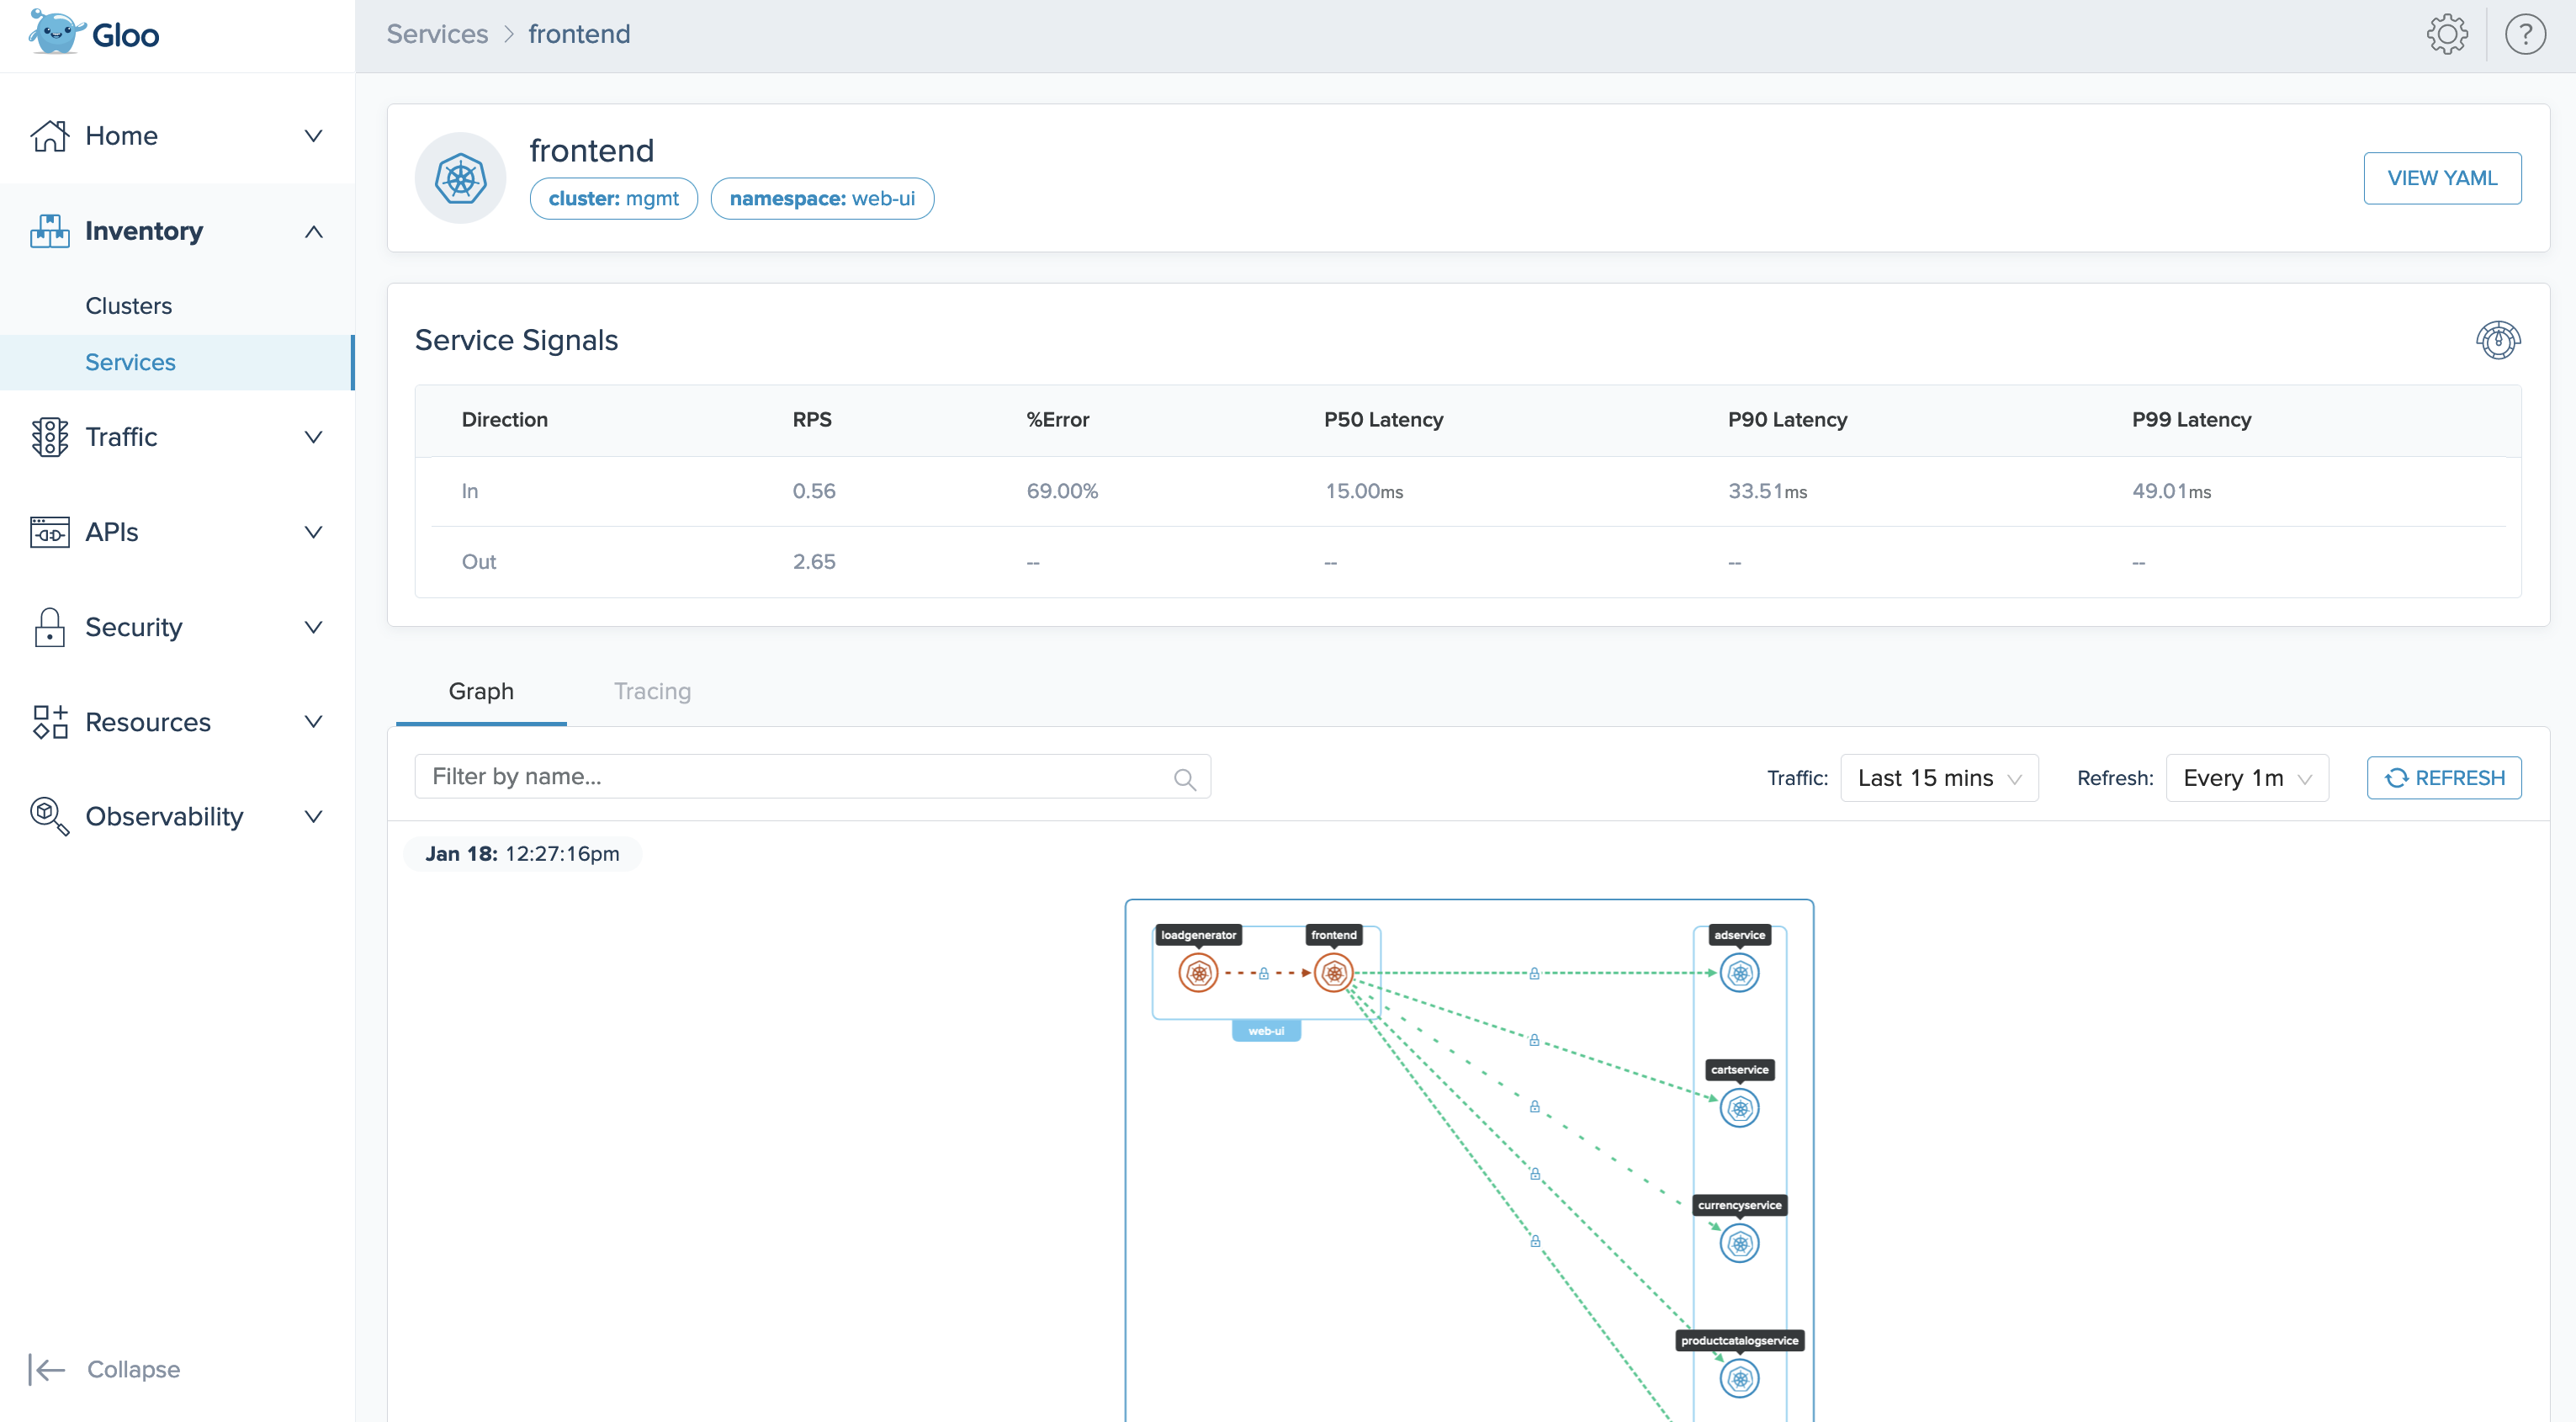
From the Details page of a service:
- To debug the service, click View YAML to view the service’s YAML configuration.
- See an analysis of the service’s error rate and latency in the Service Signals card.
- View the Graph tab to visualize the network traffic that reaches your service mesh. For more information about how to use the graph, see Graph.
- If you enable tracing in the Gloo telemetry pipeline, you can see request traces for a service in the built-in Jaeger UI that you can find in the Tracing tab. For more information about how to enable and use the tracing interface, see Tracing.
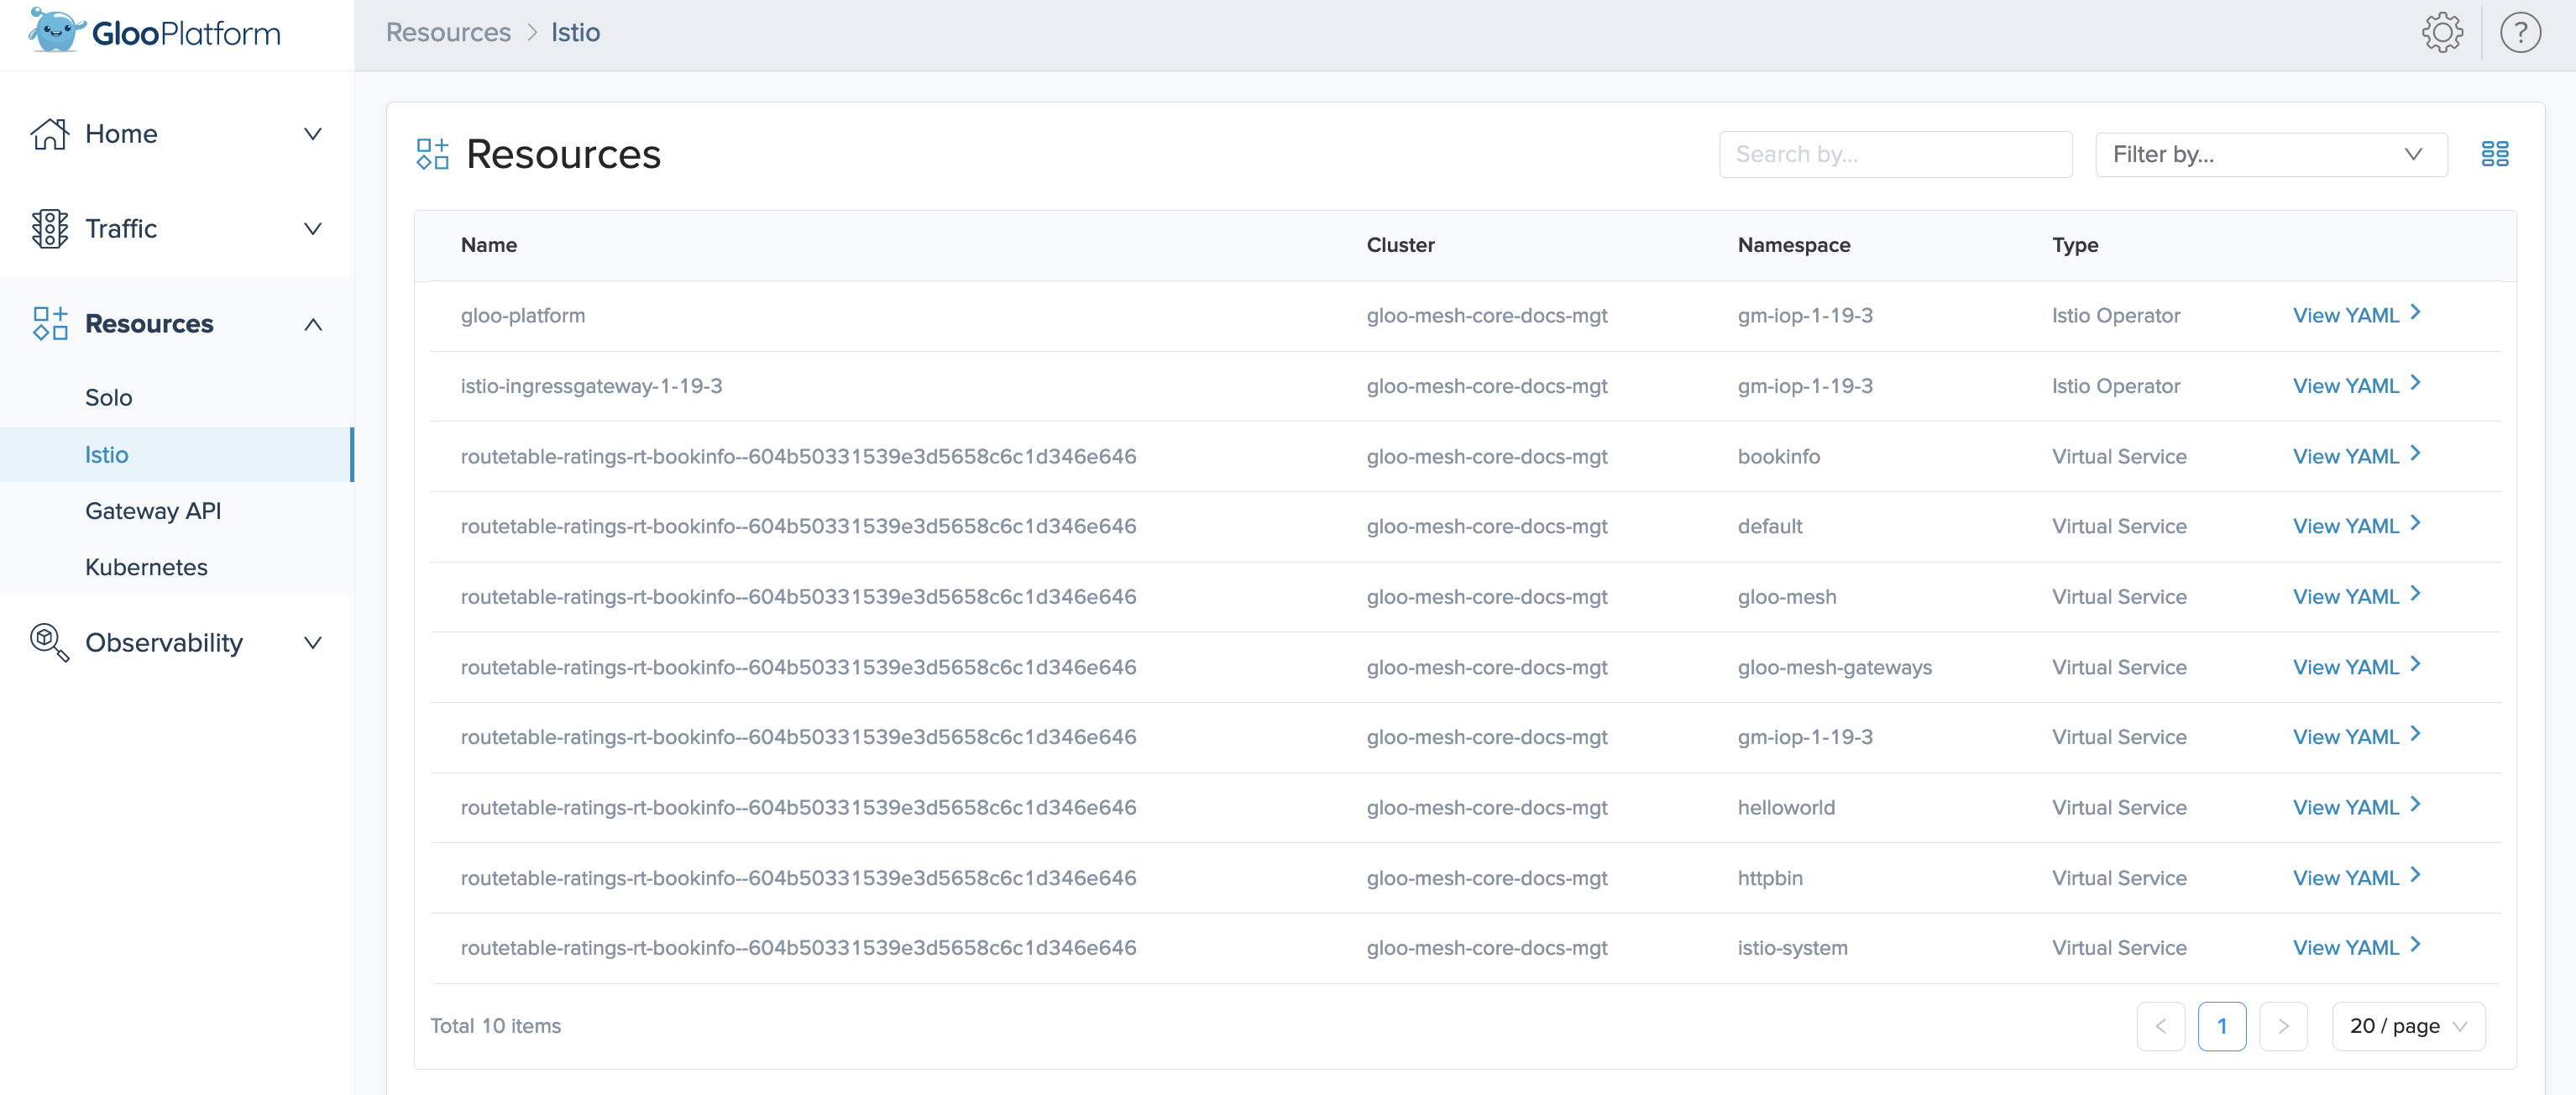
Resources
The Resources section provides the configuration of each Istio, Cilium, Gateway API, and Kubernetes resource in your environment to help you locate and resolve configuration issues. With the Filter by… dropdown, you can filter services by resource type.
To debug specific resources, click View YAML to view the resource’s YAML configuration.