Multicluster
Deploy Gloo Network for Cilium across multiple clusters, and use Solo images to deploy the Cilium CNI.
Use Gloo Network for Cilium to provide connectivity, security, and observability for containerized workloads with a Cilium-based container network interface (CNI) plug-in that leverages the Linux kernel technology eBPF. Gloo Network additionally provides insights into your Cilium environment through a custom dashboard.
You can follow this guide to quickly get started with Gloo Network. To learn more about the benefits and architecture, see About. To customize your installation with Helm instead, see the advanced installation guide.
Before you begin
Install the following command-line (CLI) tools.
kubectl, the Kubernetes command line tool. Download thekubectlversion that is within one minor version of the Kubernetes clusters you plan to use.meshctl, the Solo command line tool.curl -sL https://run.solo.io/meshctl/install | GLOO_MESH_VERSION=v2.5.11 sh - export PATH=$HOME/.gloo-mesh/bin:$PATH
Create environment variables for the following details.
GLOO_NETWORK_LICENSE_KEY: Set your Gloo Network for Cilium license key as an environment variable. If you do not have one, contact an account representative.GLOO_VERSION: Set the Gloo Network version. This example uses the latest version. Append-fipsfor a FIPS-compliant image. Do not includevbefore the version number.SOLO_CILIUM_REPO: A repo key for the Solo distribution of Cilium that you can get by logging in to the Support Center and reviewing the Cilium images built by Solo.io support article.CILIUM_VERSION: The Cilium version that you want to install. This example uses the latest version.
  export GLOO_NETWORK_LICENSE_KEY=<license_key>
export GLOO_VERSION=2.5.11
export SOLO_CILIUM_REPO=<cilium_repo_key>
export CILIUM_VERSION=1.14.2
Optional: If you plan to run Istio with sidecar injection and the Cilium CNI in tunneling mode (
VXLANorGENEVE) on an Amazon EKS cluster, see Considerations for running Cilium and Istio on EKS.
Install the Solo distribution of the Cilium CNI
Create or use Kubernetes clusters that meet the Cilium requirements. For example, to try out the Cilium CNI in Google Kubernetes Engine (GKE) clusters, your clusters must be created with specific node taints.
Open the Cilium documentation and find the cloud provider that you want to use to create your clusters.
Follow the steps of your cloud provider to create one or more clusters that meet the Cilium requirements.
- The instructions in the Cilium documentation might create a cluster with insufficient CPU and memory resources for Gloo Network. Make sure that you use a machine type with at least 2vCPU and 8GB of memory.
- The cluster name must be alphanumeric with no special characters except a hyphen (-), lowercase, and begin with a letter (not a number).
- Multicluster setups only: For a multicluster setup, you need at least two clusters. One cluster is set up as the Gloo management plane where the management components are installed. The other cluster is registered as your data plane and runs your Kubernetes workloads and Istio service mesh. You can optionally add more workload clusters to your setup. The instructions in this guide assume one management cluster and two workload clusters.
Example to create a cluster in GKE:
  export NAME="$(whoami)-$RANDOM"
gcloud container clusters create "${NAME}" \
--node-taints node.cilium.io/agent-not-ready=true:NoExecute \
--zone us-west2-a \
--machine-type e2-standard-2
gcloud container clusters get-credentials "${NAME}" --zone us-west2-a
Add and update the Cilium Helm repo.
  helm repo add cilium https://helm.cilium.io/
helm repo update
Install the CNI by using a Solo distribution of Cilium in your cluster. Be sure to include the following settings for compatability with Gloo Network, and the necessary settings for your infrastructure provider.
The steps to install the CNI vary depending on the way you create your cluster. For example, installing the CNI in a kind cluster is different from installing the CNI in a GKE cluster. Depending on the cloud provider you use, you must update this command to add additional Helm values as suggested in the Cilium documentation.Example output:
  NAME: cilium
LAST DEPLOYED: Fri Sep 16 10:31:52 2022
NAMESPACE: kube-system
STATUS: deployed
REVISION: 1
TEST SUITE: None
NOTES:
You have successfully installed Cilium with Hubble.

Your release version is 1.14.2.

For any further help, visit https://docs.cilium.io/en/v1.12/gettinghelp
Verify that the Cilium CNI is successfully installed. Because the Cilium agent is deployed as a daemon set, the number of Cilium and Cilium node init pods equals the number of nodes in your cluster.
kubectl get pods -n kube-system | grep ciliumExample output:
  cilium-gbqgq                                                  1/1     Running             0          48s
cilium-j9n5x                                                  1/1     Running             0          48s
cilium-node-init-c7rxb                                        1/1     Running             0          48s
cilium-node-init-pnblb                                        1/1     Running             0          48s
cilium-node-init-wdtjm                                        1/1     Running             0          48s
cilium-operator-69dd4567b5-2gjgg                              1/1     Running             0          47s
cilium-operator-69dd4567b5-ww6wp                              1/1     Running             0          47s
cilium-smp9c                                                  1/1     Running             0          48s
Check the status of the Cilium installation.
cilium status --waitExample output:
____/¯¯\
 /¯¯\__/¯¯\    Cilium:             OK
 \__/¯¯\__/    Operator:           OK
 /¯¯\__/¯¯\    Envoy DaemonSet:    disabled (using embedded mode)
 \__/¯¯\__/    Hubble Relay:       disabled
    \__/       ClusterMesh:        disabled

Deployment             cilium-operator    Desired: 2, Ready: 2/2, Available: 2/2
DaemonSet              cilium             Desired: 4, Ready: 4/4, Available: 4/4
Containers:            cilium-operator    Running: 2
                       cilium             Running: 4
Cluster Pods:          3/3 managed by Cilium
Helm chart version:    1.14.2
Image versions         cilium             ${SOLO_CILIUM_REPO}/cilium:v1.14.2: 4
                       cilium-operator    ${SOLO_CILIUM_REPO}/operator-generic:v1.14.2: 2
Multicluster setups only: Repeat steps 3 - 5 to install the CNI in each cluster that you want to use in your Gloo Network environment.
Install Gloo Network for Cilium
In a multicluster setup, you deploy the Gloo management plane into a dedicated management cluster, and the Gloo data plane into one or more workload clusters.
Management plane
Deploy the Gloo management plane into a dedicated management cluster.
Set the names of your clusters from your infrastructure provider. If your clusters have different names, specify those names instead.
export MGMT_CLUSTER=mgmt export REMOTE_CLUSTER1=cluster1 export REMOTE_CLUSTER2=cluster2- Save the kubeconfig contexts for your clusters. Run
kubectl config get-contexts, look for your cluster in theCLUSTERcolumn, and get the context name in theNAMEcolumn. Note: Do not use context names with underscores. The generated certificate that connects workload clusters to the management cluster uses the context name as a SAN specification, and underscores in SAN are not FQDN compliant. You can rename a context by runningkubectl config rename-context "<oldcontext>" <newcontext>.export MGMT_CONTEXT=<management-cluster-context> export REMOTE_CONTEXT1=<remote-cluster1-context> export REMOTE_CONTEXT2=<remote-cluster2-context> Install Gloo Network in your management cluster. This command uses a basic profile to create a
gloo-meshnamespace and install the Gloo management plane components, such as the management server and Prometheus server, in your management cluster. For more information, check out the CLI install profiles.meshctl install --profiles gloo-core-mgmt,cilium-flows \ --kubecontext $MGMT_CONTEXT \ --set common.cluster=$MGMT_CLUSTER \ --set licensing.glooNetworkLicenseKey=$GLOO_NETWORK_LICENSE_KEY \ --set telemetryCollectorCustomization.pipelines.metrics/cilium.enabled=trueVerify that the management plane pods have a status of
Running.kubectl get pods -n gloo-mesh --context $MGMT_CONTEXTExample output:
  NAME                                      READY   STATUS    RESTARTS   AGE
gloo-mesh-mgmt-server-56c495796b-cx687    1/1     Running   0          30s
gloo-mesh-redis-8455d49c86-f8qhw          1/1     Running   0          30s
gloo-mesh-ui-65b6b6df5f-bf4vp             3/3     Running   0          30s
gloo-telemetry-collector-agent-7rzfb      1/1     Running   0          30s
gloo-telemetry-gateway-6547f479d5-r4zm6   1/1     Running   0          30s
prometheus-server-57cd8c74d4-2bc7f        2/2     Running   0          30s
Data plane
Register each workload cluster with the Gloo management plane by deploying Gloo data plane components. A deployment named gloo-mesh-agent runs the Gloo agent in each workload cluster.
Save the external address and port that your cloud provider assigned to the Gloo OpenTelemetry (OTel) gateway service. The OTel collector agents in each workload cluster send metrics to this address.
  export TELEMETRY_GATEWAY_IP=$(kubectl get svc -n gloo-mesh gloo-telemetry-gateway --context $MGMT_CONTEXT -o jsonpath="{.status.loadBalancer.ingress[0]['hostname','ip']}")
export TELEMETRY_GATEWAY_PORT=$(kubectl get svc -n gloo-mesh gloo-telemetry-gateway --context $MGMT_CONTEXT -o jsonpath='{.spec.ports[?(@.name=="otlp")].port}')
export TELEMETRY_GATEWAY_ADDRESS=${TELEMETRY_GATEWAY_IP}:${TELEMETRY_GATEWAY_PORT}
echo $TELEMETRY_GATEWAY_ADDRESS
Save the following settings in a values file.
  cat > "cilium-values.yaml" <<EOF
telemetryCollectorCustomization:
  pipelines:
    metrics/cilium:
      enabled: true
EOF
Register both workload clusters with the management server. These commands use basic profiles to create a
gloo-meshnamespace and install the Gloo data plane components, such as the Gloo agent. For more information, check out the CLI install profiles.meshctl cluster register $REMOTE_CLUSTER1 \ --kubecontext $MGMT_CONTEXT \ --profiles gloo-core-agent,cilium-flows \ --remote-context $REMOTE_CONTEXT1 \ --telemetry-server-address $TELEMETRY_GATEWAY_ADDRESS \ --gloo-mesh-agent-chart-values cilium-values.yaml meshctl cluster register $REMOTE_CLUSTER2 \ --kubecontext $MGMT_CONTEXT \ --profiles gloo-core-agent,cilium-flows \ --remote-context $REMOTE_CONTEXT2 \ --telemetry-server-address $TELEMETRY_GATEWAY_ADDRESS \ --gloo-mesh-agent-chart-values cilium-values.yamlVerify that the Gloo data plane components in each workload cluster are healthy. If not, try debugging the agent.
  meshctl check --kubecontext $REMOTE_CONTEXT1
meshctl check --kubecontext $REMOTE_CONTEXT2
Example output:
  🟢 Gloo deployment status

Namespace | Name                           | Ready | Status
gloo-mesh | gloo-mesh-agent                | 1/1   | Healthy
gloo-mesh | gloo-telemetry-collector-agent | 3/3   | Healthy
Verify that your Gloo Network setup is correctly installed. If not, try debugging the relay connection. Note that this check might take a few seconds to verify that:
- Your Gloo product licenses are valid and current.
- The Gloo CRDs are installed at the correct version.
- The management plane pods in the management cluster are running and healthy.
- The agents in the workload clusters are successfully identified by the management server.
meshctl check --kubecontext $MGMT_CONTEXTExample output:
  🟢 License status

INFO  gloo-network enterprise license expiration is 25 Aug 24 10:38 CDT
INFO  No GraphQL license module found for any product

🟢 CRD version check

🟢 Gloo deployment status

Namespace | Name                           | Ready | Status
gloo-mesh | gloo-mesh-mgmt-server          | 1/1   | Healthy
gloo-mesh | gloo-mesh-redis                | 1/1   | Healthy
gloo-mesh | gloo-mesh-ui                   | 1/1   | Healthy
gloo-mesh | gloo-telemetry-collector-agent | 3/3   | Healthy
gloo-mesh | gloo-telemetry-gateway         | 1/1   | Healthy
gloo-mesh | prometheus-server              | 1/1   | Healthy

🟢 Mgmt server connectivity to workload agents

Cluster  | Registered | Connected Pod
cluster1 | true       | gloo-mesh/gloo-mesh-mgmt-server-65bd557b95-v8qq6
cluster2 | true       | gloo-mesh/gloo-mesh-mgmt-server-65bd557b95-v8qq6

Connected Pod                                    | Clusters
gloo-mesh/gloo-mesh-mgmt-server-65bd557b95-v8qq6 | 2
Explore the UI
Visualize and analyze your Cilium and Gloo Network setup by deploying sample apps and launching the Gloo UI.
Launch the dashboard
Open the Gloo UI. The Gloo UI is served from the
gloo-mesh-uiservice on port 8090. You can connect by using themeshctlorkubectlCLIs.Review your Dashboard for an at-a-glance overview of your Gloo Network environment. Environment insights, health, status, inventories, and more are summarized in the following cards:
- Analysis and Insights: Gloo Network recommendations for how to improve your Cilium setups.
- Cilium and Gloo health: A status check of the Gloo Network and Cilium installations in your clusters.
- Cluster Services: Inventory of services across all clusters in your Gloo Network setup, and whether those services are in a service mesh or not.
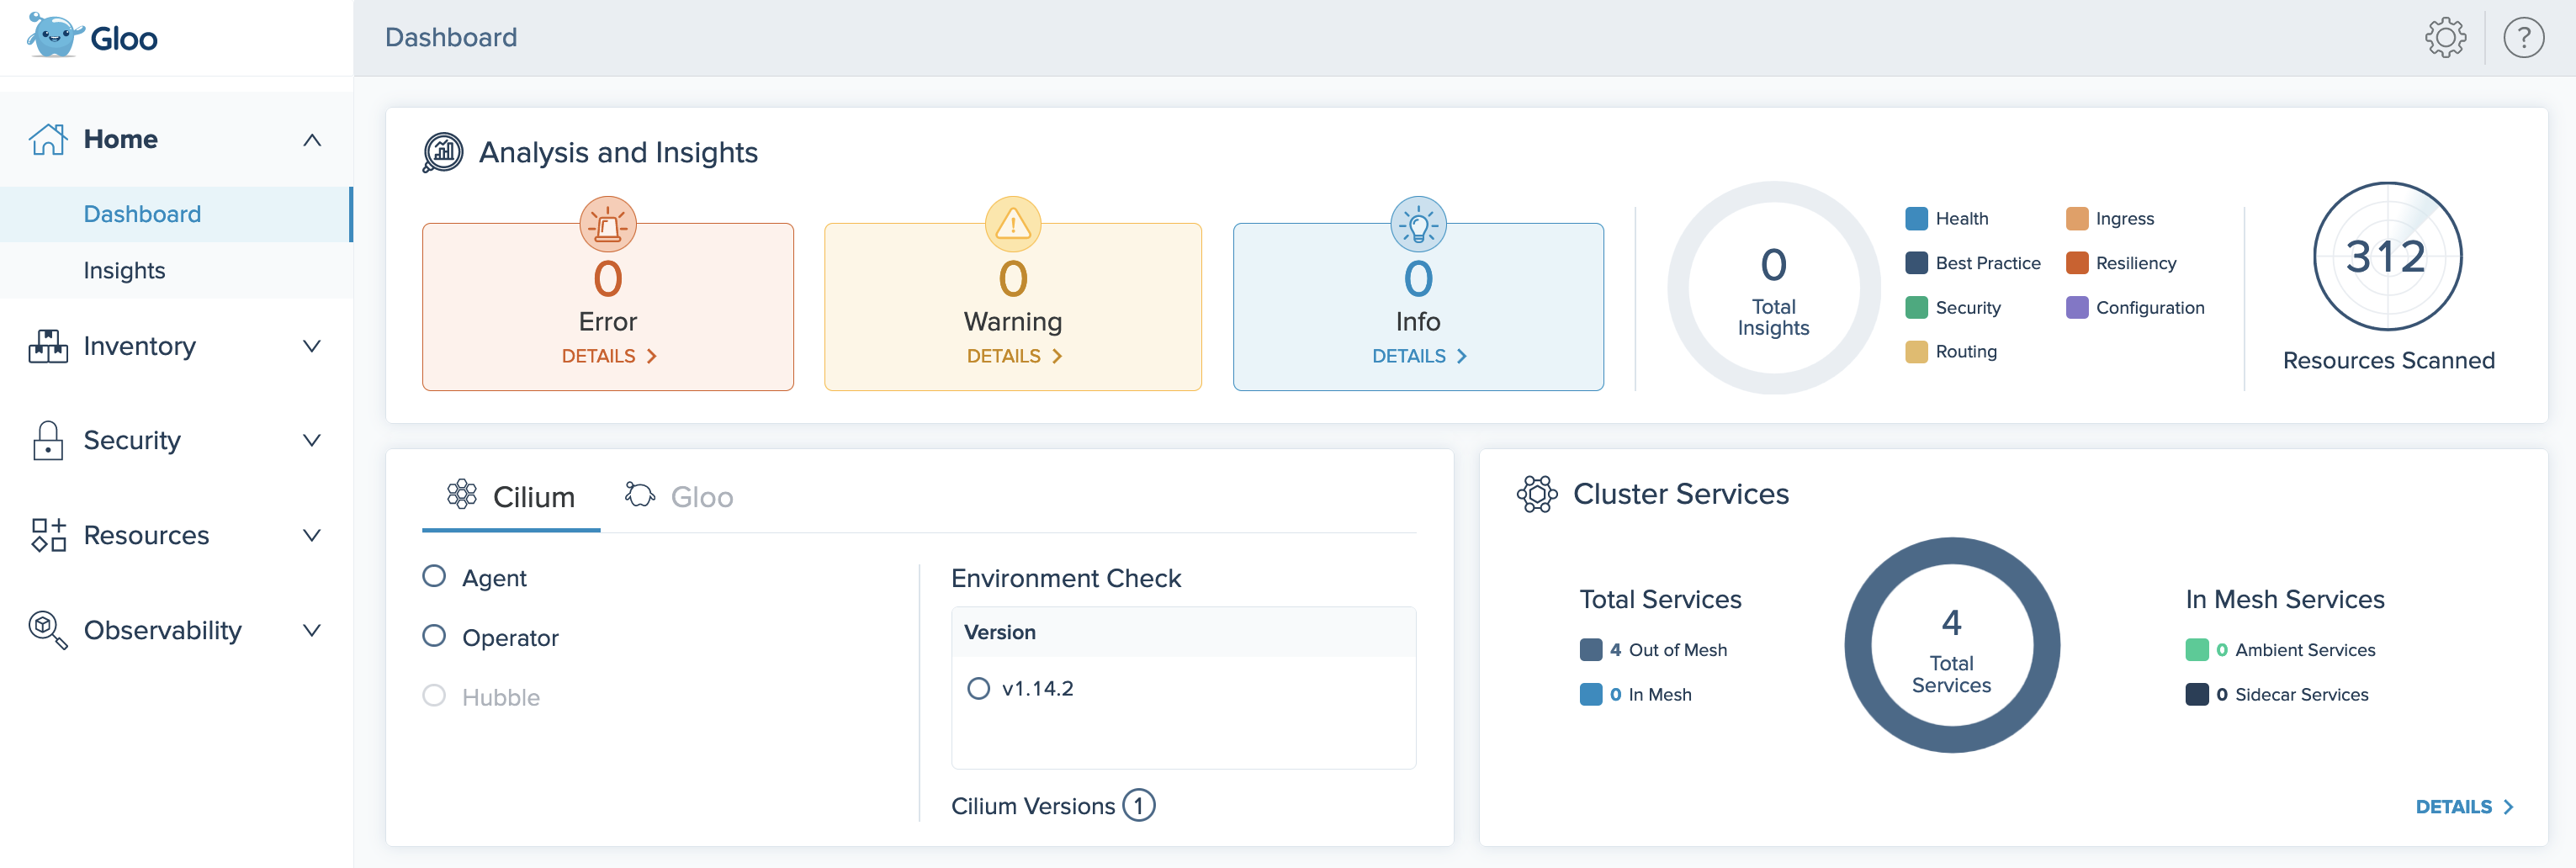
Figure: Gloo UI dashboard Click the Cilium tab in the Cilium and Gloo health card. Verify that the Cilium version in each cluster was discovered.
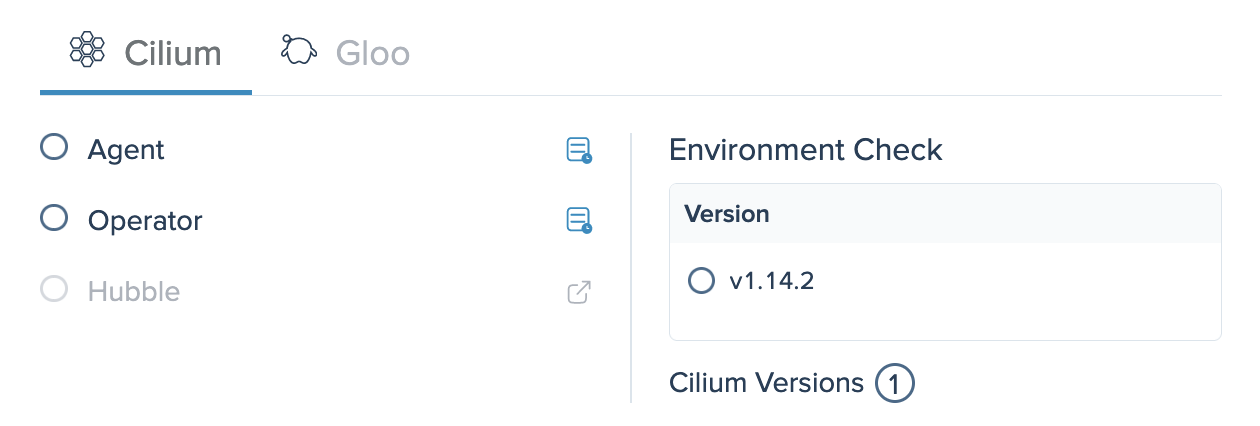
Cilium installation health card in the Gloo UI
Check insights
Review the insights for your environment. Gloo Network comes with an insights engine that automatically analyzes your Cilium setup for health issues. Then, Gloo shares these issues along with recommendations to harden your Cilium setup. The insights give you a checklist to address issues that might otherwise be hard to detect across your environment.
On the Analysis and Insights card of the dashboard, you can quickly see a summary of the insights for your environment, including how many insights are available at each severity level, and the type of insight.
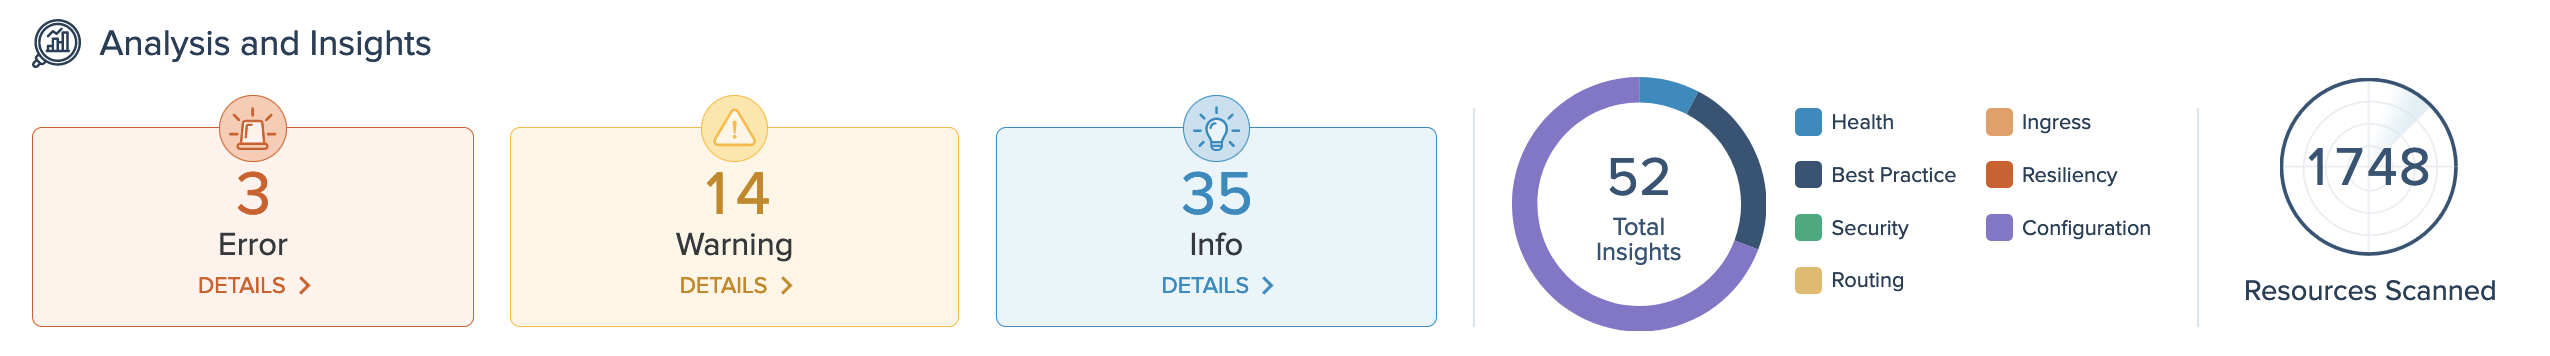
Figure: Insights and analysis card View the list of insights by clicking the Details button, or go to the Insights page.
On the Insights page, you can view recommendations to harden your Cilium setup, and steps to implement them in your environment. Gloo Network analyzes your setup, and returns individual insights that contain information about errors and warnings in your environment, best practices you can use to improve your configuration and security, and more.
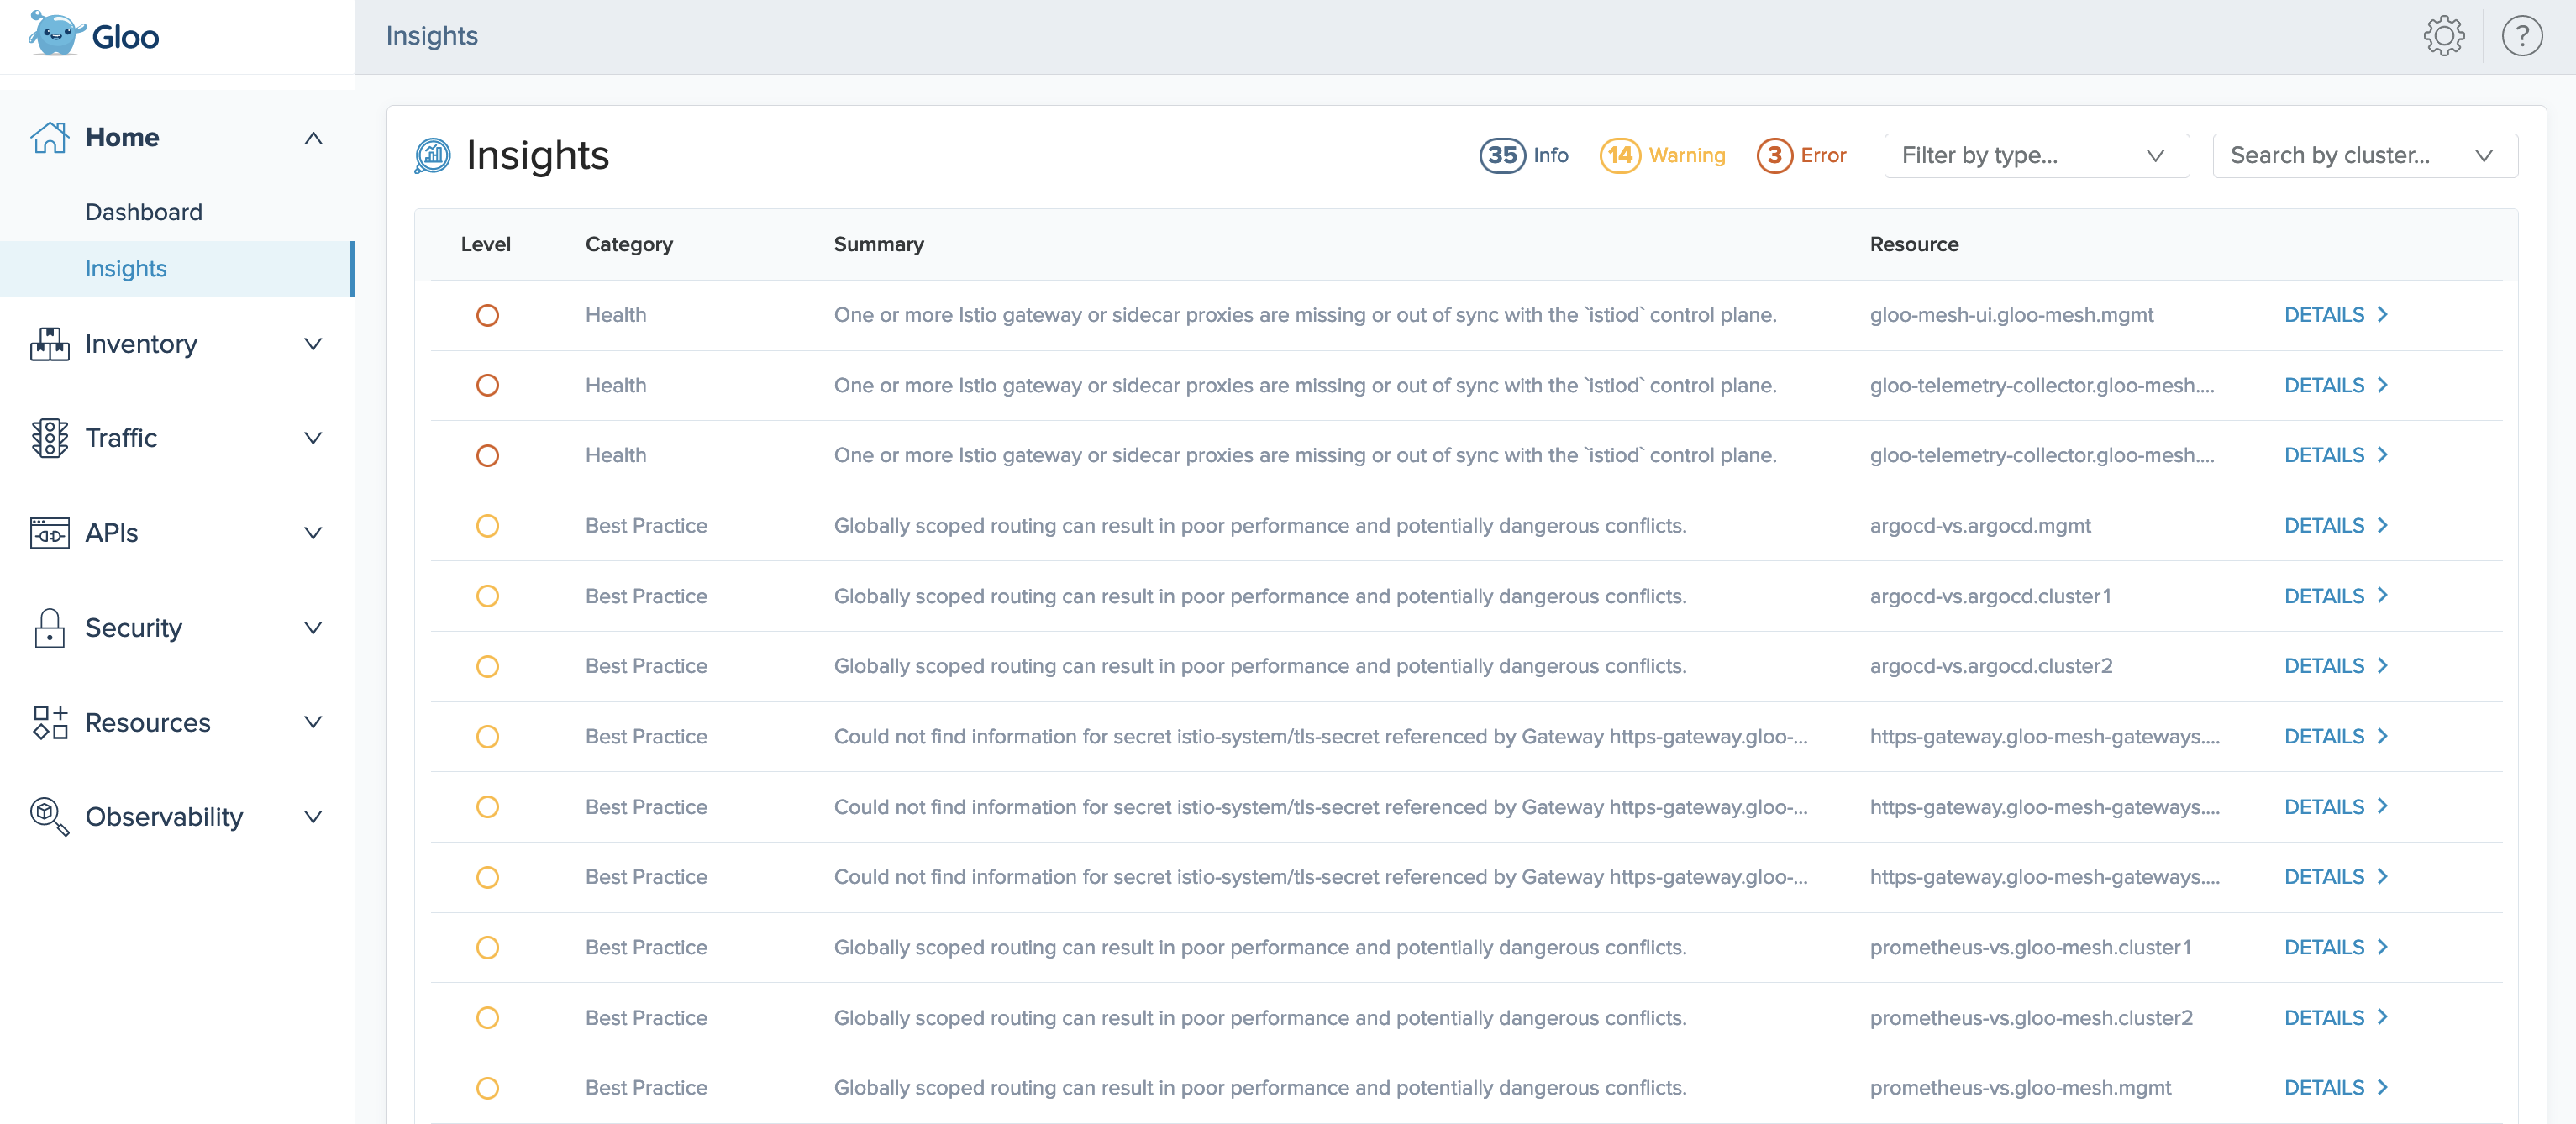
Figure: Insights page On an insight that you want to resolve, click Details. The details modal shows more data about the insight, such as the time when it was last observed in your environment, and if applicable, the extended settings or configuration that the insight applies to.
Click the Target YAML tab to see the resource file that the insight references, and click the View Resolution Steps tab to see guidance such as steps for fixing warnings and errors in your resource configuration or recommendations for improving your security and setup.
Apply a Cilium network policy
Deploy a demo app and try out a Cilium network policy to secure and control traffic flows between app microservices.
Deploy the Cilium Star Wars demo app in your cluster.
Create a namespace for the demo app.
kubectl create ns starwarsDeploy the demo app, which includes
tiefighter,xwing, anddeathstarpods, and adeathstarservice. The tiefighter and deathstar pods have theorg=empirelabel, and the xwing pod has theorg=alliancelabel.kubectl -n starwars apply -f https://raw.githubusercontent.com/cilium/cilium/$CILIUM_VERSION/examples/minikube/http-sw-app.yamlVerify that the demo pods and service are running.
kubectl get pods,svc -n starwarsExample output:
  NAME                             READY   STATUS    RESTARTS   AGE
pod/deathstar-6fb5694d48-5hmds   1/1     Running   0          107s
pod/deathstar-6fb5694d48-fhf65   1/1     Running   0          107s
pod/tiefighter                   1/1     Running   0          107s
pod/xwing                        1/1     Running   0          107s

NAME                 TYPE        CLUSTER-IP    EXTERNAL-IP   PORT(S)   AGE
service/deathstar    ClusterIP   10.96.110.8   <none>        80/TCP    107s
Generate some network traffic by sending requests from the xwing and tiefighter pods to the deathstar service.
  kubectl exec xwing -n starwars -- curl -s -XPOST deathstar.starwars.svc.cluster.local/v1/request-landing
kubectl exec tiefighter -n starwars -- curl -s -XPOST deathstar.starwars.svc.cluster.local/v1/request-landing
Example output for both commands:
  Ship landed
Ship landed
Create a Cilium network policy that allows only apps that have the
org=empirelabel to access the deathstar app. After you create this access policy, only the tiefighter pod can access the deathstar app.kubectl apply -f - << EOF apiVersion: "cilium.io/v2" kind: CiliumNetworkPolicy metadata: name: "rule1" namespace: starwars spec: description: "L3-L4 policy to restrict deathstar access to empire ships only" endpointSelector: matchLabels: org: empire class: deathstar ingress: - fromEndpoints: - matchLabels: org: empire toPorts: - ports: - port: "80" protocol: TCP EOFSend another request from the tiefighter pod to the deathstar service.
kubectl exec tiefighter -n starwars -- curl -s -XPOST deathstar.starwars.svc.cluster.local/v1/request-landingThe request succeeds, because requests from apps with the
org=empirelabel are permitted. Example output:Ship landedSend another request from the xwing pod to the deathstar service.
kubectl exec xwing -n starwars -- curl -s -XPOST deathstar.starwars.svc.cluster.local/v1/request-landingThis request hangs, because requests from apps without the
org=empirelabel are not permitted. No Layer 7 HTTP response code is returned, because the request is dropped on Layer 3. You can entercontrol+cto stop the curl request, or wait for it to time out.You can also check the metrics to verify that the policy allowed or blocked requests.
- Open the Prometheus expression browser.
meshctl: For more information, see the CLI documentation.meshctl proxy prometheuskubectl:- Port-forward the
prometheus-serverdeployment on 9091.kubectl -n gloo-mesh port-forward deploy/prometheus-server 9091 - Open your browser and connect to localhost:9091/.
- Port-forward the
- In the Expression search bar, paste the following query and click Execute.
rate(hubble_drop_total{destination_workload_id=~"deathstar.+"}[5m]) - Verify that you can see requests from the xwing pod to the deathstar service that were dropped because of the network policy.
- Open the Prometheus expression browser.
Next steps
Now that you have Gloo Network for Cilium up and running, check out some of the following resources to learn more about Gloo Network and expand your Cilium capabilities.
Cilium:
- Find out more about hardened Cilium
n-4version support built into Solo distributions of Cilium images. - Enable additional flow logs to monitor network traffic in your cluster.
- Import the Cilium Grafana dashboard to monitor the health of your Cilium CNI.
- Apply more Cilium network policies by following the Cilium docs.
Gloo Network:
- Customize your Gloo Network installation with a Helm-based setup.
Istio: To also deploy Istio in your environment, check out Gloo Mesh Core or Gloo Mesh Enterprise to quickly install and manage your service mesh for you with service mesh lifecycle management.
Help and support:
- Talk to an expert to get advice or build out a proof of concept.
- Join the #gloo-mesh channel in the Solo.io community slack.
- Try out one of the Gloo workshops.
Cleanup
Remove the demo app resources and namespace.
  kubectl delete -f https://raw.githubusercontent.com/cilium/cilium/$CILIUM_VERSION/examples/minikube/http-sw-app.yaml -n starwars
kubectl delete cnp rule1 -n starwars
kubectl delete ns starwars
If you no longer need this quick-start Gloo Network environment, you can uninstall the Gloo management and agent components by following the steps in the uninstall guide.