Overview
Use the Gloo UI to get an at-a-glance view at the configuration, health, and compliance status of your Gloo Network and Cilium components.
About the Gloo UI
The Gloo UI is automatically installed in the Gloo management cluster. Let’s explore some of the key features that you have access to when using the Gloo UI:
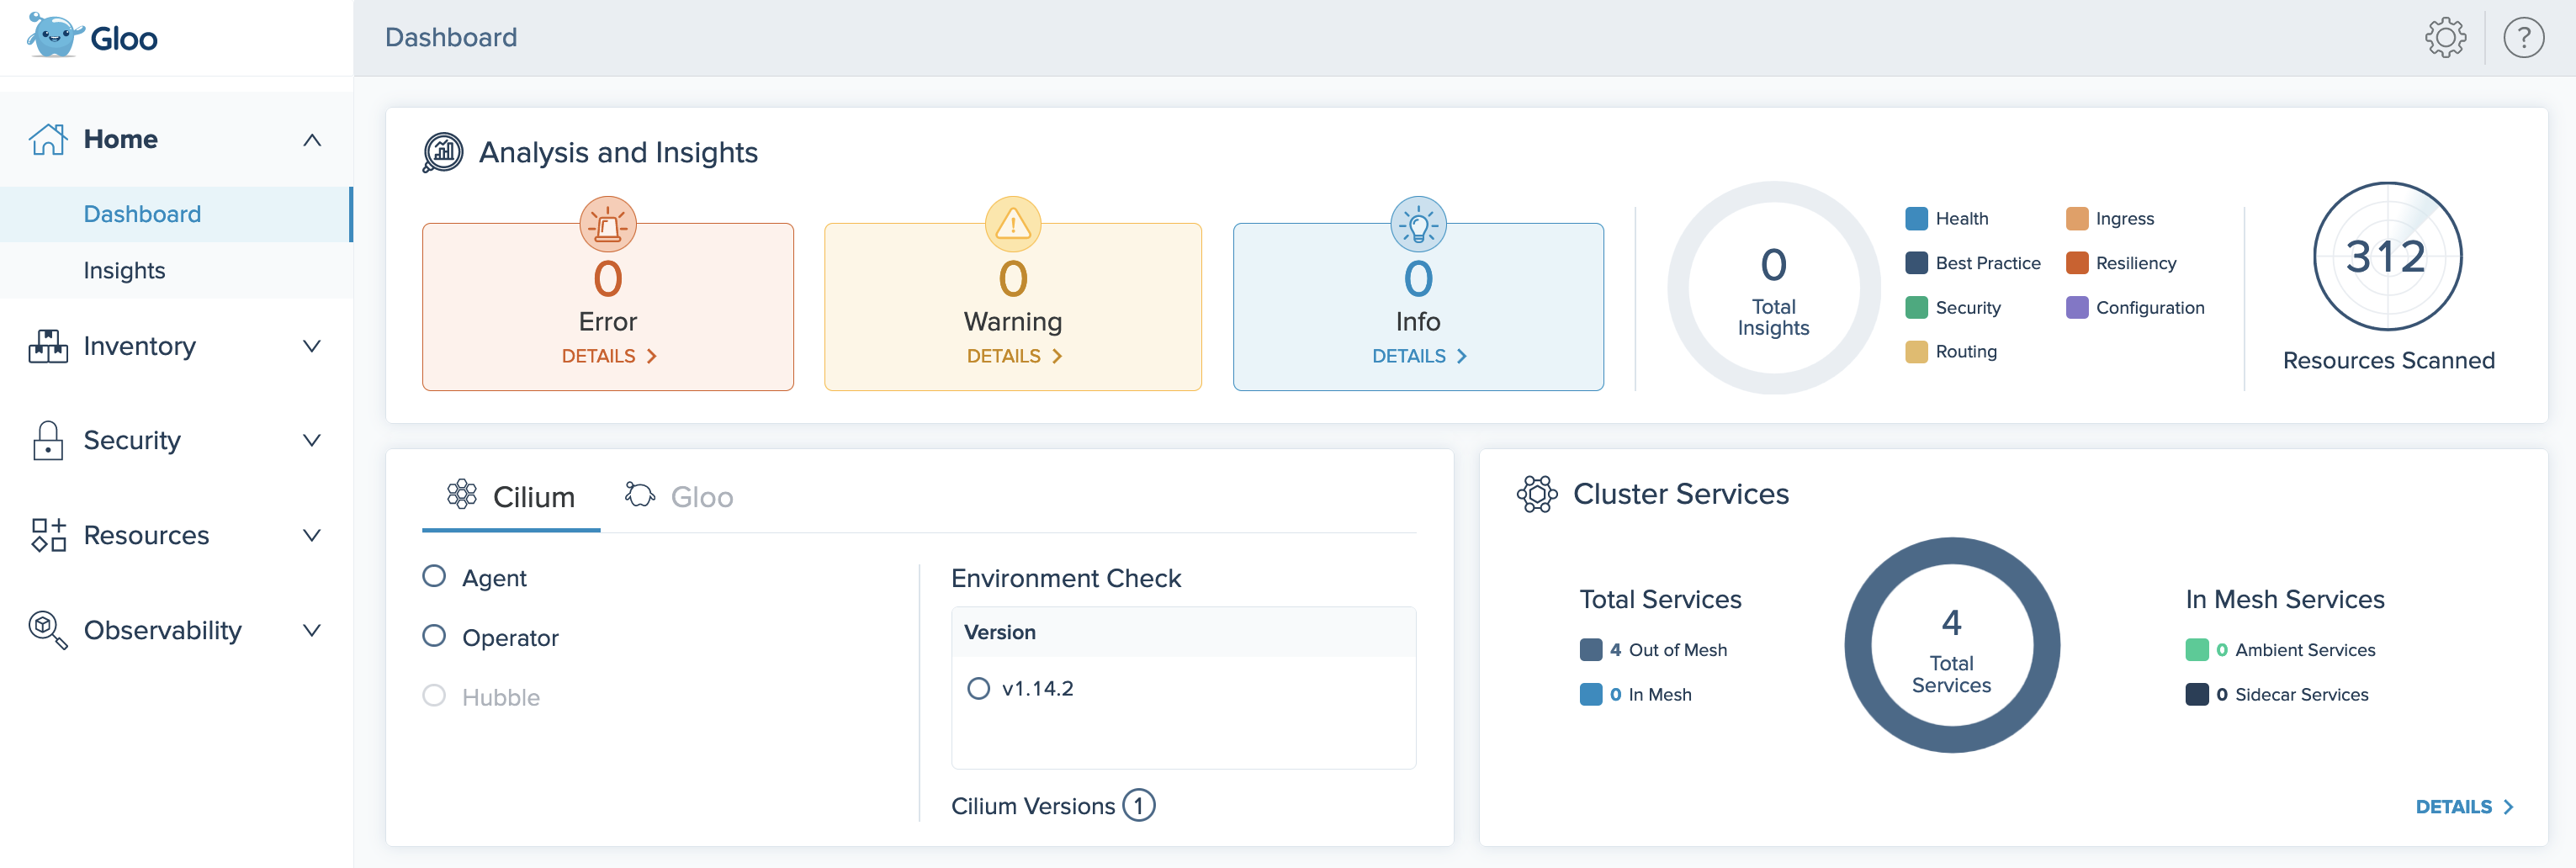
- Gloo Network overview: With the Gloo UI, you can view information about your Gloo Network environment, such as the number of clusters that are registered with the Gloo management server and the Istio version that is deployed to them. You can also review the health of Gloo Network components, such as the Gloo management server and agents by using the Gloo UI log viewer to view and search logs.
- Insights: Gloo Network comes with an insights engine that automatically analyzes your Cilium setup for health issues. Then, Gloo shares these issues along with recommendations to harden your Cilium setup. The insights give you a checklist to address issues that might otherwise be hard to detect across your environment. For more information, see Insights.
- Resource overview: With the Gloo UI, you can view all Istio and Kubernetes resources in one place for all the clusters that you registered with the management server.
- Request traces: When you enable the built-in Jaeger tracing platform, you can embed the Jaeger UI in to the Gloo UI so that you can monitor request traces. You also have the option to embed the UI of a custom Jaeger instance. For more information, see Add Istio request traces.
- Drill into apps and services: Review what services can communicate with other services, the policies that are applied before traffic is sent to a service, and how traffic between services is secured.
- Visualize and monitor metrics: With the built-in Prometheus integration, the Gloo UI has access to workload-specific metrics, such as the number of requests that were received for a workload. This data is visualized in the Gloo UI graph. For more information about the Prometheus integration, see Prometheus.
For a detailed overview of what information you can find in the Gloo UI, see Explore the Gloo UI.
Default access
By default, the Gloo UI is deployed in the gloo-mesh namespace of your management cluster. The deployment is exposed with a ClusterIP service so that no one can access it from outside the cluster. You can review the gloo-mesh-ui resources with the following command.
kubectl get all -A -l app=gloo-mesh-ui
No authentication or authorization is applied by default. Anyone that can access the management cluster can open the Gloo UI and review all of the Gloo custom resources and configurations in your setup.
To control access:
- Give only administrators access to the management cluster.
- Control user access to the Gloo UI service in the management cluster with Kubernetes RBAC.
- Optionally set up an OIDC provider for the Gloo UI.
HTTPS configuration
By default, the Gloo UI is exposed within the cluster only and configured to accept incoming HTTP traffic. To make the Gloo UI accessible to external users, you can expose the Gloo UI by using a public load balancer. Note that while traffic to the load balancer is encrypted, the traffic between the load balancer and the Gloo UI is not encrypted by default. To protect the Gloo UI and its data, it is a common practice to configure the Gloo UI for HTTPS traffic so that all data is secured and encrypted at all times.
Externally exposing the Gloo UI via a load balancer and configuring the Gloo UI to accept only HTTPS traffic provides the following key advantages:
- Data encryption: All data that is exchanged between the client browser and Gloo UI is encrypted. This approach helps to meet regulatory requirements and to protect sensitive information.
- User privacy: All communication between the client and the Gloo UI is private.
- Compliance: Configuring the Gloo UI for HTTPS traffic helps to comply with modern security standards and to provider a better experience to your users by avoiding security warnings in the client browser.
For more information, see Configure the UI for HTTPS.
External authentication
To further protect the Gloo UI from unauthorized users, set up authentication and authorization (AuthN/AuthZ) for the Gloo UI by using OpenID Connect (OIDC) and Kubernetes role-based access control (RBAC). The Gloo UI supports OpenID Connect (OIDC) authentication from common providers such as Google, Okta, and Auth0. For more information, see Set up external auth.
Monitored metrics
The Gloo UI monitors and visualizes the following metrics from the built-in Prometheus server for the workloads in your cluster. You can see and work with these metrics by using the Gloo UI Graph.
hubble_flows_processed_total: For clusters that use the Cilium CNI, the number of network flows that were processed by the Cilium agent are monitored to visualize network traffic between workloads in your cluster.
To learn more about the built-in Prometheus server and the metrics that are available to you, see the Prometheus overview.