Overview
Monitor the health of your Gloo Network for Cilium components by leveraging pre-built Grafana dashboards.
About
Grafana is an open source interactive data-visualization platform that allows you to see data via charts and graphs that are unified into one dashboard.
Cilium dashboard
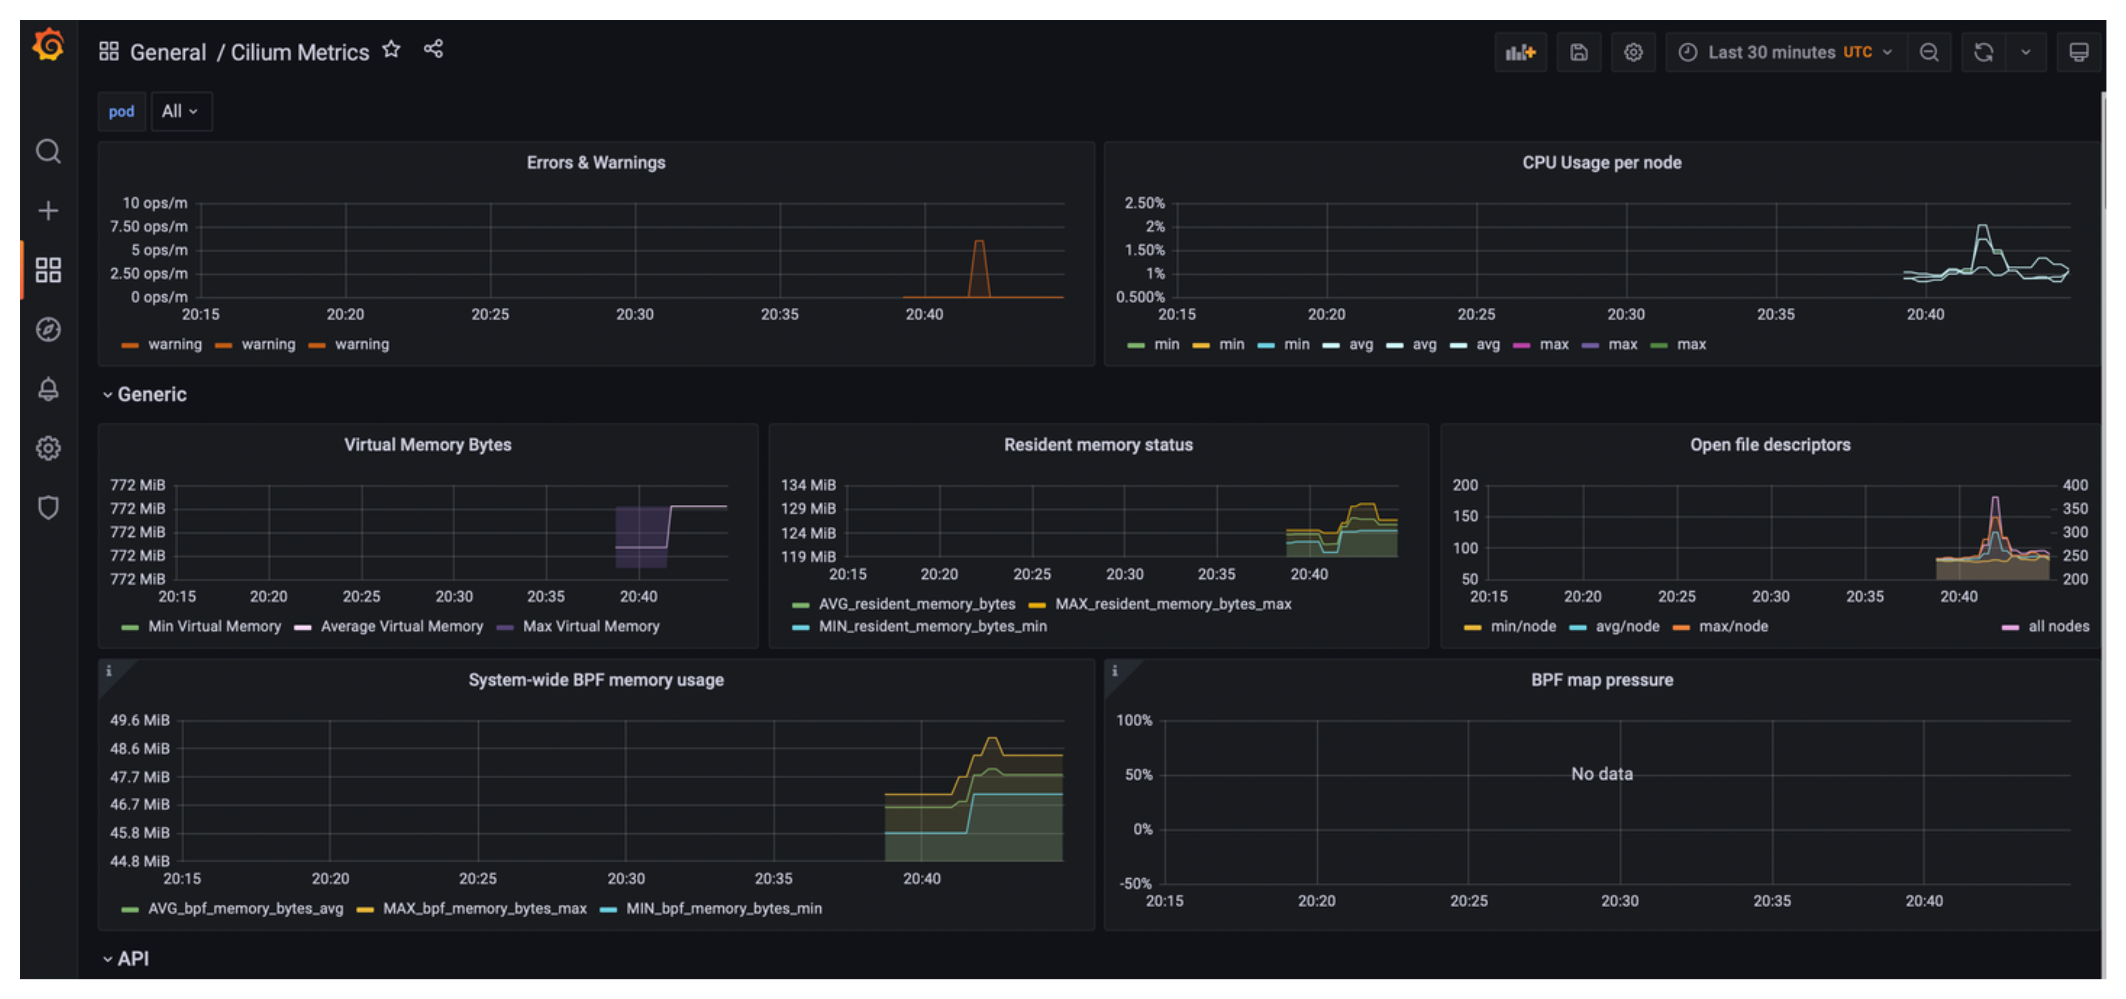
When you add Cilium, Hubble, and eBPF-specific metrics to the Gloo telemetry pipeline, you can import the pre-built Cilium dashboard to Grafana. This dashboard provides the following key features that can help you monitor the health of your Cilium components and the workloads in your cluster:
- Cilium agent and operator resource consumption and latency: Gain insights into the state of the Cilium CNI components, such as the Cilium agent and the Cilium operator. For example, you can monitor the average CPU and memory consumption of the Cilium agent, the number of Cilium API calls, their latency and API return codes.
- Layer 3 BPF metrics: Monitor the system-wide memory consumption of eBPF maps, the number of system calls, their latency, and IP allocation operations.
- Network traffic: Track incoming and outgoing network packets that were successfully processed or dropped for Cilium-managed Kubernetes pods.
- Network policies: Monitor the number of requests that were allowed or prohibited by network policies, and the endpoints that are labeled by policy enforcement status.
- Cilium endpoints: Review the number of endpoints that Cilium monitors and their status.
The Cilium dashboard is not automatically set up when you install Gloo Network. To access the dashboard, you must follow these steps:
The Cilium dashboard offers various graphs and data that provide a full picture of the health of the Cilium CNI and the network traffic in your cluster. To provide and visualize this data, it is recommended to add all Cilium metrics to the Gloo telemetry pipeline. Note that if you customized the Cilium metrics and enabled only certain Cilium metrics, some graphs in the dashboard might remain empty due to missing data.