Insights
Use the Gloo UI to evaluate the health and efficiency of your setup.
Gloo Network comes with an insights engine that automatically analyzes your Cilium setup for health issues. Then, Gloo shares these issues along with recommendations to harden your Cilium setup. The insights give you a checklist to address issues that might otherwise be hard to detect across your environment.
Launch the Gloo UI
To review the Gloo Network analysis of and insights for your setup, launch the Gloo UI.
Open the Gloo UI. The Gloo UI is served from the
gloo-mesh-uiservice on port 8090. You can connect by using themeshctlorkubectlCLIs.- meshctl: For more information, see the CLI documentation.
meshctl dashboard - kubectl:
- Port-forward the
gloo-mesh-uiservice on 8090.kubectl port-forward -n gloo-mesh svc/gloo-mesh-ui 8090:8090 - Open your browser and connect to http://localhost:8090.
- Port-forward the
- meshctl: For more information, see the CLI documentation.
- Review your Dashboard. The dashboard shows an at-a-glance overview of your Gloo environment, including your Cilium setup.
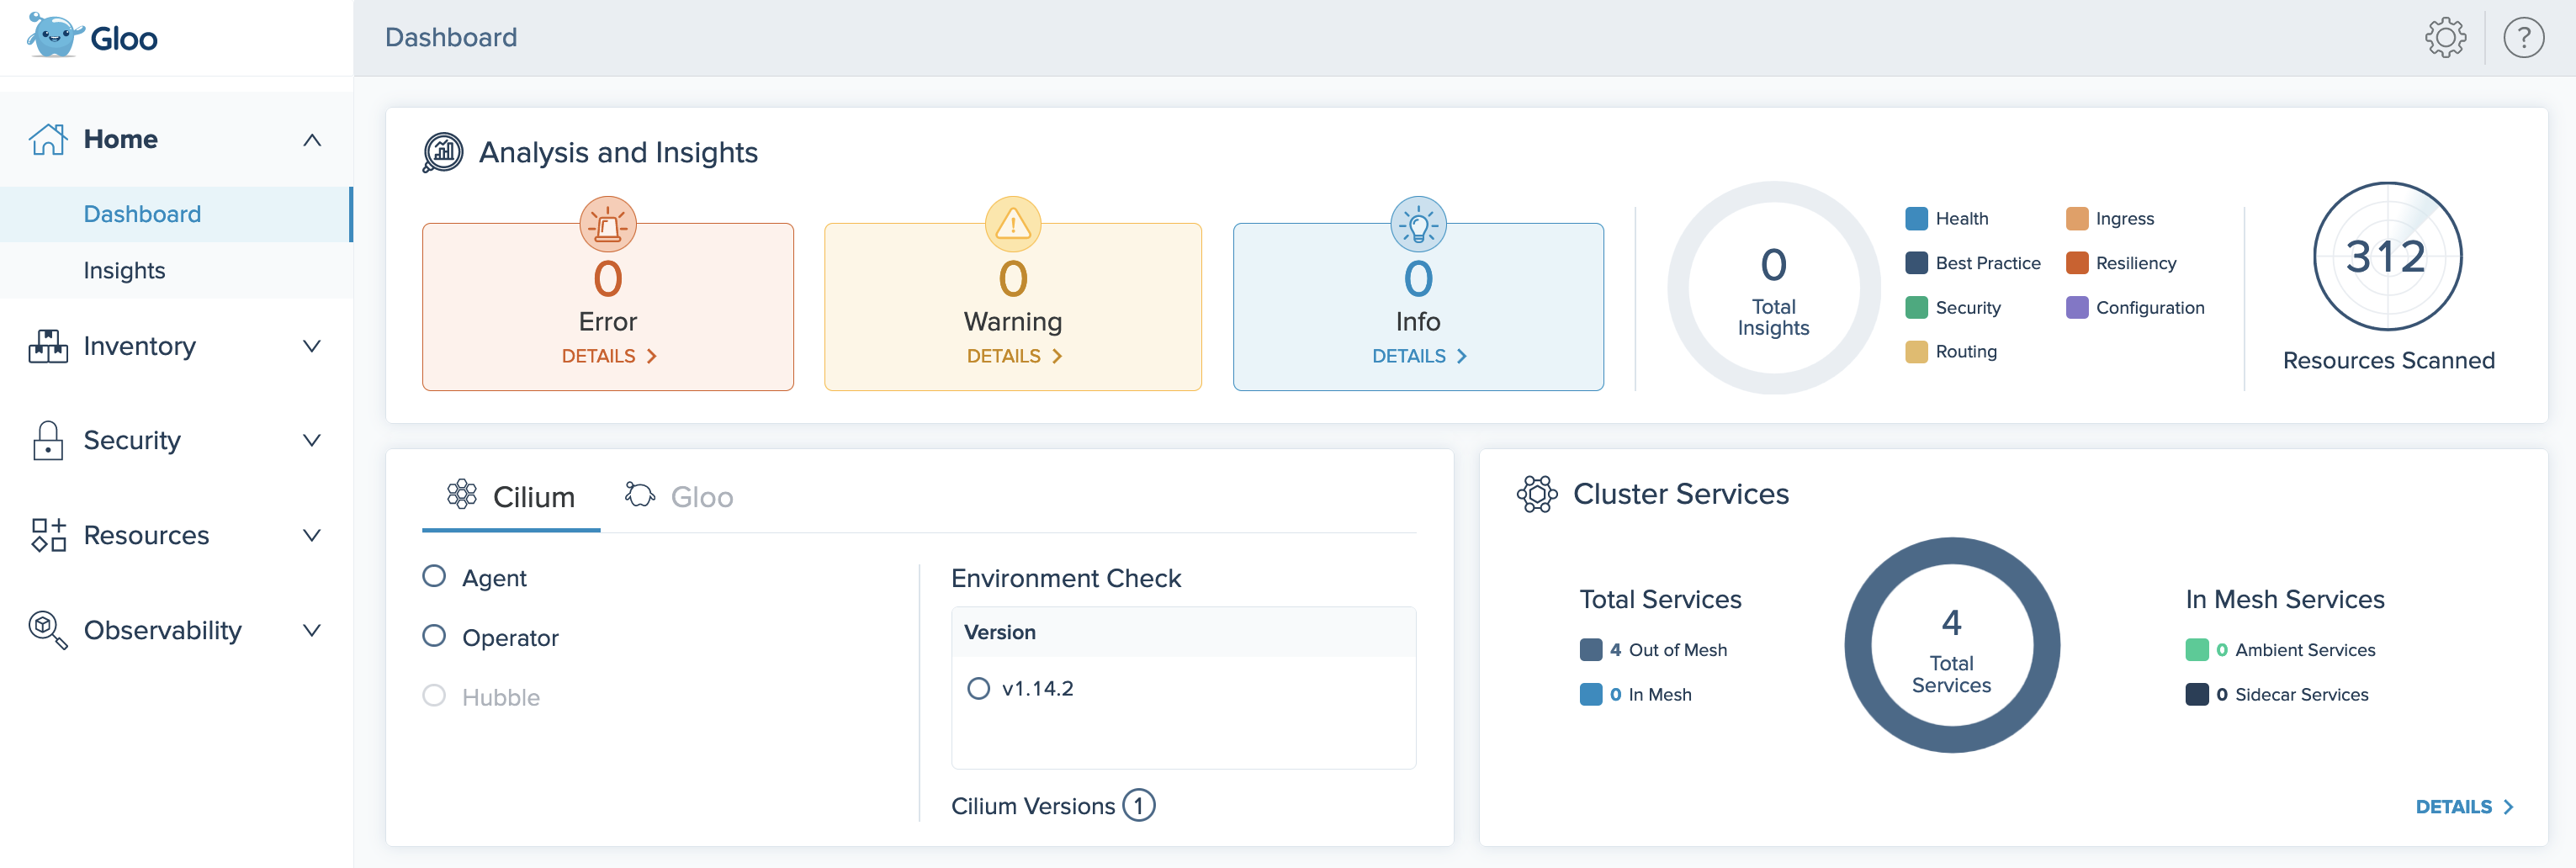
Figure: Gloo UI dashboard
Review installation health and insights
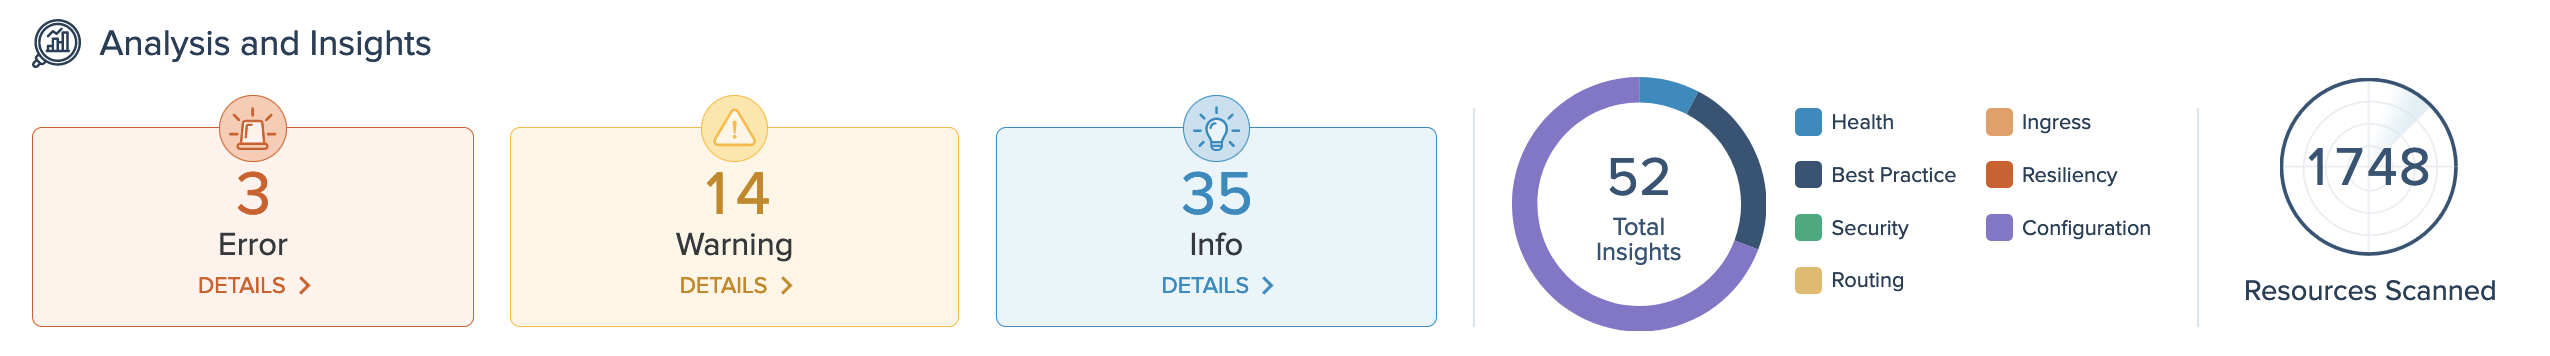
On the Analysis and Insights card of the dashboard, you can quickly see a summary of the insights for your environment, including how many insights are available at each severity level, and the type of insights. To view the list of insights, you can click the Details buttons, or go to the Insights page.
View all insights
On the Insights page, you can view recommendations to harden your Cilium setup, and steps to implement them in your environment. Gloo Network analyzes your setup, and returns individual insights that contain information about errors and warnings in your environment, best practices you can use to improve your configuration and security, and more.
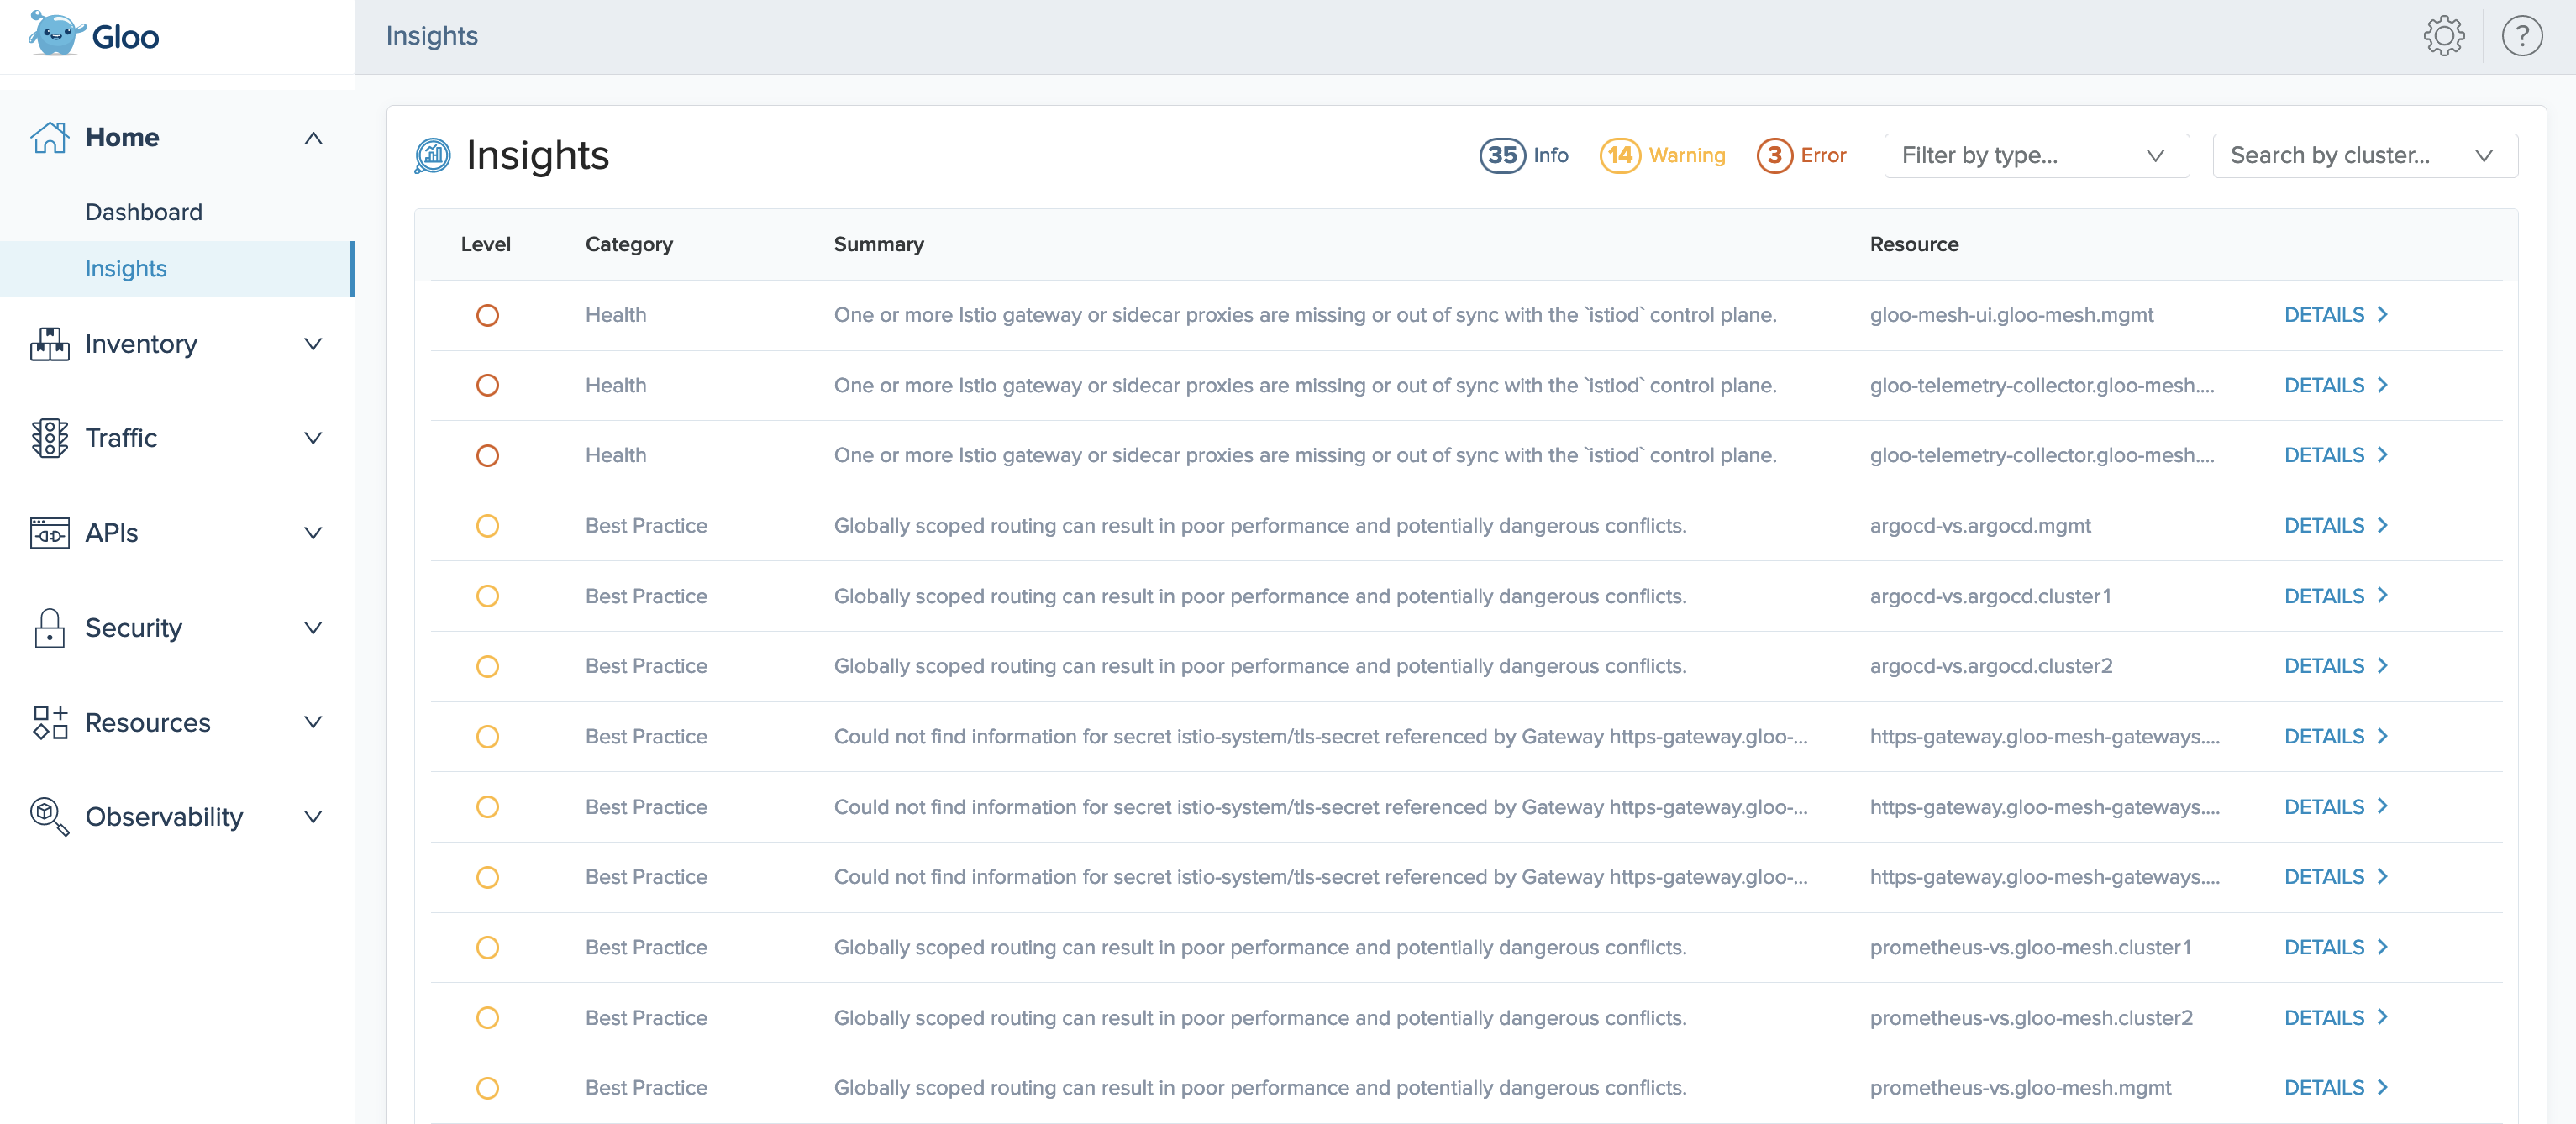
In the list of all insights, each insight has the following attributes:
- Level: The severity level of the insight.
- Info: Informational reports, such as summaries of the current state of resources, or best practice recommendations, such as steps you can take to conform to Istio standards.
- Warning: Potential issues that might affect the functionality of your setup.
- Error: Issues that currently affect the functionality of your setup, and must be resolved.
- Category: The type of the insight.
- Best Practice: Best practice recommendations, such as scoping resources to namespaces.
- Configuration: Configuration of Cilium resources, such as validation checks or recommended fields.
- Health: Health checks and status updates for components of your Cilium installation.
- Security: Security of your Cilium setup.
- Summary: A short description of the insight.
- Resource: The name, namespace, and cluster of the resource that the insight refers to. For example,
argocd-vs.argocd.mgmtrefers to the virtual service namedarcgocd-vsin thearcgocdnamespace of yourmgmtcluster.
You can optionally use the filters to view insights by severity level or category, and the Search by cluster dropdown to filter insights by particular clusters.
You can also get a list of your current insights in the CLI by running the following command. In a multicluster setup, run this command in the management cluster.
kubectl -n gloo-mesh debug -q -i ${pod} --image=curlimages/curl -- curl -s "http://localhost:9090/api/v1/query?query=solo_io_insights" | jq -r '.data.result[].metric.code'
Resolve insights
For detailed information about how to resolve each insight, click Details.
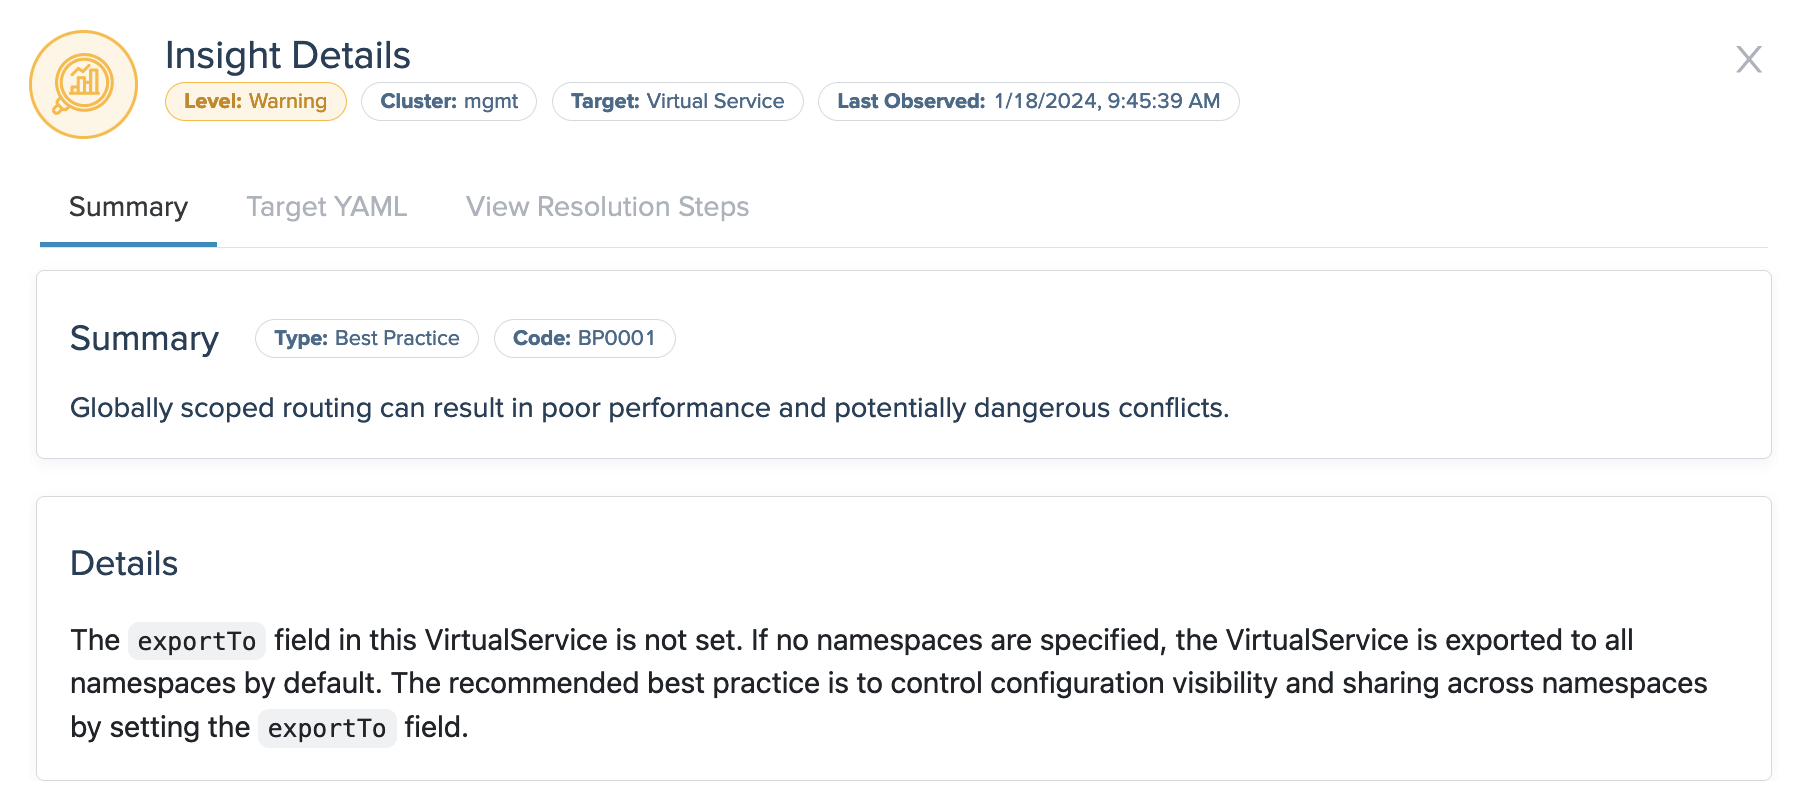
- Summary: The summary tab shows more data about the insight, such as the time when it was last observed in your environment, and details about configuration fields that might need attention. This example insight warns that a virtual service is exported to all namespaces, which is not recommended for security reasons.
- Target YAML: If applicable, the YAML shows the resource file that the insight references, such as a virtual service or gateway.
- View Resolution Steps: If applicable, the resolution tab provides steps that you can take to resolve the insight. For example, you might follow the steps to change specific settings in your Cilium resources. Or, for further functionality and benefits, you might consider upgrading to other Solo products, such as Gloo Mesh Enterprise.
Check overall installation health
The Cilium and Gloo health card of the dashboard provides a check of the Cilium and Gloo Network installations in your clusters.
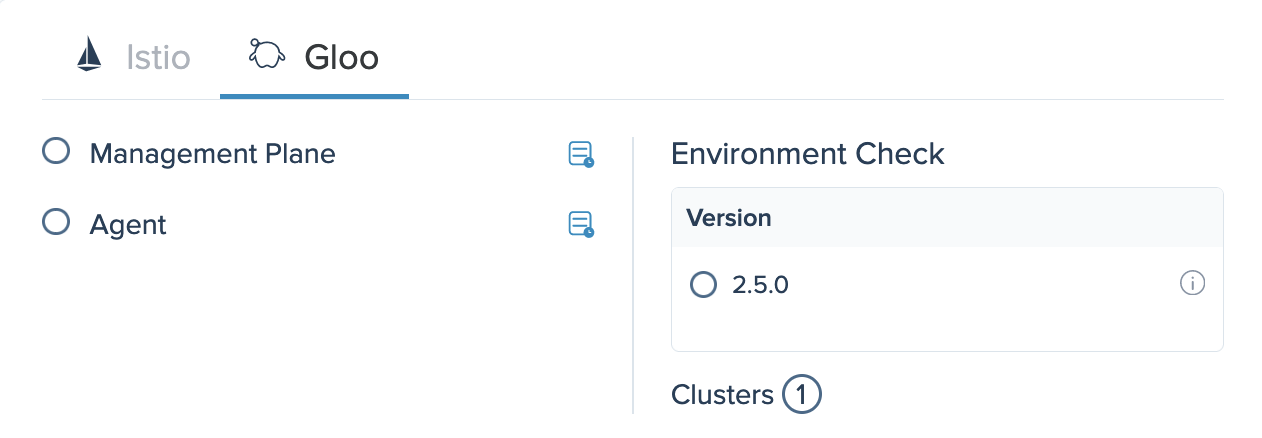
Gloo
The Gloo tab provides an at-a-glance status of the health of each Gloo Network component. You can click the button next to each component to view its pod logs. The environment check shows all versions of Gloo Network that are installed in your environment, the state of each installation, and the number of clusters in your environment.
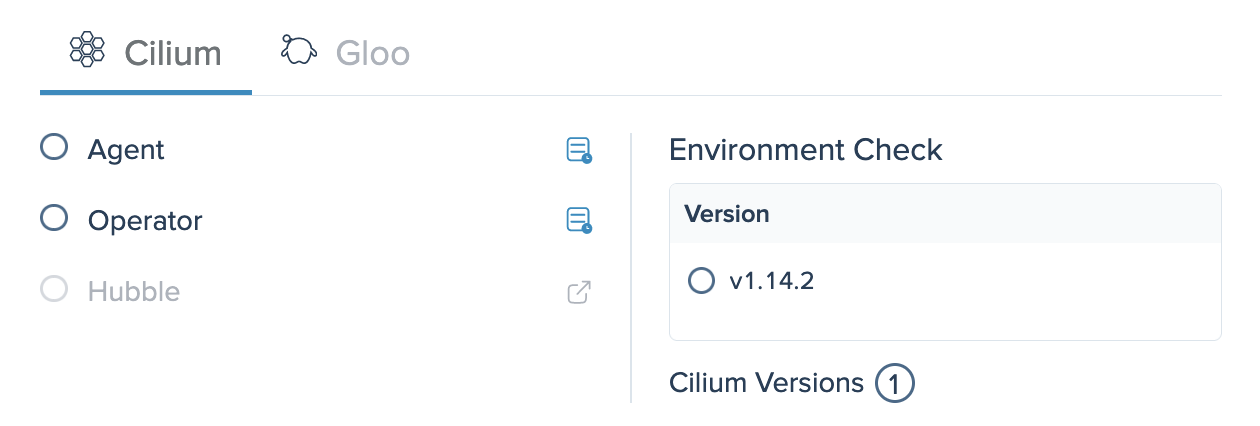
Cilium
The Cilium tab provides an at-a-glance status of the health of each Cilium component. The environment check shows the count and state of all versions of Cilium that are installed in your environment, and can help you identify overall issues with your installations.
Disable insights
As you resolve insights in your environment, you might want to ignore or remove some insights instead of resolving them. For example, an insight that gives a warning for production usage might not be relevant when you try out a new feature in a sandbox Istio environment.
To disable an insight and remove it from your insights list in the Gloo UI:
- Upgrade your Gloo CRDs Helm chart to include the
--set featureGates.insightsConfiguration=trueflag.helm upgrade -i gloo-platform-crds gloo-platform/gloo-platform-crds \ --namespace=gloo-mesh \ --create-namespace \ --version=$GLOO_VERSION \ --set installEnterpriseCrds=false \ --set featureGates.insightsConfiguration=true - Upgrade the Gloo Network Helm chart to include the
--set featureGates.insightsConfiguration=trueflag. Make sure to include your Helm values file, such asgloo-single.yamlin the following example when you upgrade either as a configuration file in the--valuesflag or with--setflags. Otherwise, any previous custom values that you set might be overwritten.helm upgrade -i gloo-platform gloo-platform/gloo-platform \ --namespace=gloo-mesh \ --create-namespace \ --version=$GLOO_VERSION \ -f gloo-single.yaml \ --set featureGates.insightsConfiguration=true Open the Gloo UI. The Gloo UI is served from the
gloo-mesh-uiservice on port 8090. You can connect by using themeshctlorkubectlCLIs.- meshctl: For more information, see the CLI documentation.
meshctl dashboard - kubectl:
- Port-forward the
gloo-mesh-uiservice on 8090.kubectl port-forward -n gloo-mesh svc/gloo-mesh-ui 8090:8090 - Open your browser and connect to http://localhost:8090.
- Port-forward the
- meshctl: For more information, see the CLI documentation.
- From the left-hand navigation, click Home > Insights.
- Find the insight’s code by clicking the insight’s Details, and look for the Code.
- Include the insight’s code in an
InsightsConfigresource. For example, the following resource disables theCFG0002andCFG0003insights.kubectl apply -f - << EOF apiVersion: admin.gloo.solo.io/v2alpha1 kind: InsightsConfig metadata: name: insights-config namespace: gloo-mesh spec: disabledInsights: - CFG0002 - CFG0003 EOF