Customization options
Review options to customize the default Prometheus setup.
Bring your own Prometheus
The built-in Prometheus server is the recommended approach for scraping metrics from Gloo components and feeding them to the Gloo UI Graph to visualize workload communication. When you enable the built-in Prometheus during your installation, it is set up with a custom scraping configuration that ensures that only a minimum set of metrics and metric labels are collected.
However, the Prometheus pod is not set up with persistent storage and metrics are lost when the pod restarts or when the deployment is scaled down. Additionally, you might want to replace the built-in Prometheus server and use your organization’s own Prometheus-compatible solution or time series database that is hardened for production and integrates with other applications that might exist outside the cluster where your API Gateway runs. Review the options that you have for bringing your own Prometheus server.
Replace the built-in Prometheus with your own
If you have an existing Prometheus instance that you want to use in place of the built-in Prometheus server, you configure Gloo Mesh Gateway to disable the built-in Prometheus instance and to use your production Prometheus instance instead. This setup is a reasonable approach if you want to scrape raw Istio metrics to collect them in your production Prometheus instance. However, you cannot control the number of metrics that you collect, or federate and aggregate the metrics before you scrape them with your production Prometheus.
To query the metrics and compute results, you use the compute resources of the cluster where your production Prometheus instance runs. Note that depending on the number and complexity of the queries that you plan to run in your production Prometheus instance, especially if you use the instance to consolidate metrics of other apps as well, your production instance might get overloaded or start to respond more slowly.
To have more granular control over the metrics that you want to collect, it is recommended to set up additional receivers, processors, and exporters in the Gloo telemetry pipeline to make these metrics available to the Gloo telemetry gateway. Then, forward these metrics to the third-party solution or time series database of your choice, such as your production Prometheus or Datadog instance. For more information, see the Prometheus receiver and Prometheus exporter OpenTelemetry documentation.
Run another Prometheus instance alongside the built-in one
You might want to run multiple Prometheus instances in your cluster that each capture metrics for certain components. For example, you might use the built-in Prometheus server in Gloo Mesh Gateway to capture metrics for the Gloo components, and use a different Prometheus server for your own apps’ metrics. While this setup is supported, make sure that you check the scraping configuration for each of your Prometheus instances to prevent metrics from being scraped multiple times.
Remove high cardinality labels at creation time
To reduce the amount of data that is collected, you can modify how Istio metrics are recorded at creation time. With this setup, you can remove any unwanted cardinality labels before metrics are scraped by the built-in or your own custom Prometheus server.
Make sure to only remove labels that you do not need in any of your production queries, alerts, or dashboards. Removing labels from histograms can significantly reduce cardinality and the amount of data that you collect. For example, you might want to keep all the labels, including the high cardinality labels of the istio_request_duration_milliseconds metric to monitor request latency for your workloads. However, collecting the same high cardinality labels in histograms such as istio_request_bytes_bucket or istio_response_byte_bucket might not be important for your environment. After you apply the Envoy filter, high cardinality labels are permanently removed and cannot be recovered later.
Istio 1.18 and later
Use the Istio Telemetry API to customize how metrics are recorded.
Decide on the metrics that you want to remove labels from. To find an overview of the metric selectors that you can modify, see the Istio metric selector reference. You can start by looking at Istio histogram metrics, also referred to as distribution metrics. Histograms show the frequency distribution of data in a certain timeframe. While these metrics provide great insights and detail, they often come with lots of labels that lead to high cardinality. Note that these metric selectors correspond to the list of Istio Prometheus metrics that are collected. For example, the
REQUEST_SIZEselector corresponds to theistio_request_bytesmetric.Decide on the labels that you want to remove from the metrics. For an overview of labels that are collected, see Labels. Note that this page lists the labels with their actual names, which you must specify as underscore-separated names in your Telemetry resource. For example, the “Response Flags” label is specified as
response_flags.Decide which mode of the collected metric that you want to modify. For each metric, the mode that defines how the metric is collected for a workload.
CLIENT_AND_SERVER: Scenarios in which the workload is either the source or destination of the network traffic.CLIENT: Scenarios in which the workload is the source of the network traffic.SERVER: Scenarios in which the workload is the destination of the network traffic.
Configure an Istio Telemetry resource to remove specific labels. For example, this resource removes the
response_flagslabel from theistio_request_bytesPrometheus metric by using theREQUEST_SIZEmetric selector.apiVersion: telemetry.istio.io/v1 kind: Telemetry metadata: name: remove-labels namespace: istio-system spec: metrics: - providers: - name: prometheus overrides: - match: mode: CLIENT_AND_SERVER metric: REQUEST_SIZE tagOverrides: response_flags: operation: REMOVE
Istio 1.17 and earlier
Customize the Envoy filter in the Istio proxy deployment to modify how Istio metrics are recorded at creation time.
Decide which context of the Istio Envoy filter you want to modify. Each Istio release includes an Envoy filter that is named
stats-filter-<istio_version>and that defines how metrics are collected for a workload. Depending on whether you modify the Envoy filter directly or use the Istio Helm chart to configure the filter, you can choose between the following contexts:SIDECAR_INBOUNDorinboundSidecar: Used to collect metrics for traffic that is sent to a destination (reporter=destination).SIDECAR_OUTBOUNDoroutboundSidecar: Used to collect metrics for traffic that leaves a microservice (reporter=source).GATEWAYorgateway: Used to collect metrics for traffic that passes through the ingress gateway.
Decide on the metric labels you want to remove with your custom Envoy filter. To find an overview of metrics that are collected by default, see the Istio documentation. For an overview of labels that are collected, see Labels. You can start by looking at Istio histogram metrics, also referred to as distribution metrics. Histograms show the frequency distribution of data in a certain timeframe. While these metrics provide great insights and detail, they often come with lots of labels that lead to high cardinality.
Configure your Envoy filter to remove specific labels. To apply the same configuration across all of your Istio microservices, modify the filter in the Istio Helm chart. If you want to update the configuration for a particular workload only, you can patch the Envoy filter instead.
To find the name of the metric that you need to use in your filter configuration, see Metrics. Note that you must remove the
istio_prefix from the metric name before you add it to your filter configuration. For example, if you want to customize the request size metric, userequest_bytes. To find an overview of available labels that you can remove, see Labels. Note that this page lists the labels with their actual names and not as the value that you need to provide in the Envoy filter or Helm chart. To find the corresponding label name value, refer to the Istio bootstrap config for your release.- Istio Helm chart: Upgrade your Helm installation and add the Envoy filter configuration.
helm --kube-context=${CLUSTER1} upgrade --install istio ./istio-/manifests/charts/istio-control/istio-discovery -n istio-system --values - <<EOF global: ... meshConfig: ... pilot: ... telemetry: v2: prometheus: configOverride: outboundSidecar: metrics: - name: request_bytes tags_to_remove: - destination_service - response_flags - name: response_bytes tags_to_remove: - destination_service - response_flags inboundSidecar: disable_host_header_fallback: true metrics: - name: request_bytes tags_to_remove: - destination_service - response_flags - name: response_bytes tags_to_remove: - destination_service - response_flags gateway: disable_host_header_fallback: true metrics: - name: request_bytes tags_to_remove: - destination_service - response_flags - name: response_bytes tags_to_remove: - destination_service - response_flags EOF - Manually patch Envoy config: In the following example, the Envoy filter for the productpage service from the Istio Bookinfo app is modified. All other workloads in the cluster continue to use the default Istio Envoy configuration. Note that this example is specific to Istio version 1.14. If you use a different Istio version, refer to the Istio Envoy documentation.
  apiVersion: networking.istio.io/v1alpha3
kind: EnvoyFilter
metadata:
  name: stats-filter-1.14-productpage
  namespace: bookinfo-frontends
spec:
  workloadSelector:
    labels:
      app: productpage
      version: v1
  configPatches:
  - applyTo: HTTP_FILTER
    match:
      context: SIDECAR_OUTBOUND
      listener:
        filterChain:
          filter:
            name: envoy.filters.network.http_connection_manager
            subFilter:
              name: envoy.filters.http.router
      proxy:
        proxyVersion: ^1\.14.*
    patch:
      operation: INSERT_BEFORE
      value:
        name: istio.stats
        typed_config:
          '@type': type.googleapis.com/udpa.type.v1.TypedStruct
          type_url: type.googleapis.com/envoy.extensions.filters.http.wasm.v3.Wasm
          value:
            config:
              configuration:
                '@type': type.googleapis.com/google.protobuf.StringValue
                value: |
                  {"metrics":[{"name":"request_bytes","tags_to_remove":["destination_service","response_flags"]},{"name":"response_bytes","tags_to_remove":["destination_service","response_flags"]}]}
              root_id: stats_outbound
              vm_config:
                code:
                  local:
                    inline_string: envoy.wasm.stats
                runtime: envoy.wasm.runtime.null
                vm_id: stats_outbound
  - applyTo: HTTP_FILTER
    match:
      context: SIDECAR_INBOUND
      listener:
        filterChain:
          filter:
            name: envoy.filters.network.http_connection_manager
            subFilter:
              name: envoy.filters.http.router
      proxy:
        proxyVersion: ^1\.14.*
    patch:
      operation: INSERT_BEFORE
      value:
        name: istio.stats
        typed_config:
          '@type': type.googleapis.com/udpa.type.v1.TypedStruct
          type_url: type.googleapis.com/envoy.extensions.filters.http.wasm.v3.Wasm
          value:
            config:
              configuration:
                '@type': type.googleapis.com/google.protobuf.StringValue
                value: |
                  {"disable_host_header_fallback":true,"metrics":[{"name":"request_bytes","tags_to_remove":["destination_service","response_flags"]},{"name":"response_bytes","tags_to_remove":["destination_service","response_flags"]}]}
              root_id: stats_inbound
              vm_config:
                code:
                  local:
                    inline_string: envoy.wasm.stats
                runtime: envoy.wasm.runtime.null
                vm_id: stats_inbound
- Istio Helm chart: Upgrade your Helm installation and add the Envoy filter configuration.
Recommended: Federate metrics with recording rules and provide them to your production monitoring instance
In this setup, you inject recording rules in to the built-in Prometheus server to federate the metrics that you want and reduce high cardinality labels. Then, you set up another Prometheus instance in the Gloo management cluster to scrape the federated metrics. You can optionally forward the federated metrics to a Prometheus-compatible solution or a time series database that sits outside of your Gloo management cluster and is hardened for production.
Get the configuration of the built-in Prometheus server in Gloo and save it to a local file on your machine.
kubectl get configmap prometheus-server -n gloo-mesh -o yaml > config.yamlReview the metrics that are sent to the built-in Prometheus server by default.
- Open the Prometheus dashboard.
meshctl:
meshctl proxy prometheuskubectl:
kubectl -n gloo-mesh port-forward deploy/prometheus-server 9091
- Open your browser and connect to localhost:9091/.
- Decide on the subset of metrics that you want to federate.
- Open the Prometheus dashboard.
Add a recording rule to the configmap of your Gloo Prometheus instance that you retrieved earlier to define how you want to aggregate the metrics. Recording rules let you precompute frequently needed or computationally expensive expressions. For example, you can remove high cardinality labels and federate only the labels that you need in future dashboards or alert queries. The results are saved in a new set of time series that you can later scrape or send to an external monitoring instance that is hardened for production. With this setup, you can protect your production instance as you send only the metrics that you need. In addition, you use the compute resources in the Gloo management cluster to prepare and aggregate the metrics.
In this example, you use the
istio_requests_totalmetric to record the total number of requests that Gloo Mesh Gateway receives. As part of this aggregation, pod labels are removed as they might lead to cardinality issues in certain environments. The result is saved as theworkload:istio_requests_totalmetric to make sure that you can distinguish the originalistio_requests_totalmetric from the aggregated one.apiVersion: v1 data: alerting_rules.yml: | {} alerts: | {} prometheus.yml: | ... recording_rules.yml: | groups: - name: istio.workload.istio_requests_total interval: 10s rules: - record: workload:istio_requests_total expr: | sum(istio_requests_total{source_workload="istio-ingressgateway"}) by ( source_workload, source_workload_namespace, destination_service, source_app, destination_app, destination_workload, destination_workload_namespace, response_code, response_flags, reporter ) rules: | {} kind: ConfigMap ...Deploy another Prometheus instance in the Gloo management cluster to scrape the federated metrics from the Prometheus instance.
- Create the
monitoringnamespace in the Gloo management cluster.kubectl create namespace monitoring - Add the Prometheus community Helm repository.
helm repo add prometheus-community https://prometheus-community.github.io/helm-charts - Install the Prometheus community chart.
helm install kube-prometheus-stack prometheus-community/kube-prometheus-stack --version 30.0.1 -f values.yaml -n monitoring --debug - Verify that the Prometheus pods are running.
kubectl get pods -n monitoring
- Create the
Add a service monitor to the Prometheus instance that you just created to scrape the aggregated metrics from the built-in Prometheus instance in Gloo and to expose them on the
/federateendpoint.In the following example, metrics from the built-in Prometheus instance that match the
'workload:(.*)'regex expression are scraped. With the recording rule that you defined earlier,workload:istio_requests_totalis the only metric that matches this criteria. The service monitor configuration also removesworkload:from the metric name so that it is displayed as theistio_requests_totalmetric in Prometheus queries. To access the aggregated metrics that you scraped, you send a request to the/federateendpoint and providematch[]={__name__=<metric>}as a request parameter.apiVersion: monitoring.coreos.com/v1 kind: ServiceMonitor metadata: name: gloo-metrics-federation namespace: monitoring labels: app.kubernetes.io/name: gloo-prometheus spec: namespaceSelector: matchNames: - gloo-mesh selector: matchLabels: app: prometheus endpoints: - interval: 30s scrapeTimeout: 30s params: 'match[]': - '{__name__=~"workload:(.*)"}' path: /federate targetPort: 9090 honorLabels: true metricRelabelings: - sourceLabels: ["__name__"] regex: 'workload:(.*)' targetLabel: "__name__" action: replaceAccess the
/federateendpoint to see the scraped metrics. Note that you must include thematch[]={__name__=<metric>}request parameter to successfully see the aggregated metrics.Port forward the Prometheus service so that you can access the Prometheus UI on your local machine.
kubectl port-forward service/kube-prometheus-stack-prometheus -n monitoring 9090Open the targets that are configured for your Prometheus instance.
open https://localhost:9090/targetsSelect the
gloo-metrics-federationtarget that you configured and verify that the endpoint address and match condition are correct, and that theStatedisplays as UP.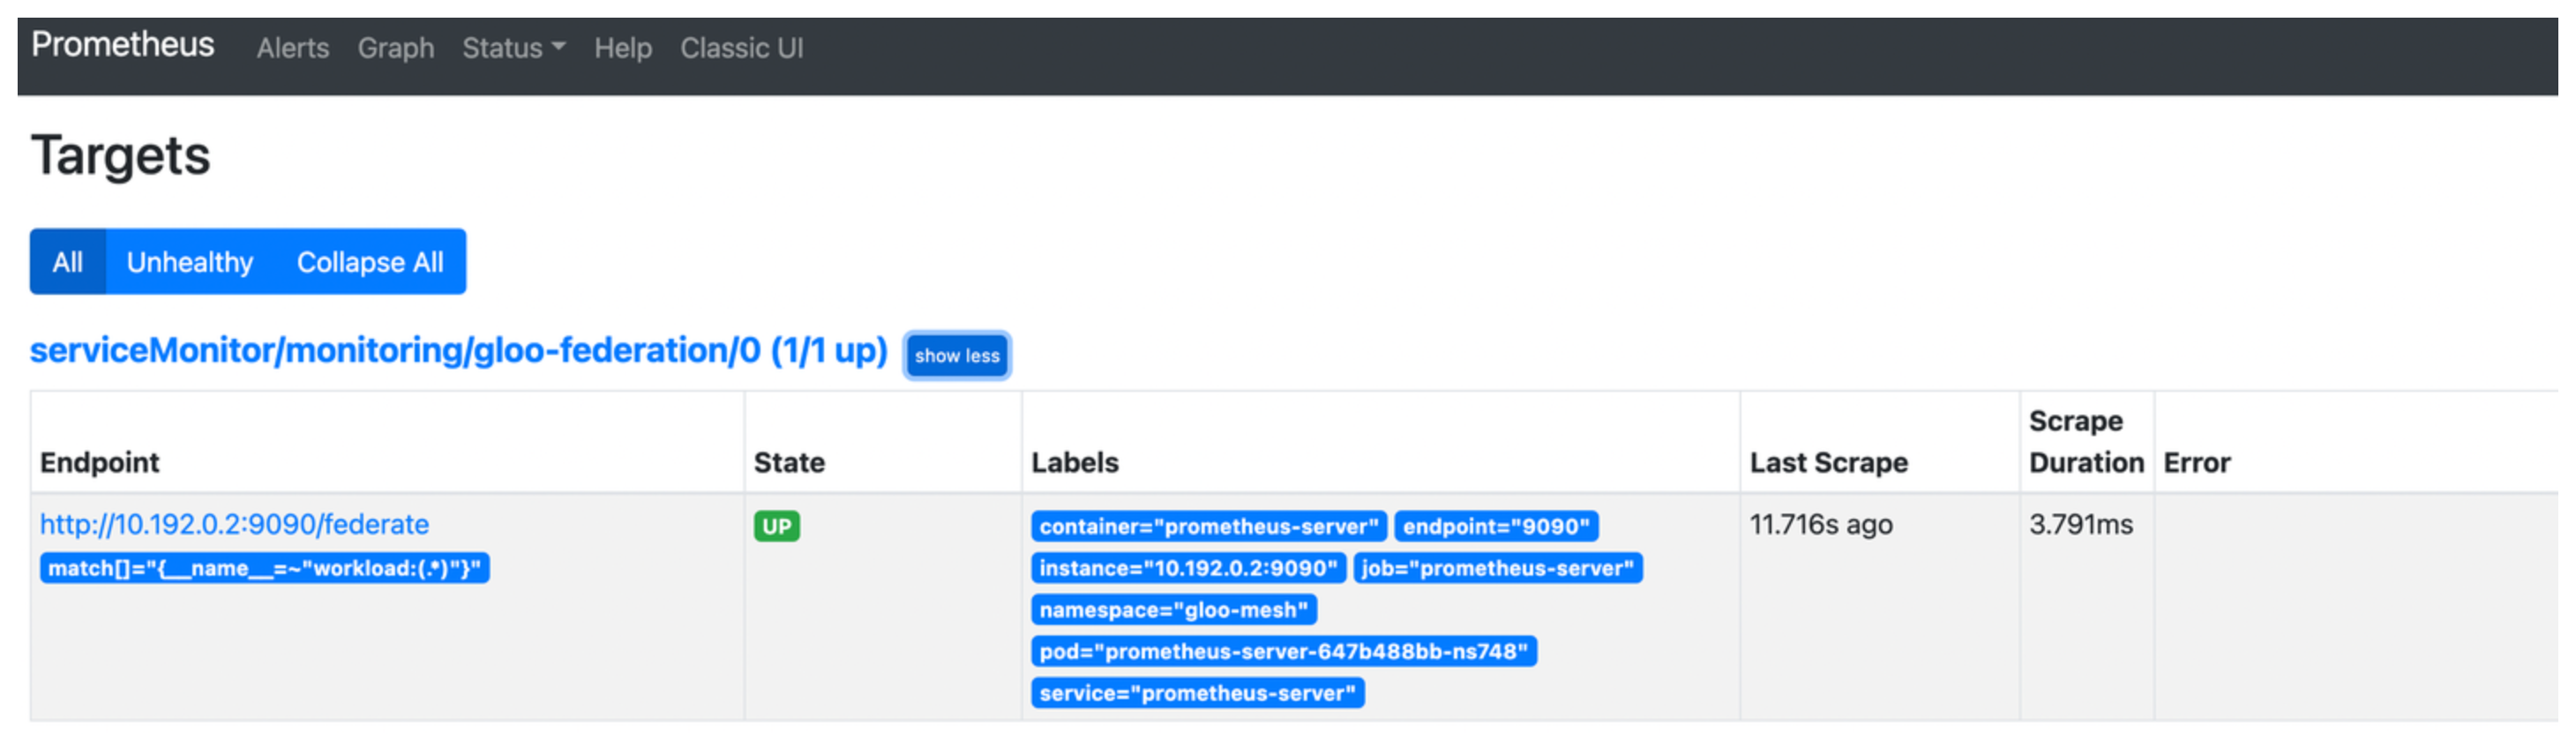
Optional: Access the aggregated metrics on the
/federateendpoint.open https://localhost:9090/federate?match[]={__name__="istio_requests_total"}Example output:
  # TYPE istio_requests_total untyped
istio_requests_total{container="prometheus-server",destination_app="ratings",destination_service="ratings.bookinfo.svc.cluster.local",destination_workload="ratings-v1",destination_workload_namespace="bookinfo",endpoint="9090",job="prometheus-server",namespace="gloo-mesh",pod="prometheus-server-647b488bb-ns748",reporter="destination",response_code="200",response_flags="-",service="prometheus-server",source_app="istio-ingressgateway",source_workload="istioingressgateway",source_workload_namespace="istio-system",instance="",prometheus="monitoring/kube-prometheus-stack-prometheus",prometheus_replica="prometheus-kube-prometheus-stack-prometheus-0"} 11 1654888576995
istio_requests_total{container="prometheus-server",destination_app="ratings",destination_service="ratings.bookinfo.svc.cluster.local",destination_workload="ratings-v1",destination_workload_namespace="bookinfo",endpoint="9090",job="prometheus-server",namespace="gloo-mesh",pod="prometheus-server-647b488bb-ns748",reporter="source",response_code="200",response_flags="-",service="prometheus-server",source_app="istio-ingressgateway",source_workload="istio-ingressgateway",source_workload_namespace="istio-system",instance="",prometheus="monitoring/kube-prometheus-stack-prometheus",prometheus_replica="prometheus-kube-prometheus-stack-prometheus-0"} 11 1654888576995
Forward the federated metrics to your external Prometheus-compatible solution or time series database that is hardened for production. Refer to the Prometheus documentation to explore your forwarding options or try out the Prometheus agent mode.