Istio insights
Use the Gloo UI to evaluate the health and efficiency of your service mesh.
Gloo Mesh Enterprise comes with an insights engine that automatically analyzes your Istio setups for health issues. Then, Gloo shares these issues along with recommendations to harden your Istio setups. The insights give you a checklist to address issues that might otherwise be hard to detect across your environment.
Enable insights
In version 2.6.0 and later, you must enable insights generation by including the --set glooInsightsEngine.enabled=true setting in your management cluster and the --set glooAnalyzer.enabled=true setting in each workload cluster when you upgrade your Gloo Mesh Enterprise installation.
Note that in large-scale environments, allotting the following additional resources to the engine and analyzer components is recommended. These resources are in addition to the recommended baseline resources for installing Gloo Mesh Enterprise.
| Component | CPU (vCPU) | Memory (GB) |
|---|---|---|
| Management server | 1 | 1 |
| Insights engine | 2 | 2 |
| Agent | 1 | 1 |
| Analyzer | 1 | 1 |
Additionally, consider deploying a dedicated Redis instance to store insights data, which is recommended to separate observability data from the snapshot data that the Redis instance for your management server stores. You can enable a Gloo-managed Redis instance for the insights engine by including the --set redisStore.insights.deployment.enabled=true setting in your management cluster when you upgrade your Gloo Mesh Enterprise installation. For a more secure setup, you can instead bring your own Redis instance, and use the --set redisStore.insights.client.address=<external_redis_address> setting to point to the external address of your Redis instance. For more information, see Backing databases.
Launch the Gloo UI
To review the Gloo Mesh Enterprise analysis of and insights for your setup, launch the Gloo UI.
Open the Gloo UI. The Gloo UI is served from the
gloo-mesh-uiservice on port 8090. You can connect by using themeshctlorkubectlCLIs.- meshctl: For more information, see the CLI documentation.
meshctl dashboard - kubectl:
- Port-forward the
gloo-mesh-uiservice on 8090.kubectl port-forward -n gloo-mesh svc/gloo-mesh-ui 8090:8090 - Open your browser and connect to http://localhost:8090.
- Port-forward the
- meshctl: For more information, see the CLI documentation.
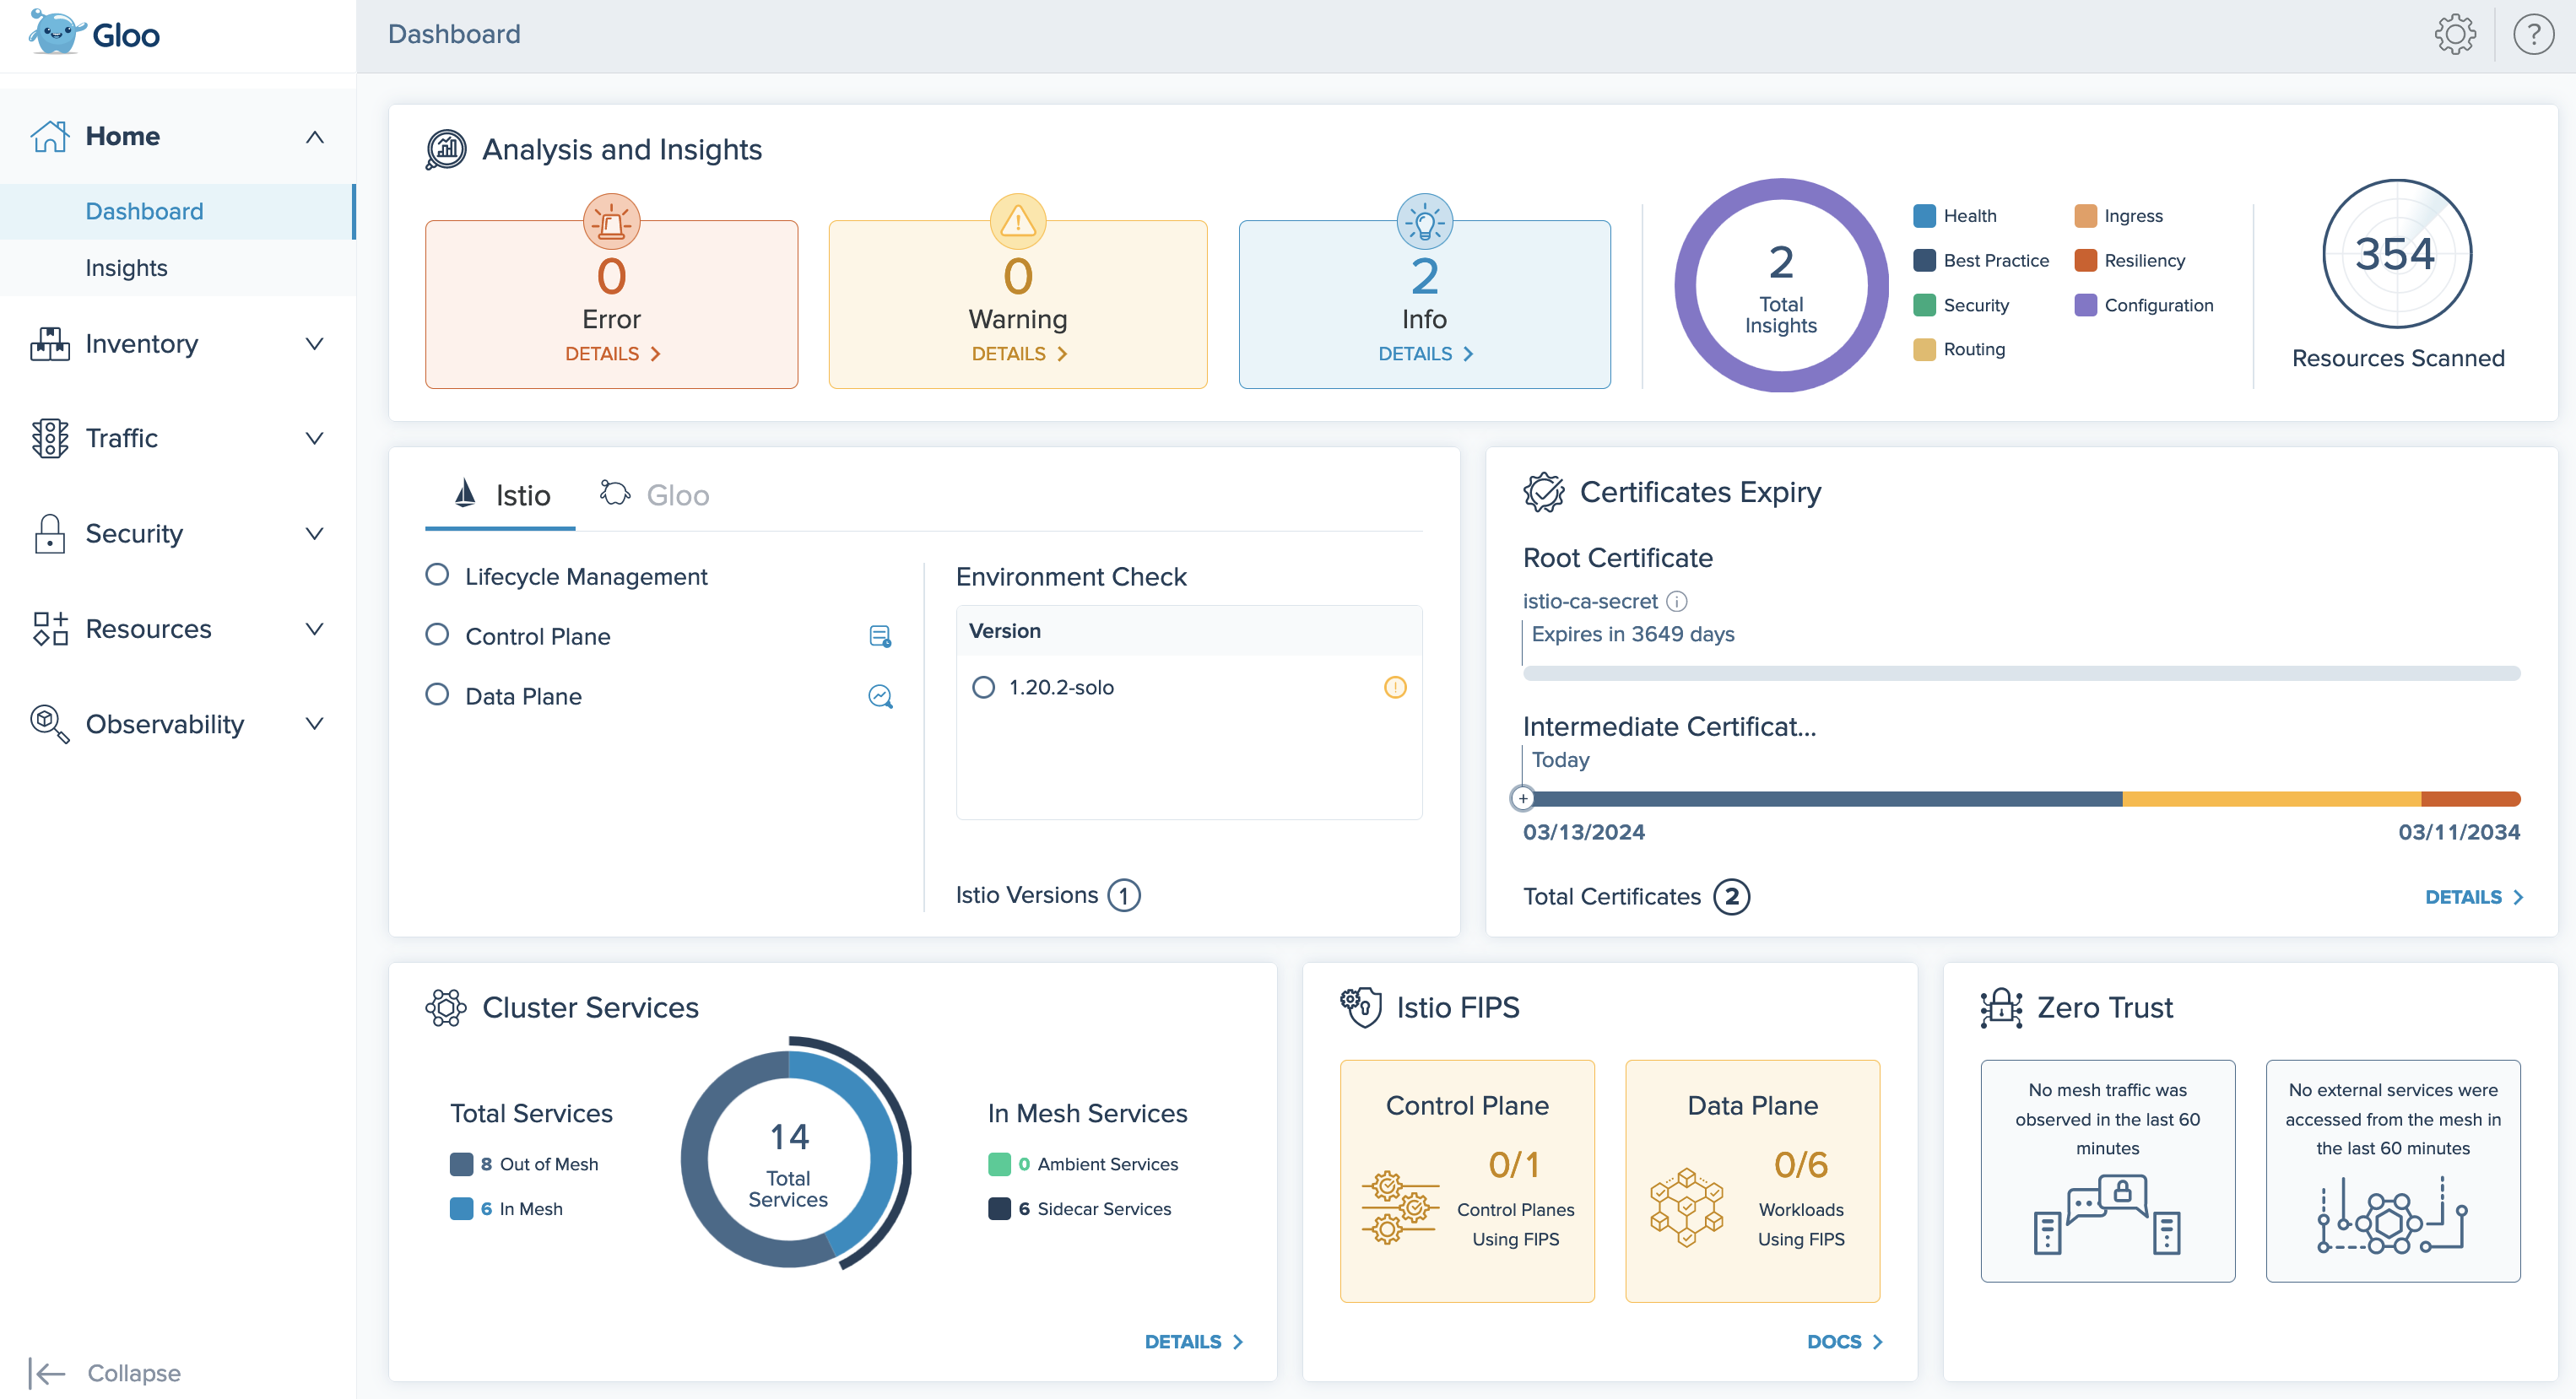
- Review your Dashboard. The dashboard shows an at-a-glance overview of your Gloo environment, including your Istio setups.
Review installation health and insights
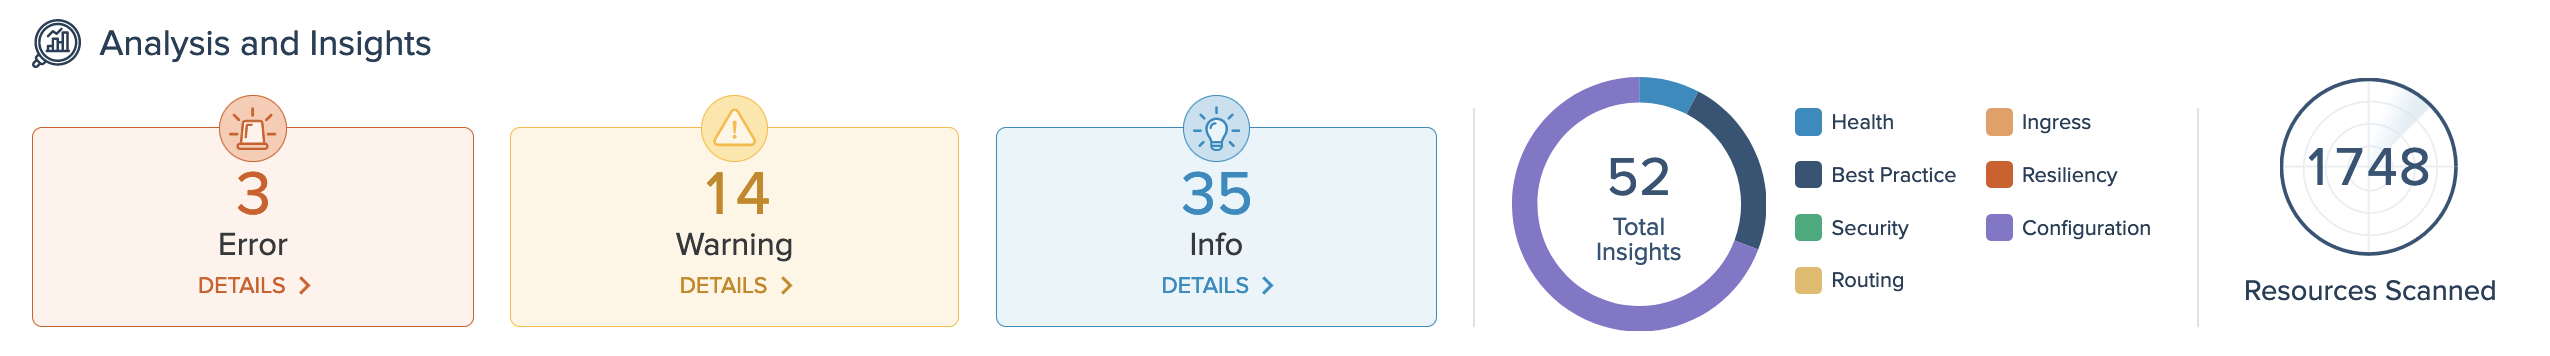
On the Analysis and Insights card of the dashboard, you can quickly see a summary of the insights for your environment, including how many insights are available at each severity level, and the type of insights. To view the list of insights, you can click the Details buttons, or go to the Insights page.
View all insights
On the Insights page, you can view recommendations to harden your Istio setups, and steps to implement them in your environment. Gloo Mesh Enterprise analyzes your setup, and returns individual insights that contain information about errors and warnings in your environment, best practices you can use to improve your configuration and security, and more.
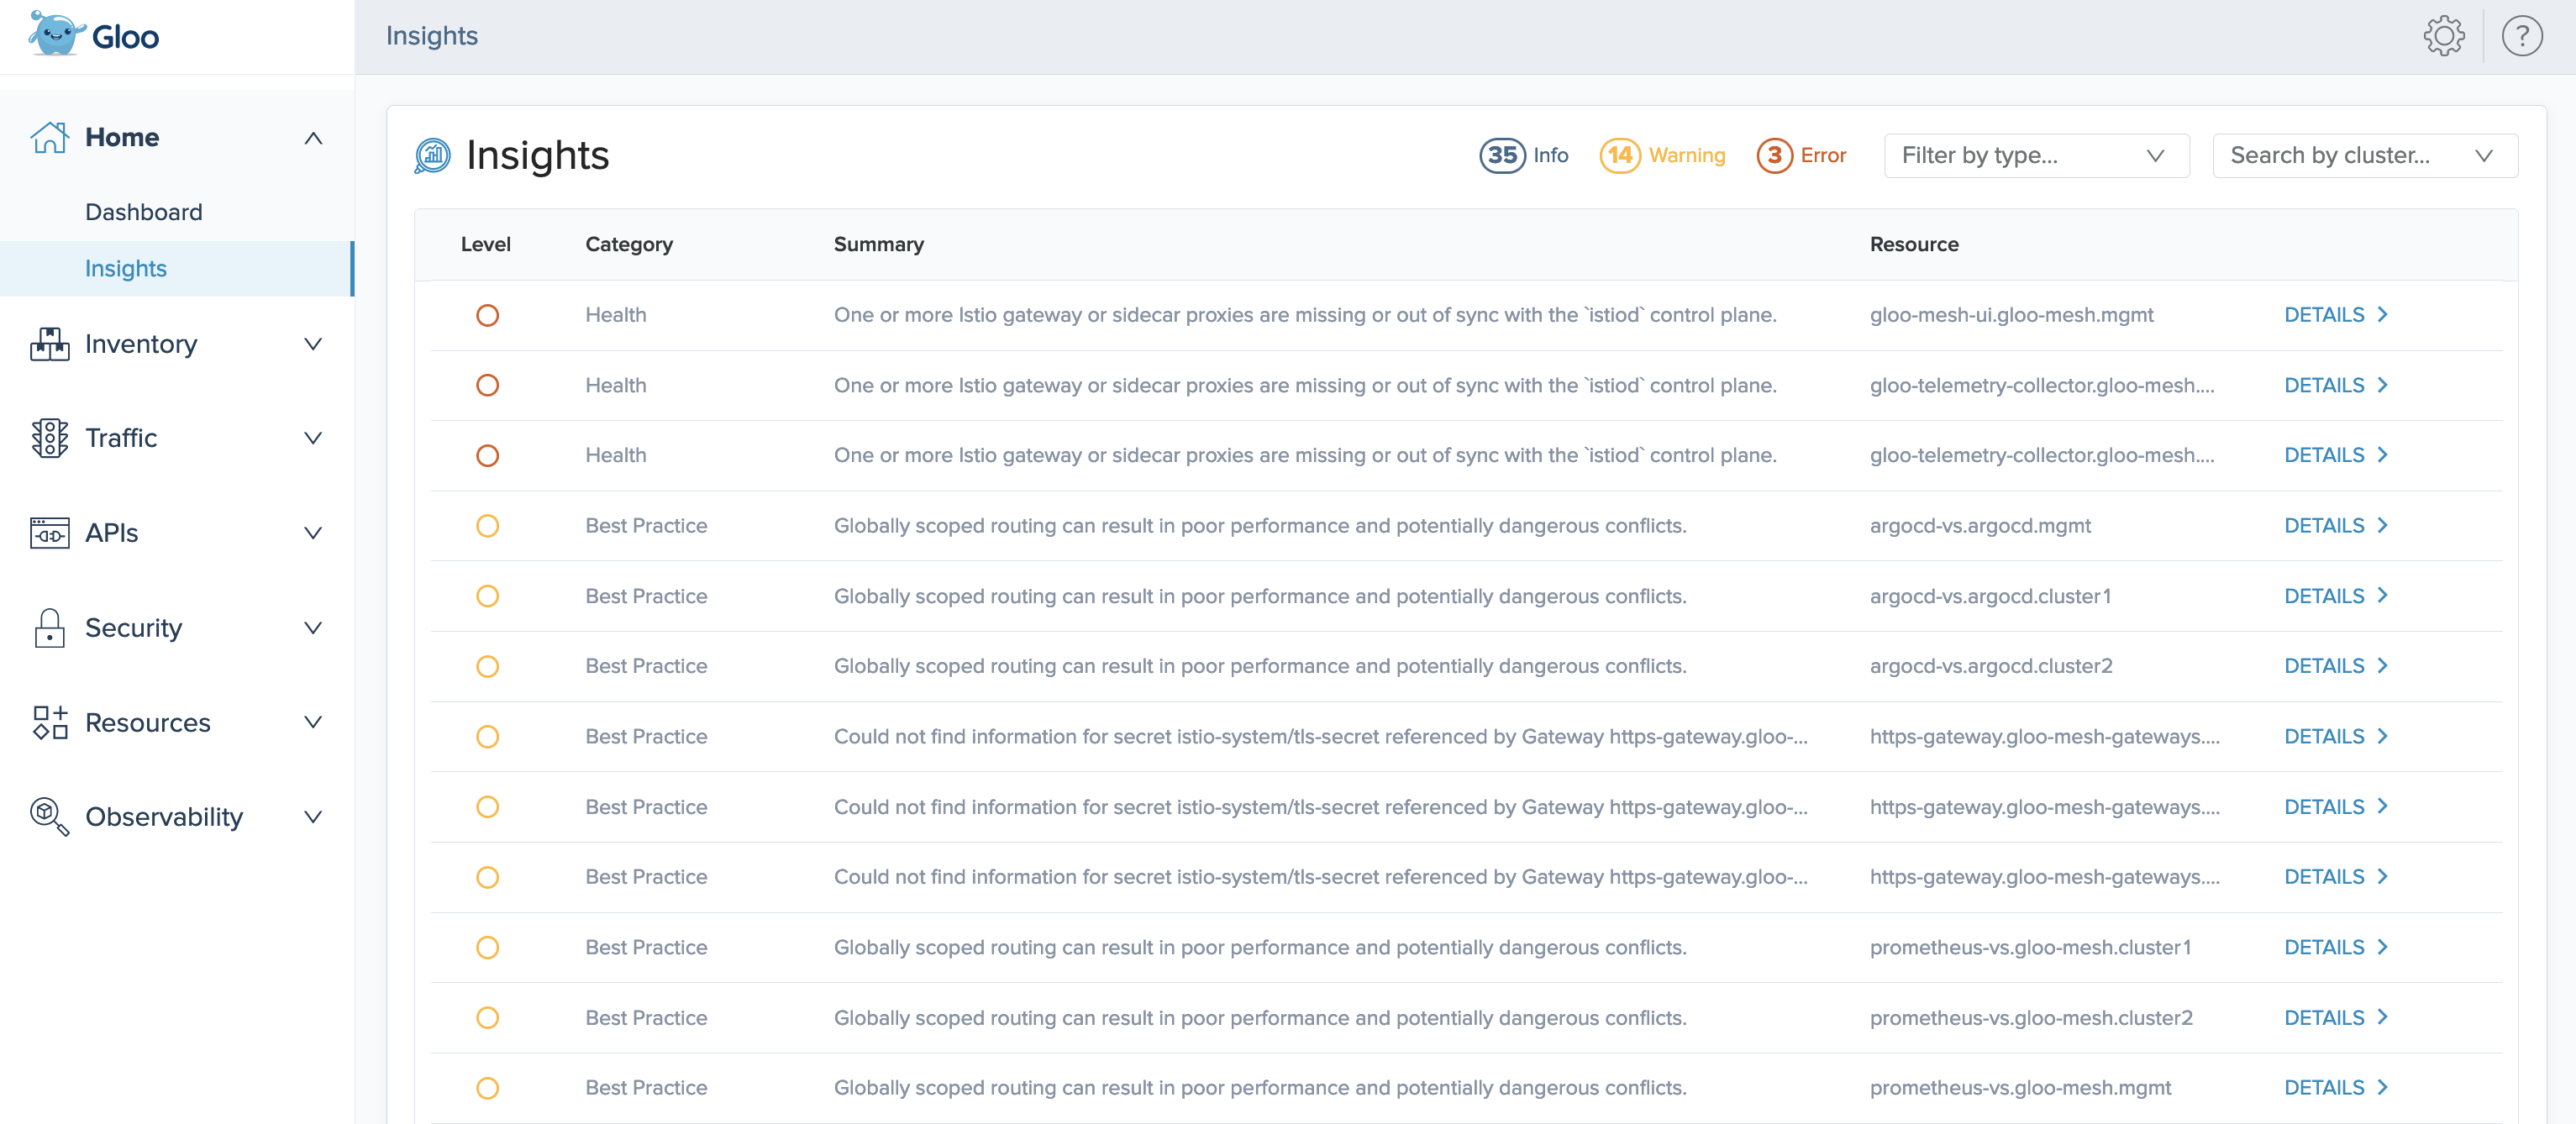
In the list of all insights, each insight has the following attributes:
- Level: The severity level of the insight.
- Info: Informational reports, such as summaries of the current state of resources, or best practice recommendations, such as steps you can take to conform to Istio standards.
- Warning: Potential issues that might affect the functionality of your setup.
- Error: Issues that currently affect the functionality of your setup, and must be resolved.
- Category: The type of the insight.
- Best Practice: Best practice recommendations, such as scoping resources to namespaces.
- Configuration: Configuration of Istio resources, such as validation checks or recommended fields.
- Health: Health checks and status updates for components of your Istio installation.
- Security: Security of your service mesh setups, such as recommended steps to harden your Istio certificate setup.
- Summary: A short description of the insight.
- Resource: The name, namespace, and cluster of the resource that the insight refers to. For example,
argocd-vs.argocd.mgmtrefers to the virtual service namedarcgocd-vsin thearcgocdnamespace of yourmgmtcluster.
You can optionally use the filters to view insights by severity level or category, and the Search by cluster dropdown to filter insights by particular clusters.
You can also get a list of your current insights in the CLI by running the following command. In a multicluster setup, run this command in the management cluster.
kubectl -n gloo-mesh debug -q -i ${pod} --image=curlimages/curl -- curl -s "http://localhost:9090/api/v1/query?query=solo_io_insights" | jq -r '.data.result[].metric.code'
Resolve insights
For detailed information about how to resolve each insight, click Details.
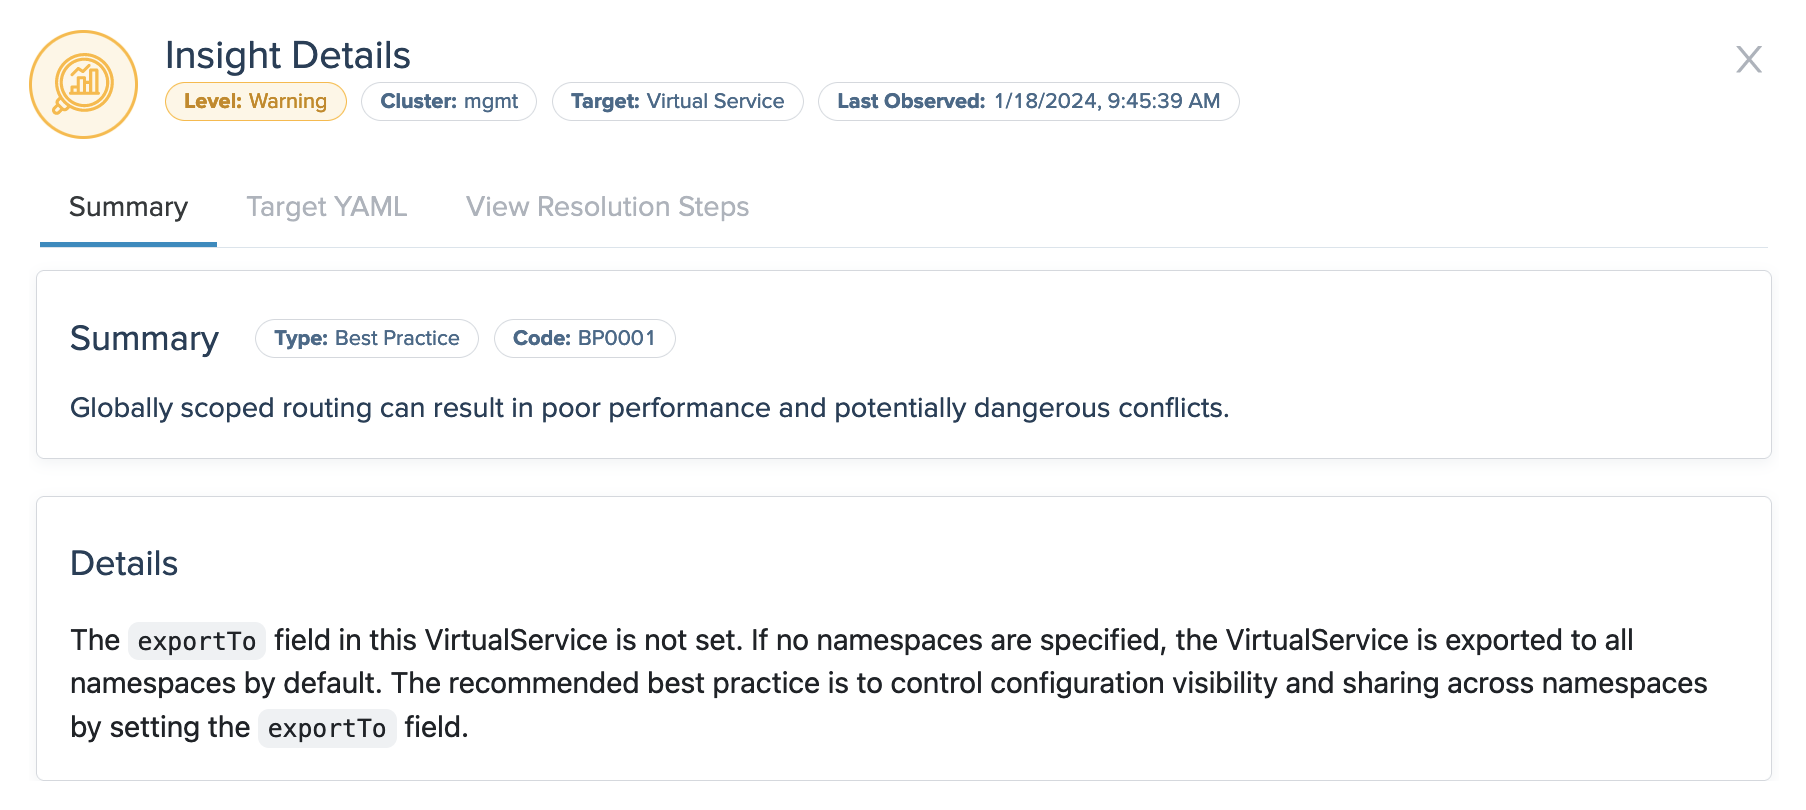
- Summary: The summary tab shows more data about the insight, such as the time when it was last observed in your environment, and details about configuration fields that might need attention. This example insight warns that a virtual service is exported to all namespaces, which is not recommended for security reasons.
- Target YAML: If applicable, the YAML shows the resource file that the insight references, such as a virtual service or gateway.
- View Resolution Steps: If applicable, the resolution tab provides steps that you can take to resolve the insight. For example, you might follow the steps to change specific settings in your Istio and Cilium resources.
Check overall installation health
The Istio and Gloo health card of the dashboard provides a check of the Gloo Mesh Enterprise and Istio installations in your clusters.
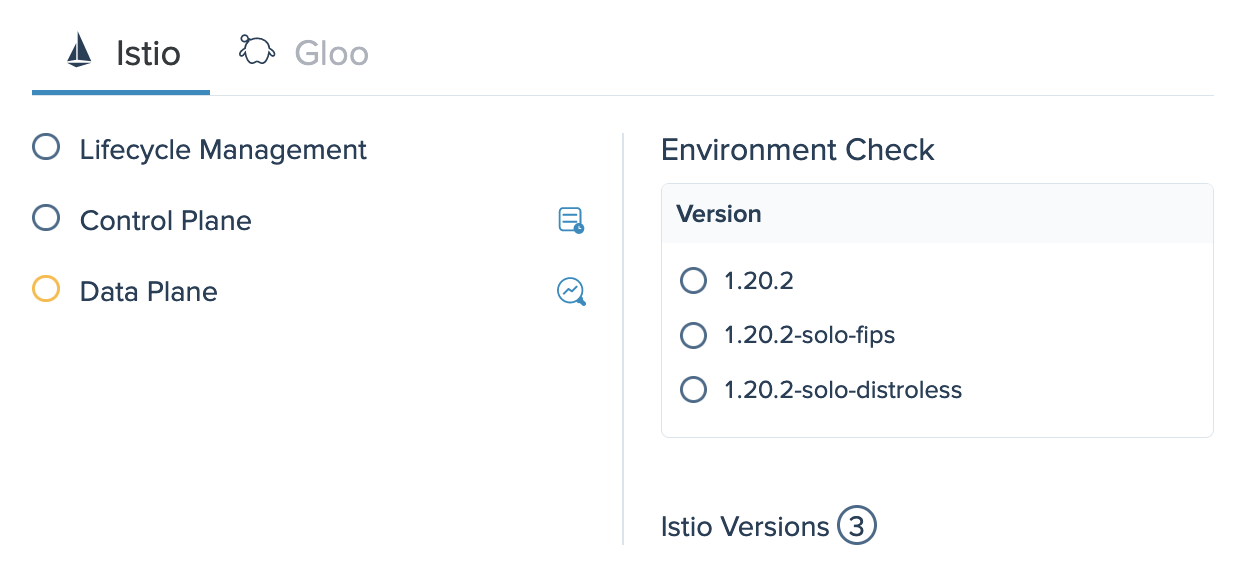
Istio
The Istio tab provides an at-a-glance status of the health of your Istio components. You can click the button next to the Control Plane component to see the logs for istiod pods, and the button next to Data plane to see any related insights. In this example, the data plane is in a warning state. You can hover over the warning icon to see more information, such as the reported Istio insights. The environment check shows all versions of Istio that are installed in your environment, and the state of each installation. In this example, one version of community Istio and two Solo distributions of Istio are installed.
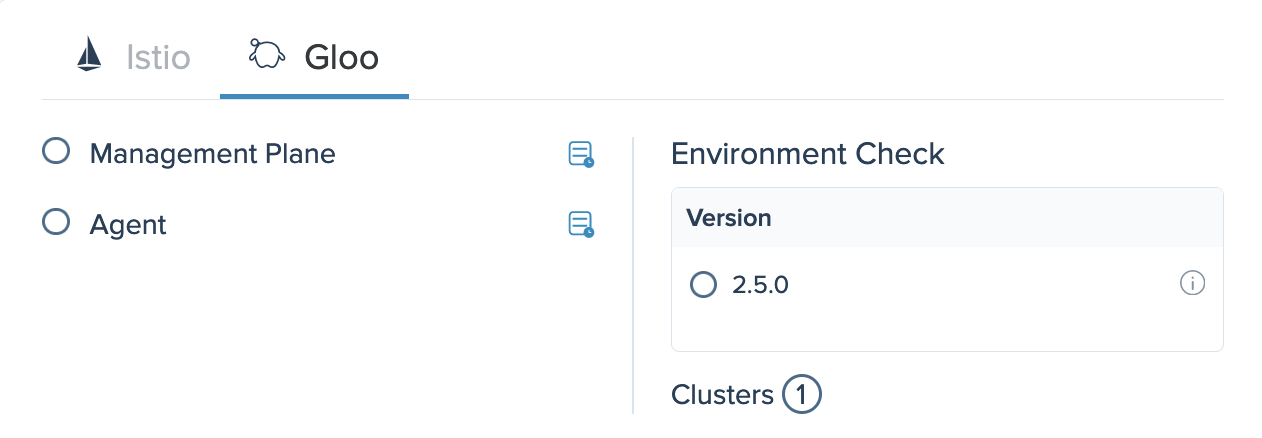
Gloo
The Gloo tab provides an at-a-glance status of the health of each Gloo Mesh Enterprise component. You can click the button next to each component to view its pod logs. The environment check shows all versions of Gloo Mesh Enterprise that are installed in your environment, the state of each installation, and the number of clusters in your environment.
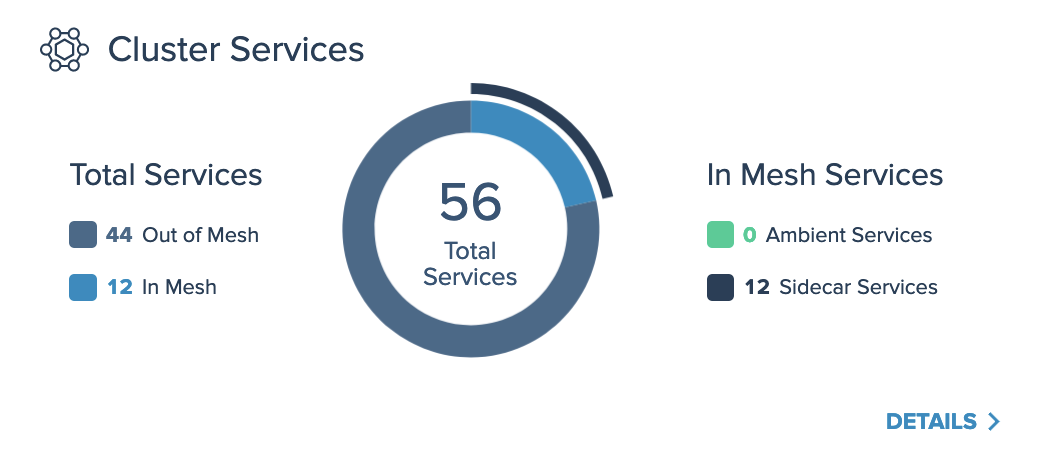
Review in-mesh services
The Cluster Services card of the dashboard visualizes the number of total services across all clusters in your Gloo Mesh Enterprise setup, and whether those services are in your Istio service mesh or not. For example, if you deploy workloads to a namespace that is not labeled for automatic Istio sidecar injection, the services are not managed by Istio and are counted in the number of “Out of Mesh” services.
Additionally, for services in the mesh, the card visualizes which services are included in a sidecar-based mesh, and which services are included in an ambient mesh.
For more details about the discovered services, click Details, which opens the list of services in the Inventory > Services page.
Review your security posture
The Dashboard and Security Insights pages of the Gloo UI can help you review the overall security posture of your Istio setup, including insights and recommendations regarding your certificates, encrypted traffic, FIPS compliance, and more.
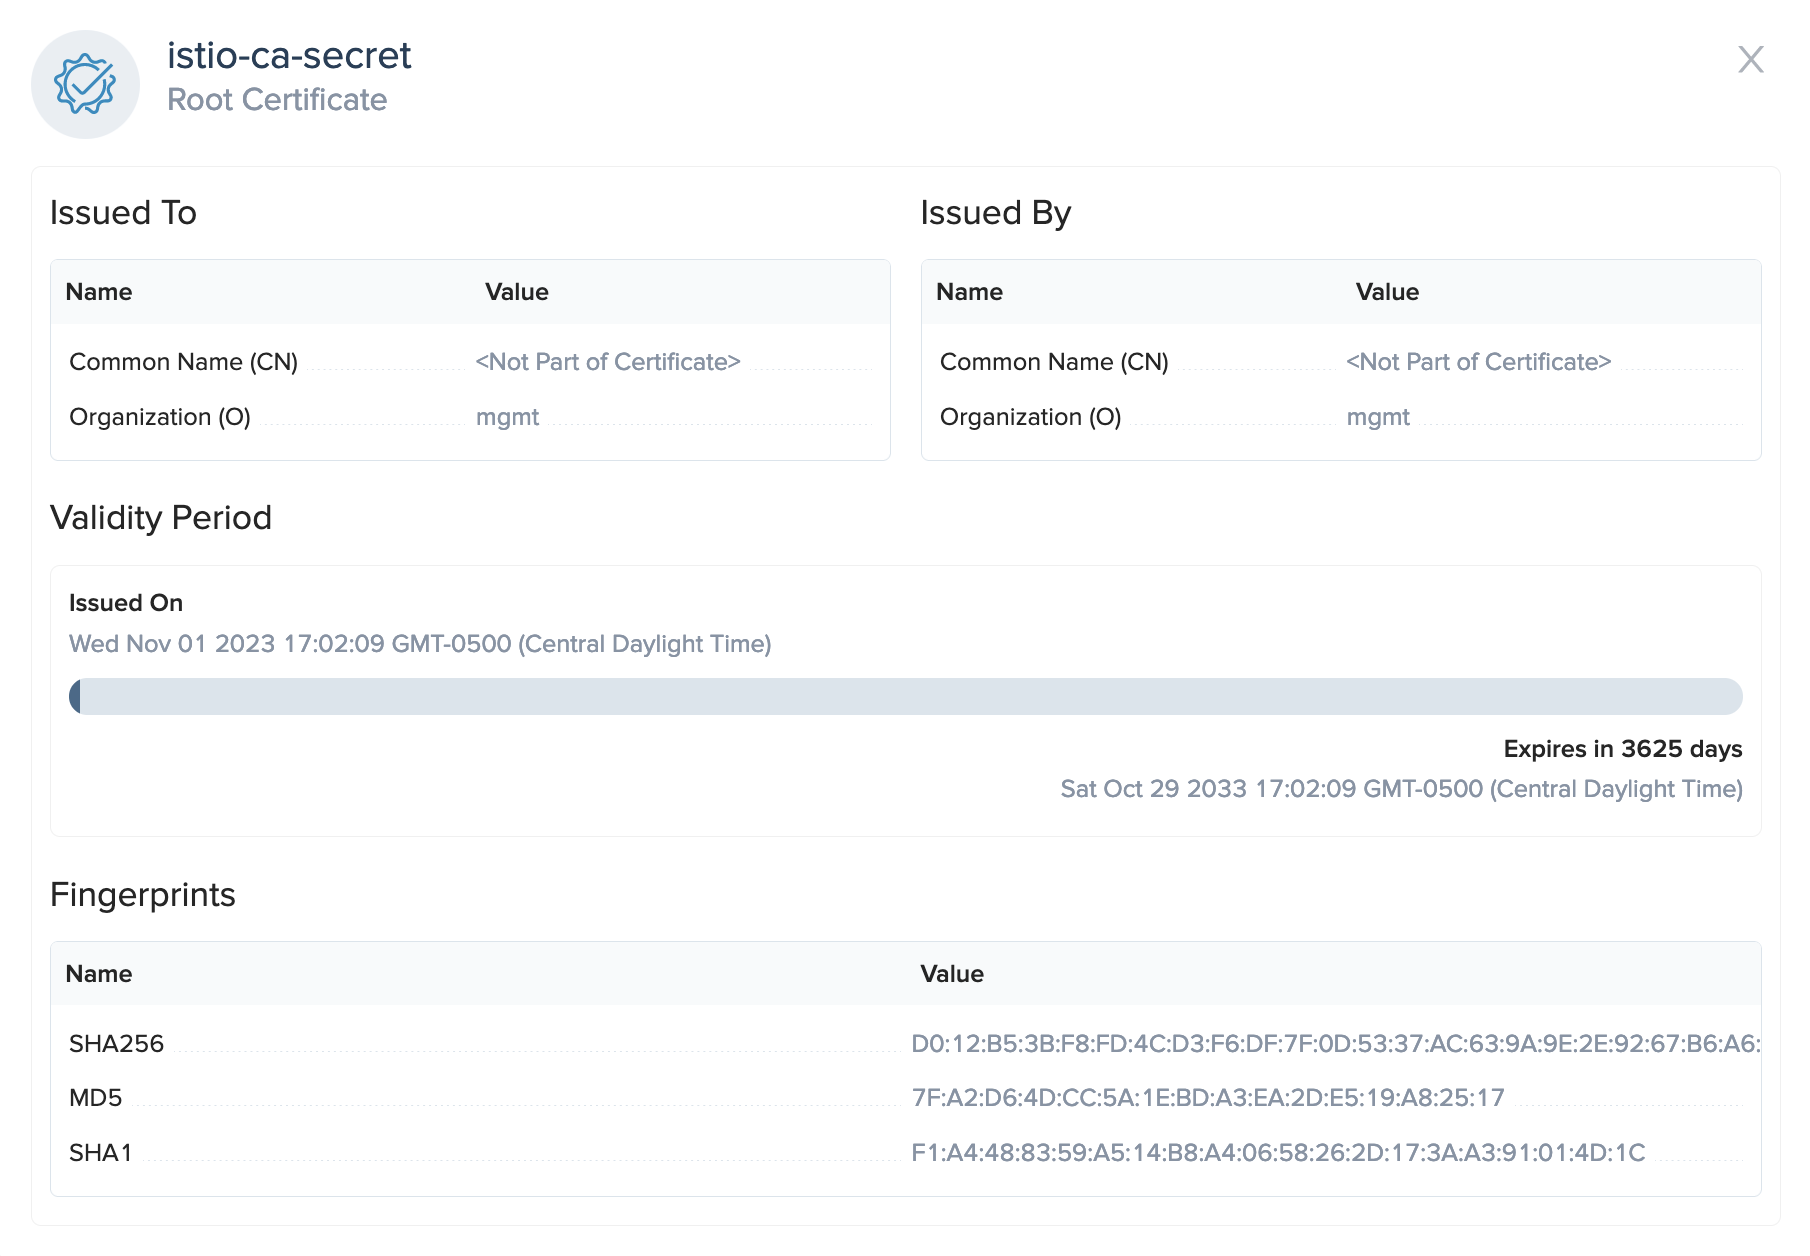
Check certificates
The Certificate Expiry card of the dashboard visualizes your Istio root and intermediate certificates, and how much time you have before they expire. You can see how long your certificates are valid for in the timeline bar. For example, if your certificates are in the blue section of the timeline, the certificates are valid and no action is required. If your certificates are in the yellow section, you can begin the renewal process. If your certificates are in the red section, your certificates are expired, and must be renewed.
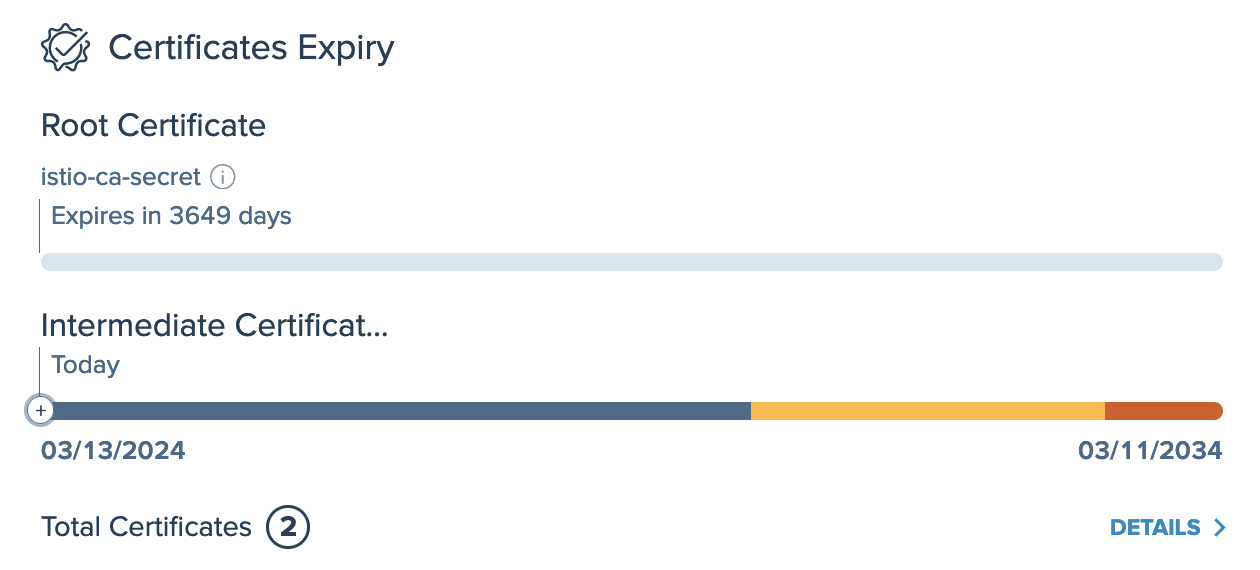
To view a list of all certificates for your Istio setup, you can click the Details button, or go to the Security > Certificates page. This list provides the Filter by expiration… dropdown to filter insights by validity status, and the Filter by type… dropdown to filter certificates by type, such as root or intermediate.
To view the details of a certificate, such as the issue details, total validity period, and fingerprints, click More details.
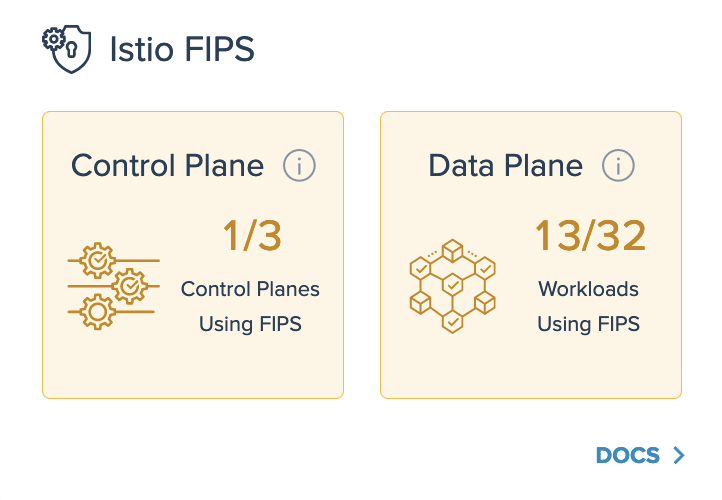
Review FIPS compliance
The Istio FIPS card of the dashboard confirms whether the images that you use for your Istio control plane are FIPS compliant, and whether ther workloads in your data plane are managed by a FIPS-complaint Istio control plane.
For example, if your environment runs workloads that require federal information processing compliance, you can use Solo distributions of Istio that are specially built to comply with NIST FIPS. When you use a Solo distribution of Istio tagged with -fips, your istiod control plane becomes FIPS compliant. Then, when you update workloads in your service mesh to be managed by this istiod control plane, your workloads are also counted as FIPS complaint.
In this example, one istiod control plane and some in-mesh workloads are FIPS compliant.
For more information on FIPS compliance, see Supported Istio versions.
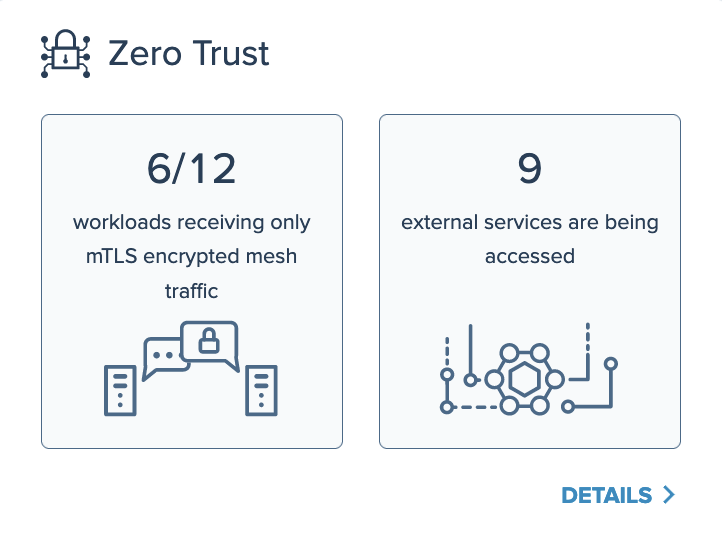
Verify zero trust
The Zero Trust card of the dashboard summarizes the security posture of traffic to and from your in-mesh services.
For example, if you configure your Istio workloads to use the PERMISSIVE mutual TLS (mTLS) mode, only a low number of workloads might receive mTLS-encrypted traffic requests. If you later add proxy sidecars to more of your services to include them in the mesh, and switch the mTLS mode to STRICT, the number of services receiving encrypted traffic increases significantly.
Additionally, this card helps you keep track of how many services that are external to the mesh are accessed by services that are in the mesh. To see the list of accessed external services, click Details.
Disable insights
As you resolve insights in your environment, you might want to ignore or remove some insights instead of resolving them. For example, an insight that gives a warning for production usage might not be relevant when you try out a new feature in a sandbox Istio environment.
To disable an insight and remove it from your insights list in the Gloo UI:
- Upgrade your Gloo CRDs Helm chart to include the
--set featureGates.insightsConfiguration=trueflag.helm upgrade -i gloo-platform-crds gloo-platform/gloo-platform-crds \ --namespace=gloo-mesh \ --create-namespace \ --version=$GLOO_VERSION \ --set featureGates.insightsConfiguration=true Open the Gloo UI. The Gloo UI is served from the
gloo-mesh-uiservice on port 8090. You can connect by using themeshctlorkubectlCLIs.- meshctl: For more information, see the CLI documentation.
meshctl dashboard - kubectl:
- Port-forward the
gloo-mesh-uiservice on 8090.kubectl port-forward -n gloo-mesh svc/gloo-mesh-ui 8090:8090 - Open your browser and connect to http://localhost:8090.
- Port-forward the
- meshctl: For more information, see the CLI documentation.
- From the left-hand navigation, click Home > Insights.
- Find the insight’s code by clicking the insight’s Details, and look for the Code.
- Include the insight’s code in an
InsightsConfigresource. For example, the following resource disables theCFG0002andCFG0003insights.kubectl apply -f - << EOF apiVersion: admin.gloo.solo.io/v2alpha1 kind: InsightsConfig metadata: name: insights-config namespace: gloo-mesh spec: disabledInsights: - CFG0002 - CFG0003 EOF