Apply a policy and explore the UI
Apply a fault injection policy to the ratings service. Then, you can check out the policy and other Gloo resources in the Gloo UI.
Verify in-cluster routing
Before you apply a policy, verify that the productpage service can route to the ratings-v1 and ratings-v2 services within the same service mesh in cluster1.
In a separate tab in your terminal, open the Bookinfo product page from your local host.
- Enable port-forwarding on the product page deployment.
kubectl -n bookinfo port-forward deployment/productpage-v1 9080:9080 - Open your browser to http://localhost:9080/productpage?u=normal.
- Enable port-forwarding on the product page deployment.
Refresh the page a few times to see the black stars in the Book ratings column appear and disappear. The presence of black stars represents
ratings-v2and the absence of stars representsratings-v1, and the presence of red stars representsratings-v3.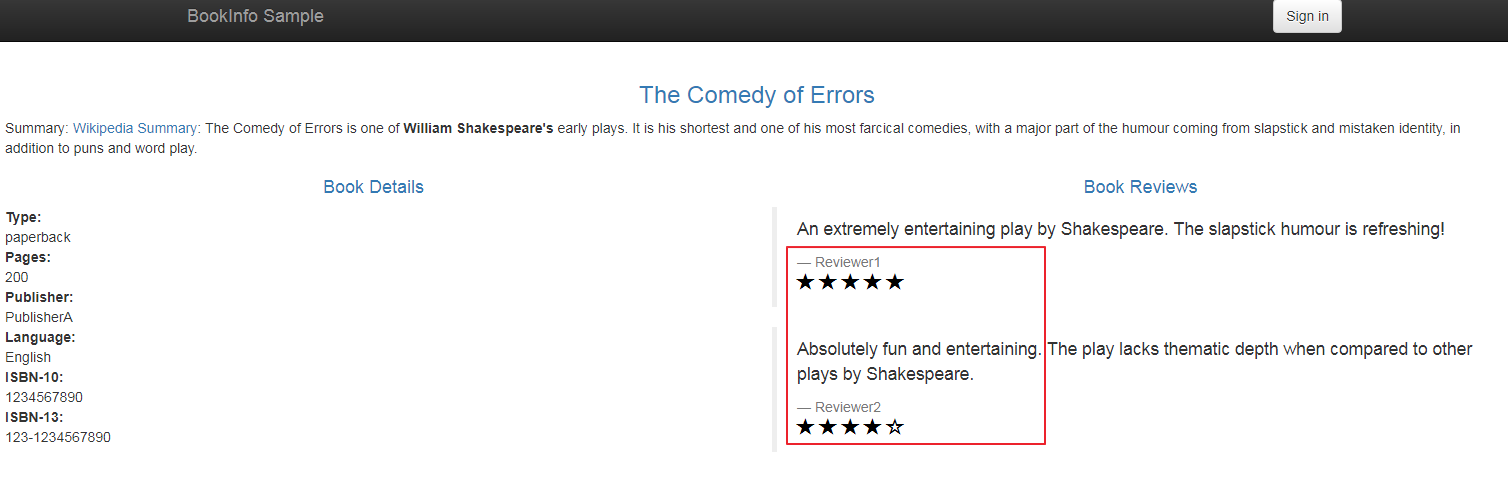
Figure: Bookinfo product page UI Figure: Bookinfo product page UI
Apply fault injection
Apply a fault injection policy to the ratings service to delay requests and simulate network issues or an overloaded service. A delay simulates an overloaded upstream service or network issues, and can help you build more resilient apps.
Create a temporary curl or debug pod and send a request to the ratings app from your local machine.
Create a fault injection policy to delay responses from the ratings app by 10 seconds, and a route table specifically for testing access to the ratings app.
  kubectl apply -f- <<EOF
apiVersion: resilience.policy.gloo.solo.io/v2
kind: FaultInjectionPolicy
metadata:
  name: faultinjection-basic-delay
  namespace: bookinfo
spec:
  applyToRoutes:
    - route:
        labels:
          route: ratings
  config:
    delay:
      fixedDelay: 10s
---
apiVersion: networking.gloo.solo.io/v2
kind: RouteTable
metadata:
  name: ratings-rt
  namespace: bookinfo
spec:
  hosts:
  - ratings
  http:
  - forwardTo:
      destinations:
      - ref:
          name: ratings
          namespace: bookinfo
    labels:
      route: ratings
  workloadSelectors:
  - {}
EOF
Send another request to the ratings app by using the same method as in step 1. Note that this time, the app’s response is delayed due to the fault injection.
Explore the UI
Use the Gloo UI to evaluate the health and efficiency of your service mesh.
Open the Gloo UI. The Gloo UI is served from the
gloo-mesh-uiservice on port 8090. You can connect by using themeshctlorkubectlCLIs.
- meshctl: For more information, see the CLI documentation.
meshctl dashboard - kubectl:
- Port-forward the
gloo-mesh-uiservice on 8090.kubectl port-forward -n gloo-mesh svc/gloo-mesh-ui 8090:8090 - Open your browser and connect to http://localhost:8090.
- Port-forward the
Review the Dashboard page, which presents an at-a-glance look at the health of workspaces and clusters that make up your Gloo setup.
- In the Workspaces pane, you can review the workspace that was automatically created for you in your Gloo setup.
- In the Clusters pane, you can review the workload clusters that are currently connected to your Gloo setup.
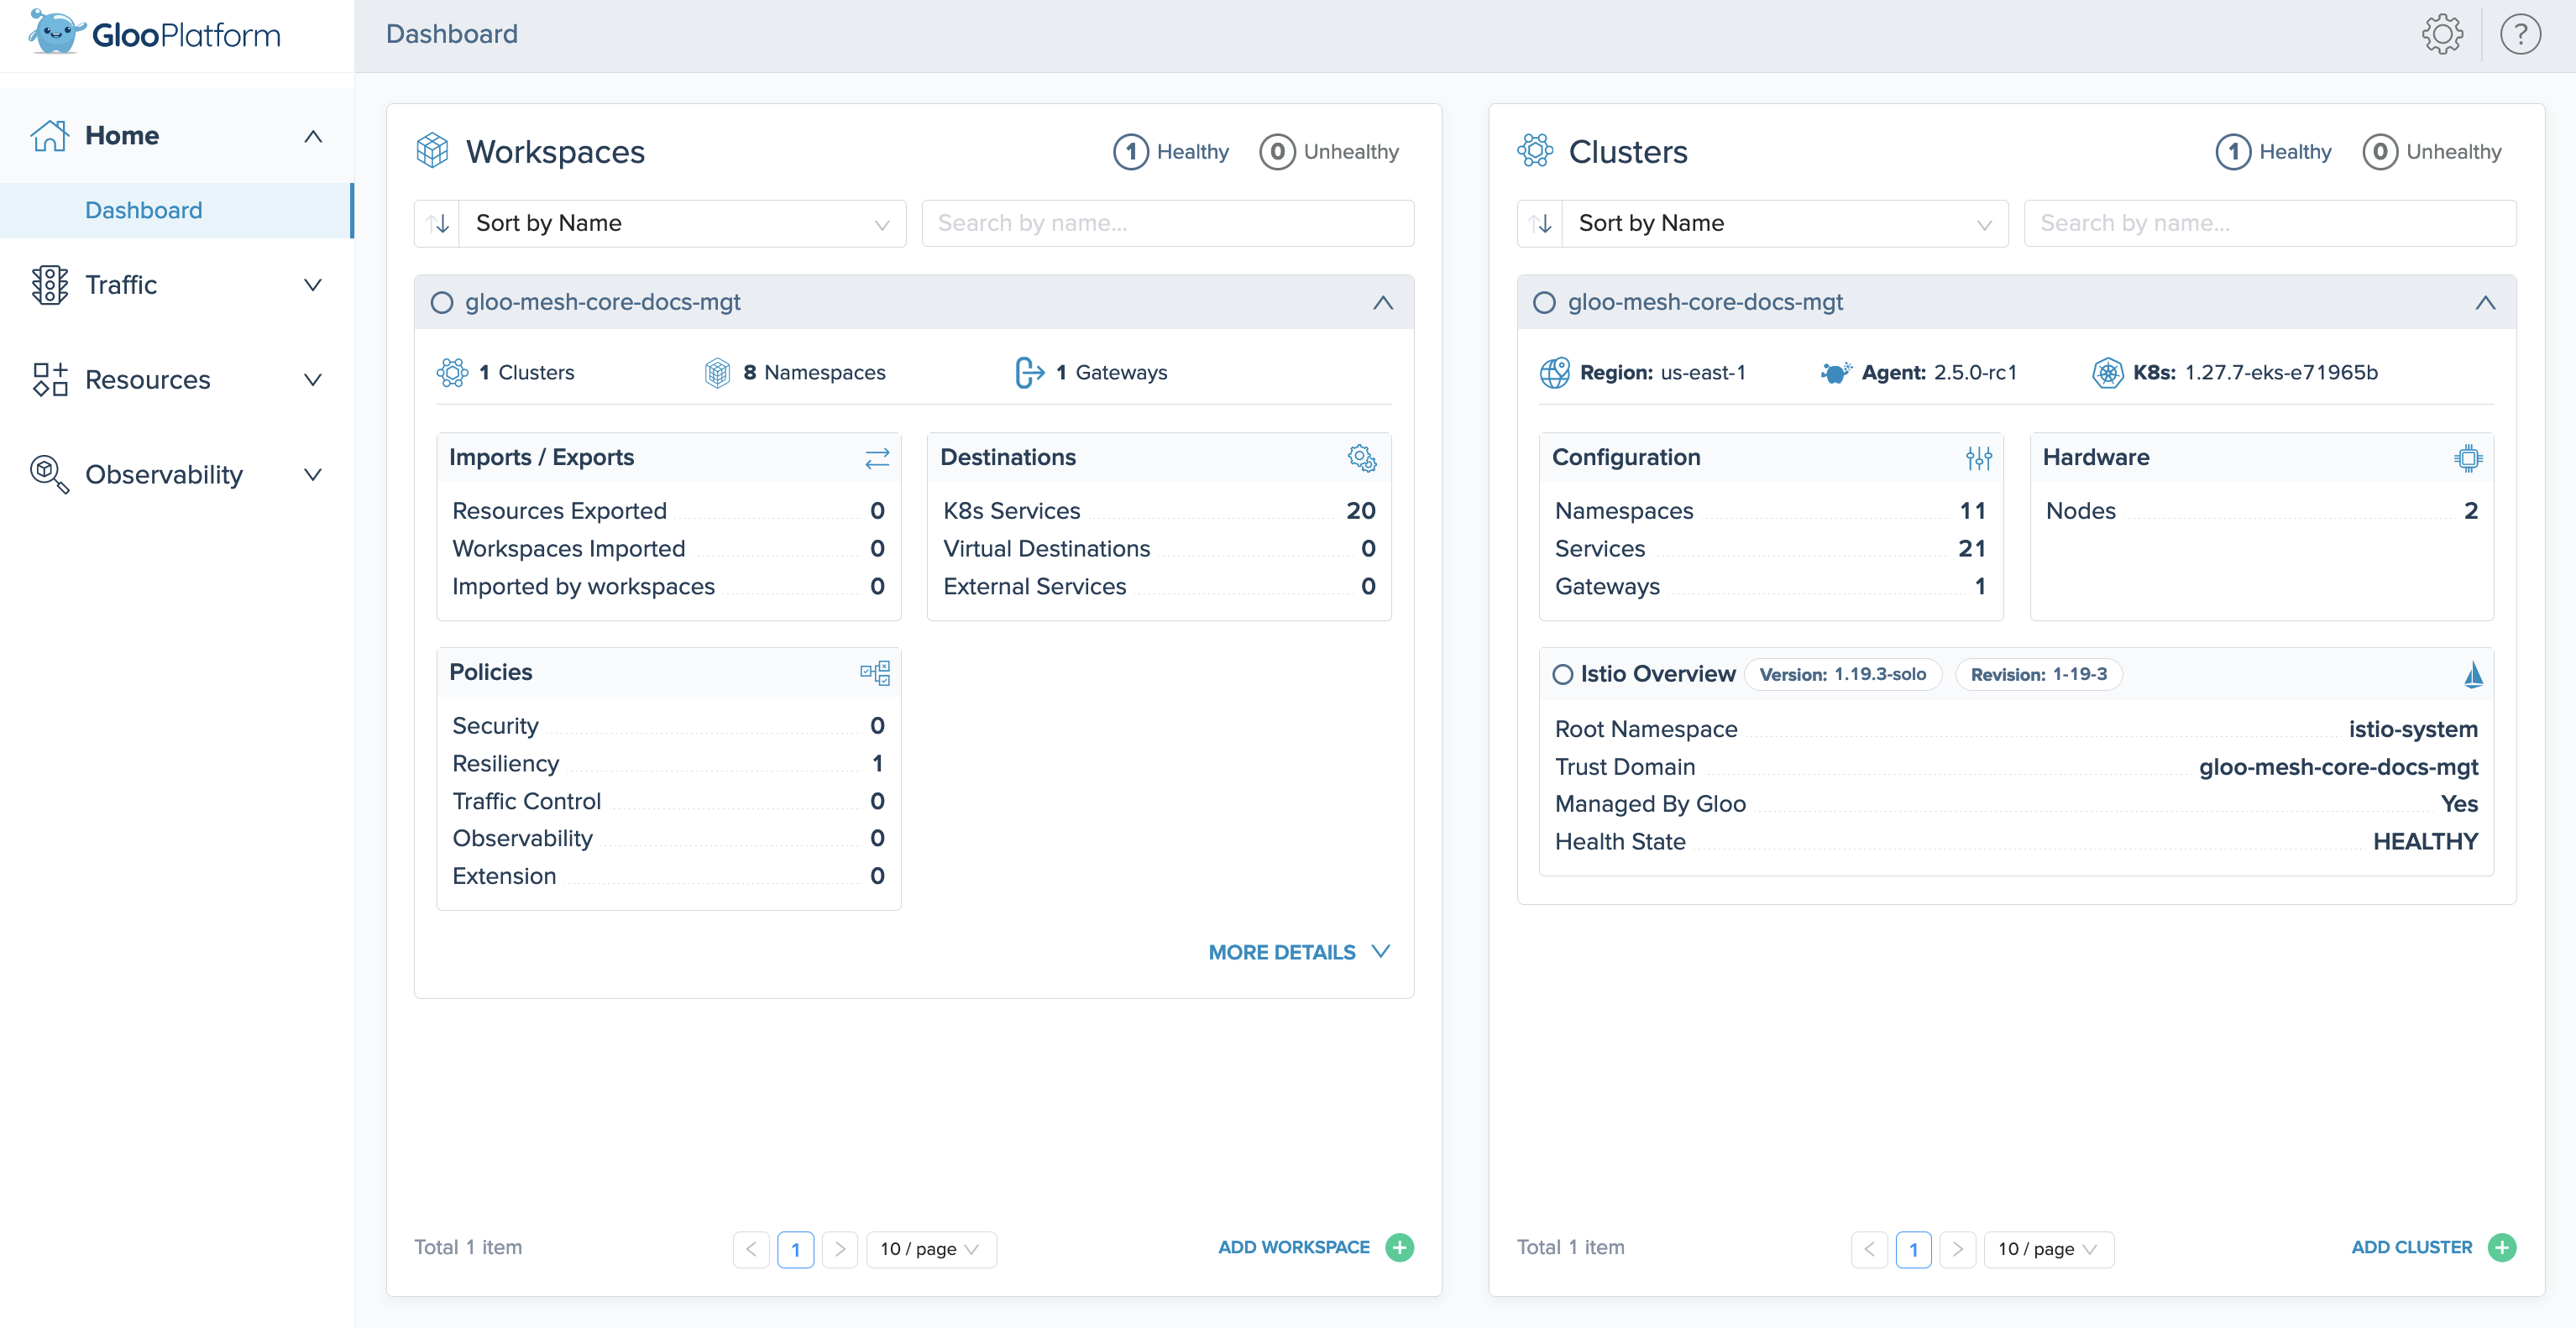
Figure: Overview UI screenshot Figure: Overview UI screenshot Verify the details of the fault injection policy that you created in the previous section.
- Click the Resources tab to open the Solo resources page.
- In the row for your policy,
faultinjection-basic-delay, click View Policy. - Review the details of the policy, such as the
ratingsroute that it applies to. - Click View YAML.
- Scroll to the end of the YAML output to verify that the policy has a
stateofACCEPTED.
Next steps
Now that you have Gloo Mesh Enterprise and Istio up and running, check out some of the following resources to learn more about Gloo Mesh and expand your service mesh capabilities.
Gloo Mesh Enterprise:
- Customize your Gloo Mesh installation with a Helm-based setup.
- Apply Gloo policies to manage the security and resiliency of your service mesh environment.
- Organize team resources with workspaces.
- When it’s time to upgrade Gloo Mesh Enterprise, see the upgrade guide.
Istio: Now that you have Gloo Mesh Enterprise and Istio installed, you can use Gloo to manage your Istio service mesh resources. You don’t need to directly configure any Istio resources going forward.
- Find out more about hardened Istio
n-4version support built into Solo distributions of Istio. - Review how Gloo Mesh Enterprise custom resources are automatically translated into Istio resources.
- Monitor and observe your Istio environment with Gloo Mesh Enterprise’s built-in telemetry tools.
- When it’s time to upgrade Istio, use Gloo Mesh Enterprise to upgrade managed Istio installations.
Help and support:
- Talk to an expert to get advice or build out a proof of concept.
- Join the #gloo-mesh channel in the Solo.io community slack.
- Try out one of the Gloo workshops.
Cleanup
You can optionally remove the resources that you set up as part of this guide.
Delete the fault injection policy and testing route table.
  kubectl delete FaultInjectionPolicy faultinjection-basic-delay -n bookinfo
kubectl delete RouteTable ratings-rt -n bookinfo
If you no longer need this quick-start Gloo Mesh environment, you can follow the steps in the uninstall guide.