UI graph
If you do not see any data in the Gloo UI graph, review the following steps to debug the metrics pipeline and the Gloo UI deployment.
In the graph Layout settings, toggle Idle Nodes and Ghost Nodes to SHOW.
If you still do not see any data, enable port-forwarding of the Prometheus server deployment.
kubectl --context $MGMT_CONTEXT port-forward -n gloo-mesh deploy/prometheus-server 9090Open the scraping endpoints that are configured for the Prometheus server.
open http://localhost:9090/targetsCheck for a green UP state, such as in the following figure.
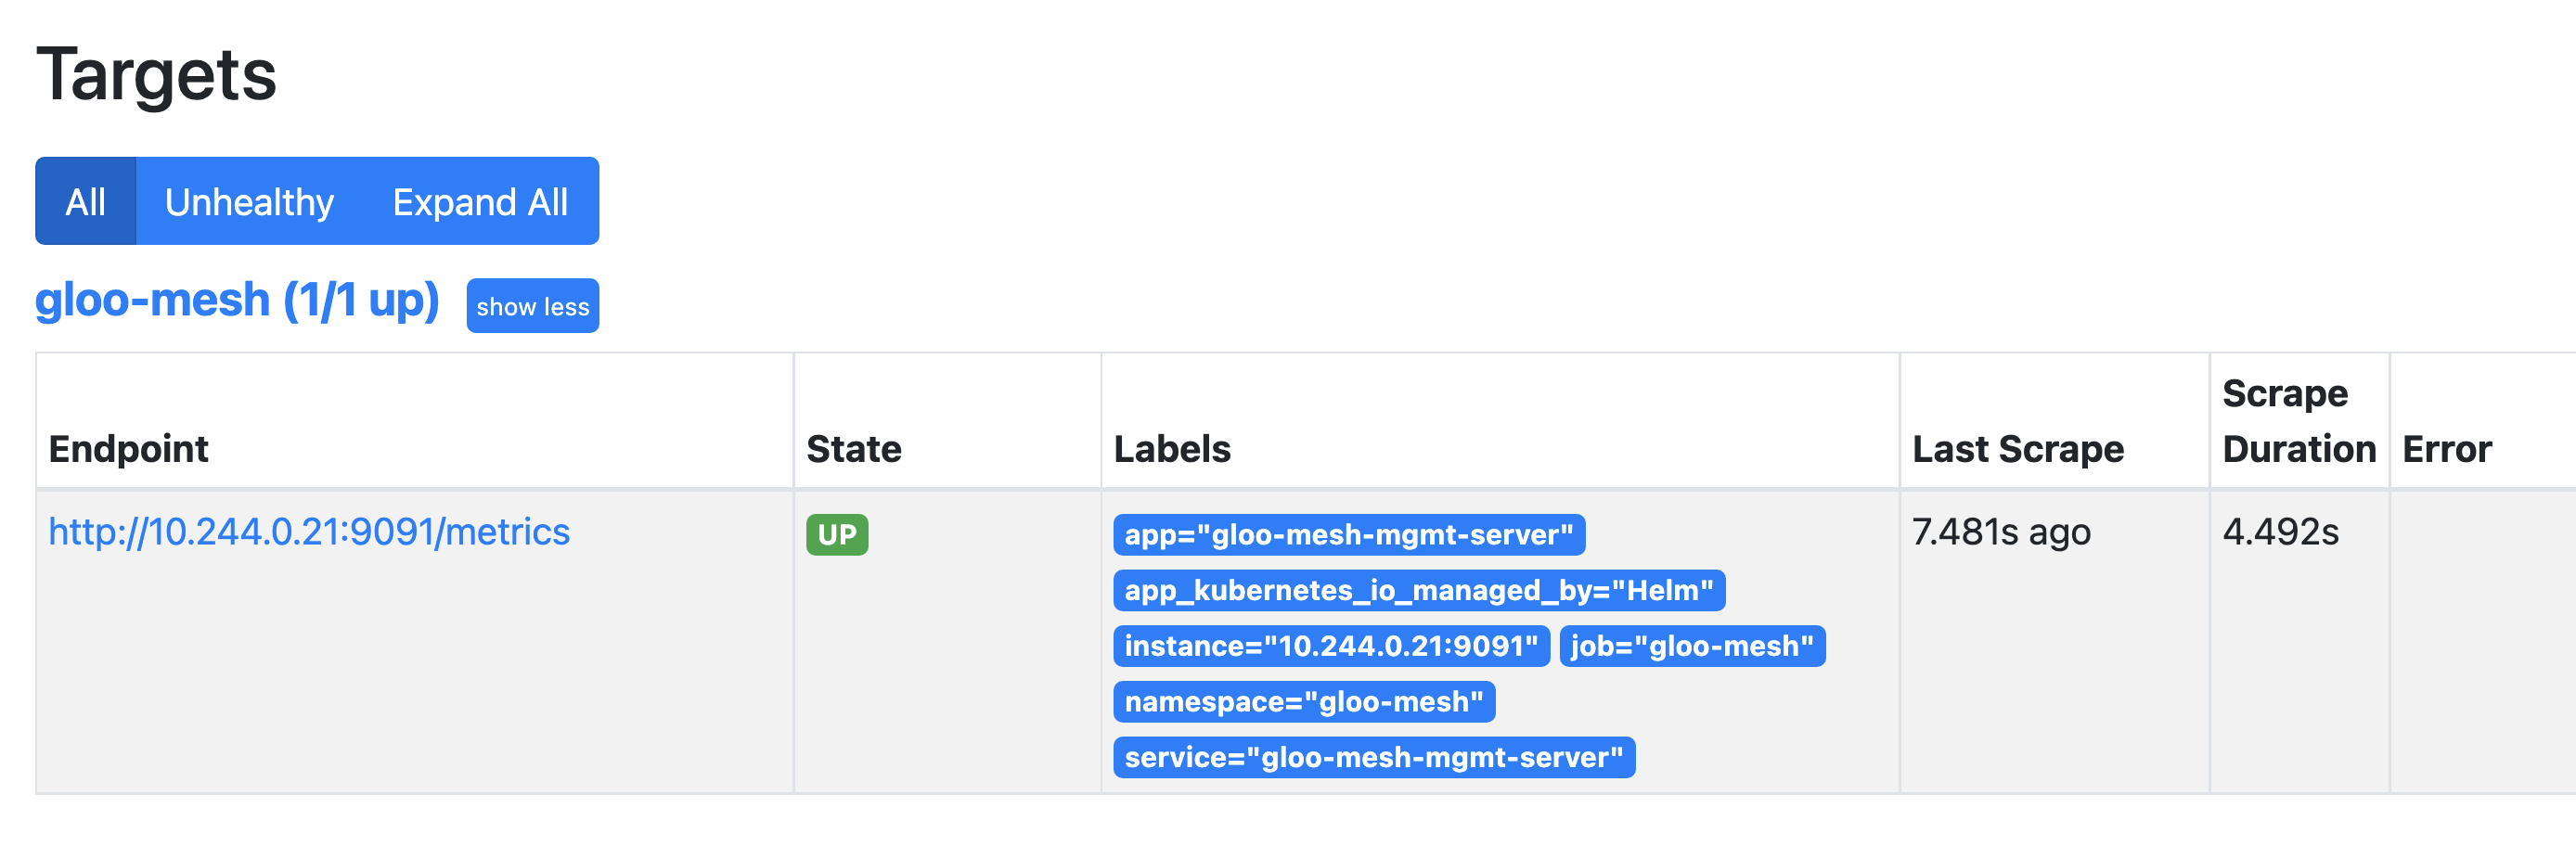
Figure: Example of green **UP** state. Check the following query: http://localhost:9090/graph?g0.expr=istio_requests_total&g0.tab=1&g0.stacked=0&g0.range_input=1h.
If you get an
Empty query resultfrom the previous step, follow the steps in Monitor the health of receivers, exporters, and processors to verify that metrics are being scraped by the Gloo collector agents and sent to the telemetry gateway.