Overview
Use Prometheus to visualize, analyze, and operator on metrics that are collected in your Gloo Mesh Enterprise environment.
During your installation, you have the option to deploy a Gloo Prometheus server alongside the Gloo telemetry pipeline that you can use to monitor the health of Gloo Mesh Enterprise components and the Istio and Cilium resources in your cluster. Prometheus is a powerful time series database that you can use to visualize, analyze, and operate on metrics that are collected from your environment.
Enable/disable the built-in Prometheus server
The built-in Prometheus server is automatically enabled for you when you follow the Get started guide. To manually enable or disable the Prometheus server, add the following configuration to your Helm values file.
To enable the Prometheus server:
prometheus:
  enabled: true
To disable the Prometheus server:
prometheus:
  enabled: false
Default Prometheus setup
The Prometheus server is configured to scrape the Gloo telemetry collector agent (single cluster), or the Gloo telemetry gateway and collector agent (multicluster) to receive the default pipeline metrics. These metrics are used to feed Gloo observability tools, such as the Gloo UI and the Gloo operations dashboard.
To view the default Prometheus configuration:
Get the secret that holds the Prometheus server configuration.
Example output:
  apiVersion: v1
data:
  alerting_rules.yml: Z3JvdXBzOgotIG5hbWU6IEdsb29QbGF0Zm9ybUFsZXJ0cwogIHJ1bGVzOgogIC0gYWxlcnQ6IEdsb29QbGF0Zm9ybVRyYW5zbGF0aW9uTGF0ZW5jeUlzSGlnaAogICAgYW5ub3RhdGlvbnM6CiAgICAgIHJ1bmJvb2s6IGh0dHBzOi8vZG9jcy5zb2xvLmlvL2dsb28tbWVzaC1lbnRlcnByaXNlL21haW4vdHJvdWJsZXNob290aW5nL2dsb28vCiAgICAgIHN1bW1hcnk6IFRoZSB0cmFuc2xhdGlvbiB0aW1lIGhhcyBpbmNyZWFzZWQgYWJvdmUgMTAgc2VjLiBJdCdzIGN1cnJlbnRseSB7eyAkdmFsdWUgfCBodW1hbml6ZSB9fS4KICAgIGV4cHI6IGhpc3RvZ3JhbV9xdWFudGlsZSgwLjk5LCBzdW0ocmF0ZShnbG9vX21lc2hfdHJhbnNsYXRpb25fdGltZV9zZWNfYnVja2V0WzVtXSkpIGJ5KGxlKSkgPiAxMAogICAgZm9yOiAxNW0KICAgIGxhYmVsczoKICAgICAgc2V2ZXJpdHk6IHdhcm5pbmcKICAtIGFsZXJ0OiBHbG9vUGxhdGZvcm1SZWNvbnNjaWxlckxhdGVuY3lJc0hpZ2gKICAgIGFubm90YXRpb25zOgogICAgICBydW5ib29rOiBodHRwczovL2RvY3Muc29sby5pby9nbG9vLW1lc2gtZW50ZXJwcmlzZS9tYWluL3Ryb3VibGVzaG9vdGluZy9nbG9vLwogICAgICBzdW1tYXJ5OiBUaGUgcmVjb25jaWxpYXRpb24gdGltZSBoYXMgaW5jcmVhc2VkIGFib3ZlIDgwIHNlYy4gSXQncyBjdXJyZW50bHkge3sgJHZhbHVlIHwgaHVtYW5pemUgfX0uCiAgICBleHByOiBoaXN0b2dyYW1fcXVhbnRpbGUoMC45OSwgc3VtKHJhdGUoZ2xvb19tZXNoX3JlY29uY2lsZXJfdGltZV9zZWNfYnVja2V0WzVtXSkpIGJ5KGxlKSkgPiA4MAogICAgZm9yOiAxNW0KICAgIGxhYmVsczoKICAgICAgc2V2ZXJpdHk6IHdhcm5pbmcKICAtIGFsZXJ0OiBHbG9vUGxhdGZvcm1BZ2VudHNBcmVEaXNjb25uZWN0ZWQKICAgIGFubm90YXRpb25zOgogICAgICBydW5ib29rOiBodHRwczovL2RvY3Muc29sby5pby9nbG9vLW1lc2gtZW50ZXJwcmlzZS9tYWluL3Ryb3VibGVzaG9vdGluZy9nbG9vLwogICAgICBzdW1tYXJ5OiAnVGhlIGZvbGxvd2luZyBjbHVzdGVyIGlzIGRpc2Nvbm5lY3RlZDoge3sgJGxhYmVscy5jbHVzdGVyIH19LiBDaGVjayB0aGUgR2xvbyBQbGF0Zm9ybSBBZ2VudCBwb2QgaW4gdGhlIGNsdXN0ZXIhJwogICAgZXhwcjogY291bnQgYnkoY2x1c3RlcikgKHN1bSBieShjbHVzdGVyKSAocmVsYXlfcHVzaF9jbGllbnRzX3dhcm1lZCA9PSAwKSkgPiAwCiAgICBmb3I6IDVtCiAgICBsYWJlbHM6CiAgICAgIHNldmVyaXR5OiB3YXJuaW5nCiAgLSBhbGVydDogR2xvb1BsYXRmb3JtVHJhbnNsYXRpb25XYXJuaW5ncwogICAgYW5ub3RhdGlvbnM6CiAgICAgIHJ1bmJvb2s6IGh0dHBzOi8vZG9jcy5zb2xvLmlvL2dsb28tbWVzaC1lbnRlcnByaXNlL21haW4vdHJvdWJsZXNob290aW5nL2dsb28vCiAgICAgIHN1bW1hcnk6IEdsb28gUGxhdGZvcm0gaGFzIGRldGVjdGVkIHt7ICR2YWx1ZSB8IGh1bWFuaXplIH19IHRyYW5zbGF0aW9uIHdhcm5pbmdzIGluIHRoZSBsYXN0IDVtLiBDaGVjayB5b3VyIHt7ICRsYWJlbHMuZ3ZrIH19IHJlc291cmNlcyEKICAgIGV4cHI6IGluY3JlYXNlKHRyYW5zbGF0aW9uX3dhcm5pbmdbNW1dKSA+IDAKICAgIGxhYmVsczoKICAgICAgc2V2ZXJpdHk6IHdhcm5pbmcKICAtIGFsZXJ0OiBHbG9vUGxhdGZvcm1UcmFuc2xhdGlvbkVycm9ycwogICAgYW5ub3RhdGlvbnM6CiAgICAgIHJ1bmJvb2s6IGh0dHBzOi8vZG9jcy5zb2xvLmlvL2dsb28tbWVzaC1lbnRlcnByaXNlL21haW4vdHJvdWJsZXNob290aW5nL2dsb28vCiAgICAgIHN1bW1hcnk6IEdsb28gUGxhdGZvcm0gaGFzIGRldGVjdGVkIHt7ICR2YWx1ZSB8IGh1bWFuaXplIH19IHRyYW5zbGF0aW9uIGVycm9ycyBpbiB0aGUgbGFzdCA1bS4gQ2hlY2sgeW91ciB7eyAkbGFiZWxzLmd2ayB9fSByZXNvdXJjZXMhCiAgICBleHByOiBpbmNyZWFzZSh0cmFuc2xhdGlvbl9lcnJvcls1bV0pID4gMAogICAgbGFiZWxzOgogICAgICBzZXZlcml0eTogd2FybmluZwogIC0gYWxlcnQ6IEdsb29QbGF0Zm9ybVJlZGlzRXJyb3JzCiAgICBhbm5vdGF0aW9uczoKICAgICAgcnVuYm9vazogaHR0cHM6Ly9kb2NzLnNvbG8uaW8vZ2xvby1tZXNoLWVudGVycHJpc2UvbWFpbi90cm91Ymxlc2hvb3RpbmcvZ2xvby8KICAgICAgc3VtbWFyeTogR2xvbyBQbGF0Zm9ybSBoYXMgZGV0ZWN0ZWQge3sgJHZhbHVlIHwgaHVtYW5pemUgfX0gUmVkaXMgc3luYyBlcnJvcnMgaW4gdGhlIGxhc3QgNW0uCiAgICBleHByOiBpbmNyZWFzZShnbG9vX21lc2hfcmVkaXNfc3luY19lcnJbNW1dKSA+IDAKICAgIGxhYmVsczoKICAgICAgc2V2ZXJpdHk6IHdhcm5pbmcK
  prometheus.yml: cnVsZV9maWxlczoKLSAvZXRjL2NvbmZpZy9yZWNvcmRpbmdfcnVsZXMueW1sCi0gL2V0Yy9jb25maWcvYWxlcnRpbmdfcnVsZXMueW1sCi0gL2V0Yy9jb25maWcvcnVsZXMKLSAvZXRjL2NvbmZpZy9hbGVydHMKc2NyYXBlX2NvbmZpZ3M6Ci0gam9iX25hbWU6IHByb21ldGhldXMKICBzdGF0aWNfY29uZmlnczoKICAtIHRhcmdldHM6CiAgICAtIGxvY2FsaG9zdDo5MDkwCi0gam9iX25hbWU6IG90ZWwtY29sbGVjdG9yCiAgaG9ub3JfbGFiZWxzOiB0cnVlCiAga3ViZXJuZXRlc19zZF9jb25maWdzOgogIC0gcm9sZTogcG9kCiAgICBuYW1lc3BhY2VzOgogICAgICBuYW1lczoKICAgICAgLSBnbG9vLW1lc2gKICBzY3JhcGVfaW50ZXJ2YWw6IDMwcwogIHNjcmFwZV90aW1lb3V0OiAyMHMKICByZWxhYmVsX2NvbmZpZ3M6CiAgLSBhY3Rpb246IGtlZXAKICAgIHJlZ2V4OiBzdGFuZGFsb25lLWNvbGxlY3RvcnxhZ2VudC1jb2xsZWN0b3IKICAgIHNvdXJjZV9sYWJlbHM6CiAgICAtIF9fbWV0YV9rdWJlcm5ldGVzX3BvZF9sYWJlbF9jb21wb25lbnQKICAtIGFjdGlvbjoga2VlcAogICAgcmVnZXg6IHRydWUKICAgIHNvdXJjZV9sYWJlbHM6CiAgICAtIF9fbWV0YV9rdWJlcm5ldGVzX3BvZF9hbm5vdGF0aW9uX3Byb21ldGhldXNfaW9fc2NyYXBlCiAgLSBhY3Rpb246IGRyb3AKICAgIHJlZ2V4OiB0cnVlCiAgICBzb3VyY2VfbGFiZWxzOgogICAgLSBfX21ldGFfa3ViZXJuZXRlc19wb2RfYW5ub3RhdGlvbl9wcm9tZXRoZXVzX2lvX3NjcmFwZV9zbG93CiAgLSBhY3Rpb246IHJlcGxhY2UKICAgIHJlZ2V4OiAoaHR0cHM/KQogICAgc291cmNlX2xhYmVsczoKICAgIC0gX19tZXRhX2t1YmVybmV0ZXNfcG9kX2Fubm90YXRpb25fcHJvbWV0aGV1c19pb19zY2hlbWUKICAgIHRhcmdldF9sYWJlbDogX19zY2hlbWVfXwogIC0gYWN0aW9uOiByZXBsYWNlCiAgICByZWdleDogKC4rKQogICAgc291cmNlX2xhYmVsczoKICAgIC0gX19tZXRhX2t1YmVybmV0ZXNfcG9kX2Fubm90YXRpb25fcHJvbWV0aGV1c19pb19wYXRoCiAgICB0YXJnZXRfbGFiZWw6IF9fbWV0cmljc19wYXRoX18KICAjIFN1cHBvcnRpbmcgYm90aCBJUHY0IGFuZCBJUHY2CiAgLSBhY3Rpb246IHJlcGxhY2UKICAgIHJlZ2V4OiAoXGQrKTsoKFtBLUZhLWYwLTldezEsNH06Oj8pezEsN31bQS1GYS1mMC05XXsxLDR9KQogICAgcmVwbGFjZW1lbnQ6ICdbJDJdOiQxJwogICAgc291cmNlX2xhYmVsczoKICAgICAgLSBfX21ldGFfa3ViZXJuZXRlc19wb2RfYW5ub3RhdGlvbl9wcm9tZXRoZXVzX2lvX3BvcnQKICAgICAgLSBfX21ldGFfa3ViZXJuZXRlc19wb2RfaXAKICAgIHRhcmdldF9sYWJlbDogX19hZGRyZXNzX18KICAtIGFjdGlvbjogcmVwbGFjZQogICAgcmVnZXg6IChcZCspOygoKFswLTldKz8pKFwufCQpKXs0fSkKICAgIHJlcGxhY2VtZW50OiAkMjokMQogICAgc291cmNlX2xhYmVsczoKICAgICAgLSBfX21ldGFfa3ViZXJuZXRlc19wb2RfYW5ub3RhdGlvbl9wcm9tZXRoZXVzX2lvX3BvcnQKICAgICAgLSBfX21ldGFfa3ViZXJuZXRlc19wb2RfaXAKICAgIHRhcmdldF9sYWJlbDogX19hZGRyZXNzX18KICAtIGFjdGlvbjogbGFiZWxtYXAKICAgIHJlZ2V4OiBfX21ldGFfa3ViZXJuZXRlc19wb2RfYW5ub3RhdGlvbl9wcm9tZXRoZXVzX2lvX3BhcmFtXyguKykKICAgIHJlcGxhY2VtZW50OiBfX3BhcmFtXyQxCiAgLSBhY3Rpb246IGxhYmVsbWFwCiAgICByZWdleDogX19tZXRhX2t1YmVybmV0ZXNfcG9kX2xhYmVsXyguKykKICAtIGFjdGlvbjogcmVwbGFjZQogICAgc291cmNlX2xhYmVsczoKICAgIC0gX19tZXRhX2t1YmVybmV0ZXNfbmFtZXNwYWNlCiAgICB0YXJnZXRfbGFiZWw6IG5hbWVzcGFjZQogIC0gYWN0aW9uOiByZXBsYWNlCiAgICBzb3VyY2VfbGFiZWxzOgogICAgLSBfX21ldGFfa3ViZXJuZXRlc19wb2RfbmFtZQogICAgdGFyZ2V0X2xhYmVsOiBjb2xsZWN0b3JfcG9kCiAgLSBhY3Rpb246IGRyb3AKICAgIHJlZ2V4OiBQZW5kaW5nfFN1Y2NlZWRlZHxGYWlsZWR8Q29tcGxldGVkCiAgICBzb3VyY2VfbGFiZWxzOgogICAgLSBfX21ldGFfa3ViZXJuZXRlc19wb2RfcGhhc2UKICAjIERyb3AgbGFiZWxzCiAgbWV0cmljX3JlbGFiZWxfY29uZmlnczoKICAtIGFjdGlvbjogbGFiZWxkcm9wCiAgICByZWdleDogYXBwX2t1YmVybmV0ZXNfaW9faW5zdGFuY2V8YXBwX2t1YmVybmV0ZXNfaW9fbmFtZXxpbnN0YW5jZXxqb2J8cG9kX3RlbXBsYXRlX2hhc2gK
kind: Secret
metadata:
  annotations:
    meta.helm.sh/release-name: gloo-platform
    meta.helm.sh/release-namespace: gloo-mesh
  creationTimestamp: "2023-10-26T14:11:44Z"
  labels:
    app.kubernetes.io/managed-by: Helm
  name: gloo-prometheus-server
  namespace: gloo-mesh
  resourceVersion: "3195993"
  uid: 6585b914-8d49-4623-a62f-d9bec09a4448
type: Opaque
Decode the
alert.ymlandprometheus.ymlconfigurations.echo "Z3JvdXBzOgotIG5hbWU6IEdsb29QbGF0Zm..." | base64 -D
Scraping interval
Metrics are scraped every 15 seconds. The scraping action times out after 10 seconds if no connection to the metrics endpoint could be established or no traffic was received from the metrics endpoint.
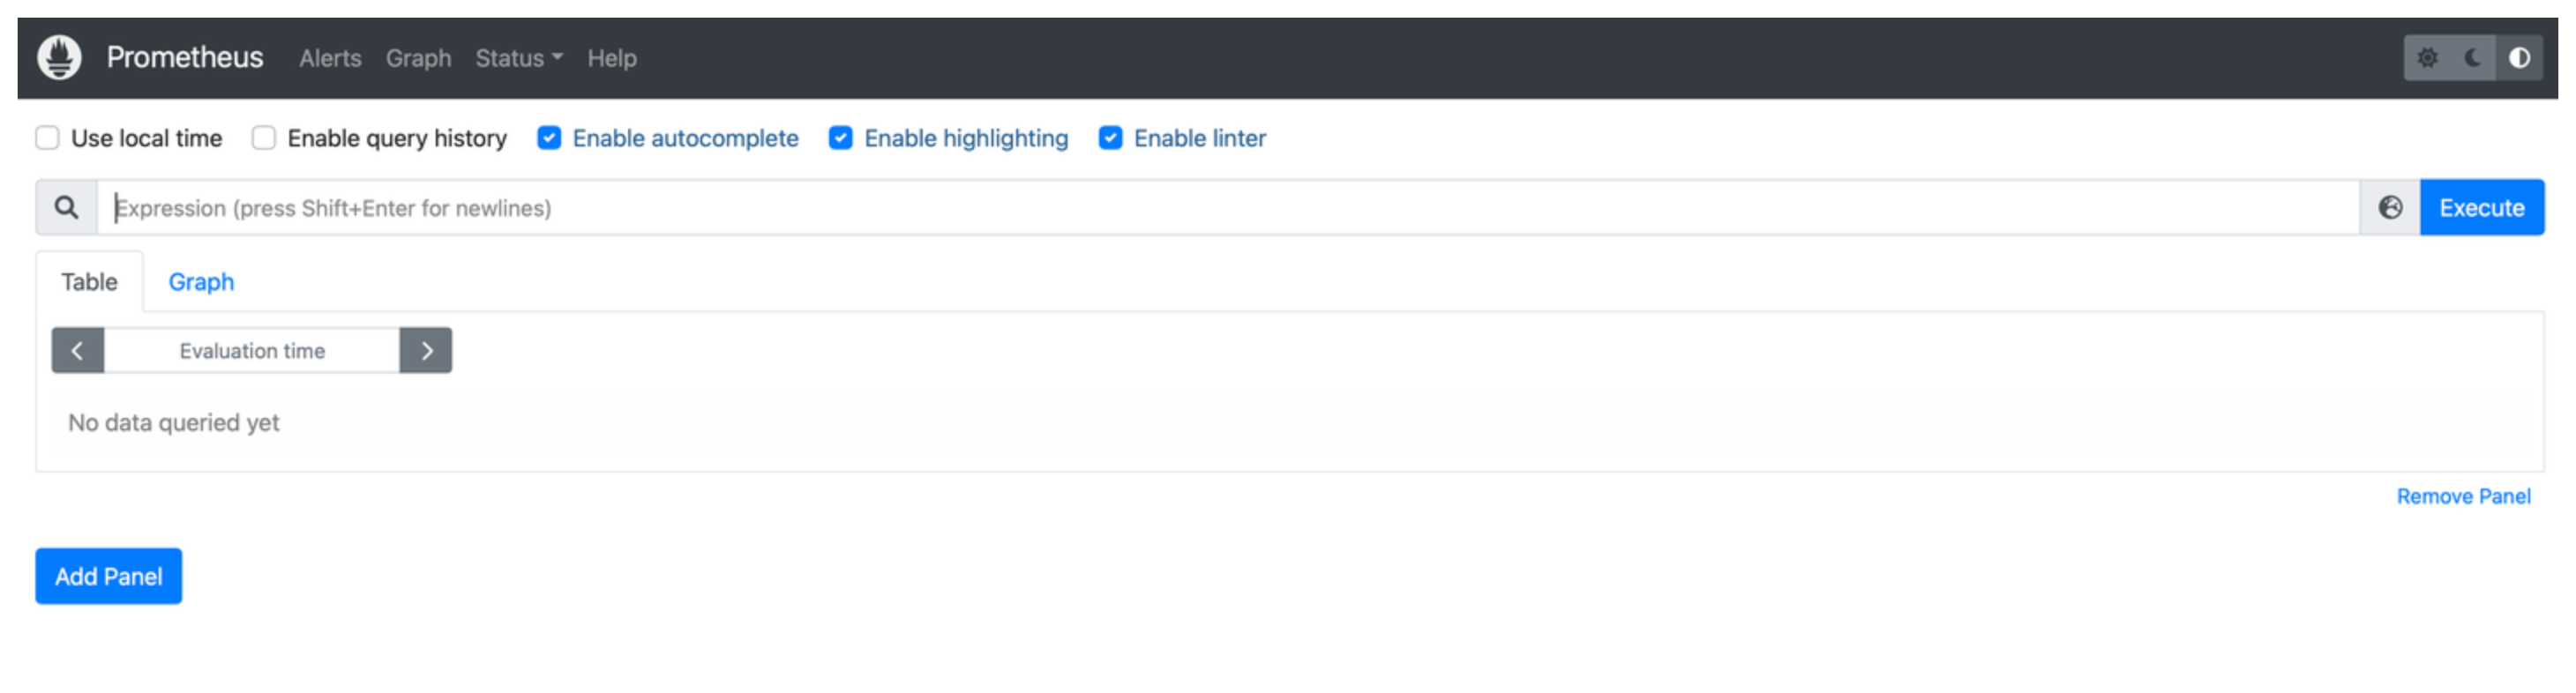
After metrics are scraped and available to the Prometheus server, you can view these metrics by accessing the Prometheus expression browser and running PromQL queries. PromQL is a functional query language that lets you select and aggregate time series, and you can visualize the results of your query in a graph or table.
Retention period for metrics
Metrics are available for as long as the prometheus-server pod runs in your management cluster, but are lost between restarts or when you scale down the deployment.
To keep metrics for a longer period of time, you can replace the built-in Prometheus server with your own production Prometheus server. For more information, see the Customization options.
Metrics provide important information about the performance and health of your resources. For example, you can monitor the time a request takes to be routed from the gateway to your app, the number of successful and failed requests that were processed, or the Gloo custom resources that could not be translated into Istio or Cilium resources. You can use these metrics to detect failures and troubleshoot bottlenecks.
Default metrics
The built-in Prometheus server automatically scrapes a set of default metrics from Gloo components, such as the Gloo management server and agents. You can access these metrics by using the Prometheus expression browser. To open the Prometheus expression browser and find an overview of default metrics that are available to you, see Metrics.
You can optionally add more metrics by setting up your own receivers in the Gloo telemetry pipeline. If your cluster uses the Cilium CNI, you can enable the built-in Cilium pipelines to collect Cilium, Hubble, and eBPF-specific metrics. For more information, see Add Cilium metrics.
Default alerts
To monitor the Gloo Mesh Enterprise components more easily, Gloo automatically sets up alerts in Prometheus for certain Gloo metrics and observes these metrics over time. Alerts are automatically surfaced in the operations dashboard, but can also be accessed by using the Prometheus expression browser directly.
To find a detailed overview of the alerts that are automatically configured in Gloo, see Alerts.
Observability tools that use Prometheus metrics
Several Gloo observability tools use the Prometheus metrics to visualize them in a more consumable way.
- Gloo UI: The Gloo UI monitors certain workload metrics in Prometheus and how they change over time. This data is shown in the Gloo UI Graph. For more information, see Monitored metrics in the Gloo UI.
- Cilium dashboard: If your cluster uses the Cilium CNI and you added Cilium metrics to the Gloo telemetry pipeline, these metrics are automatically scraped by the built-in Prometheus server and visualized in the Cilium dashboard in Grafana. For more information, see Cilium dashboard.
- Operations dashboard: The Gloo operations dashboard uses the data in Prometheus to visualizes key metrics and critical alerts for Gloo Mesh Enterprise components. For more information, see Operations dashboard.