Jaeger
Learn more about the built-in Jaeger UI and how you can use it to trace requests.
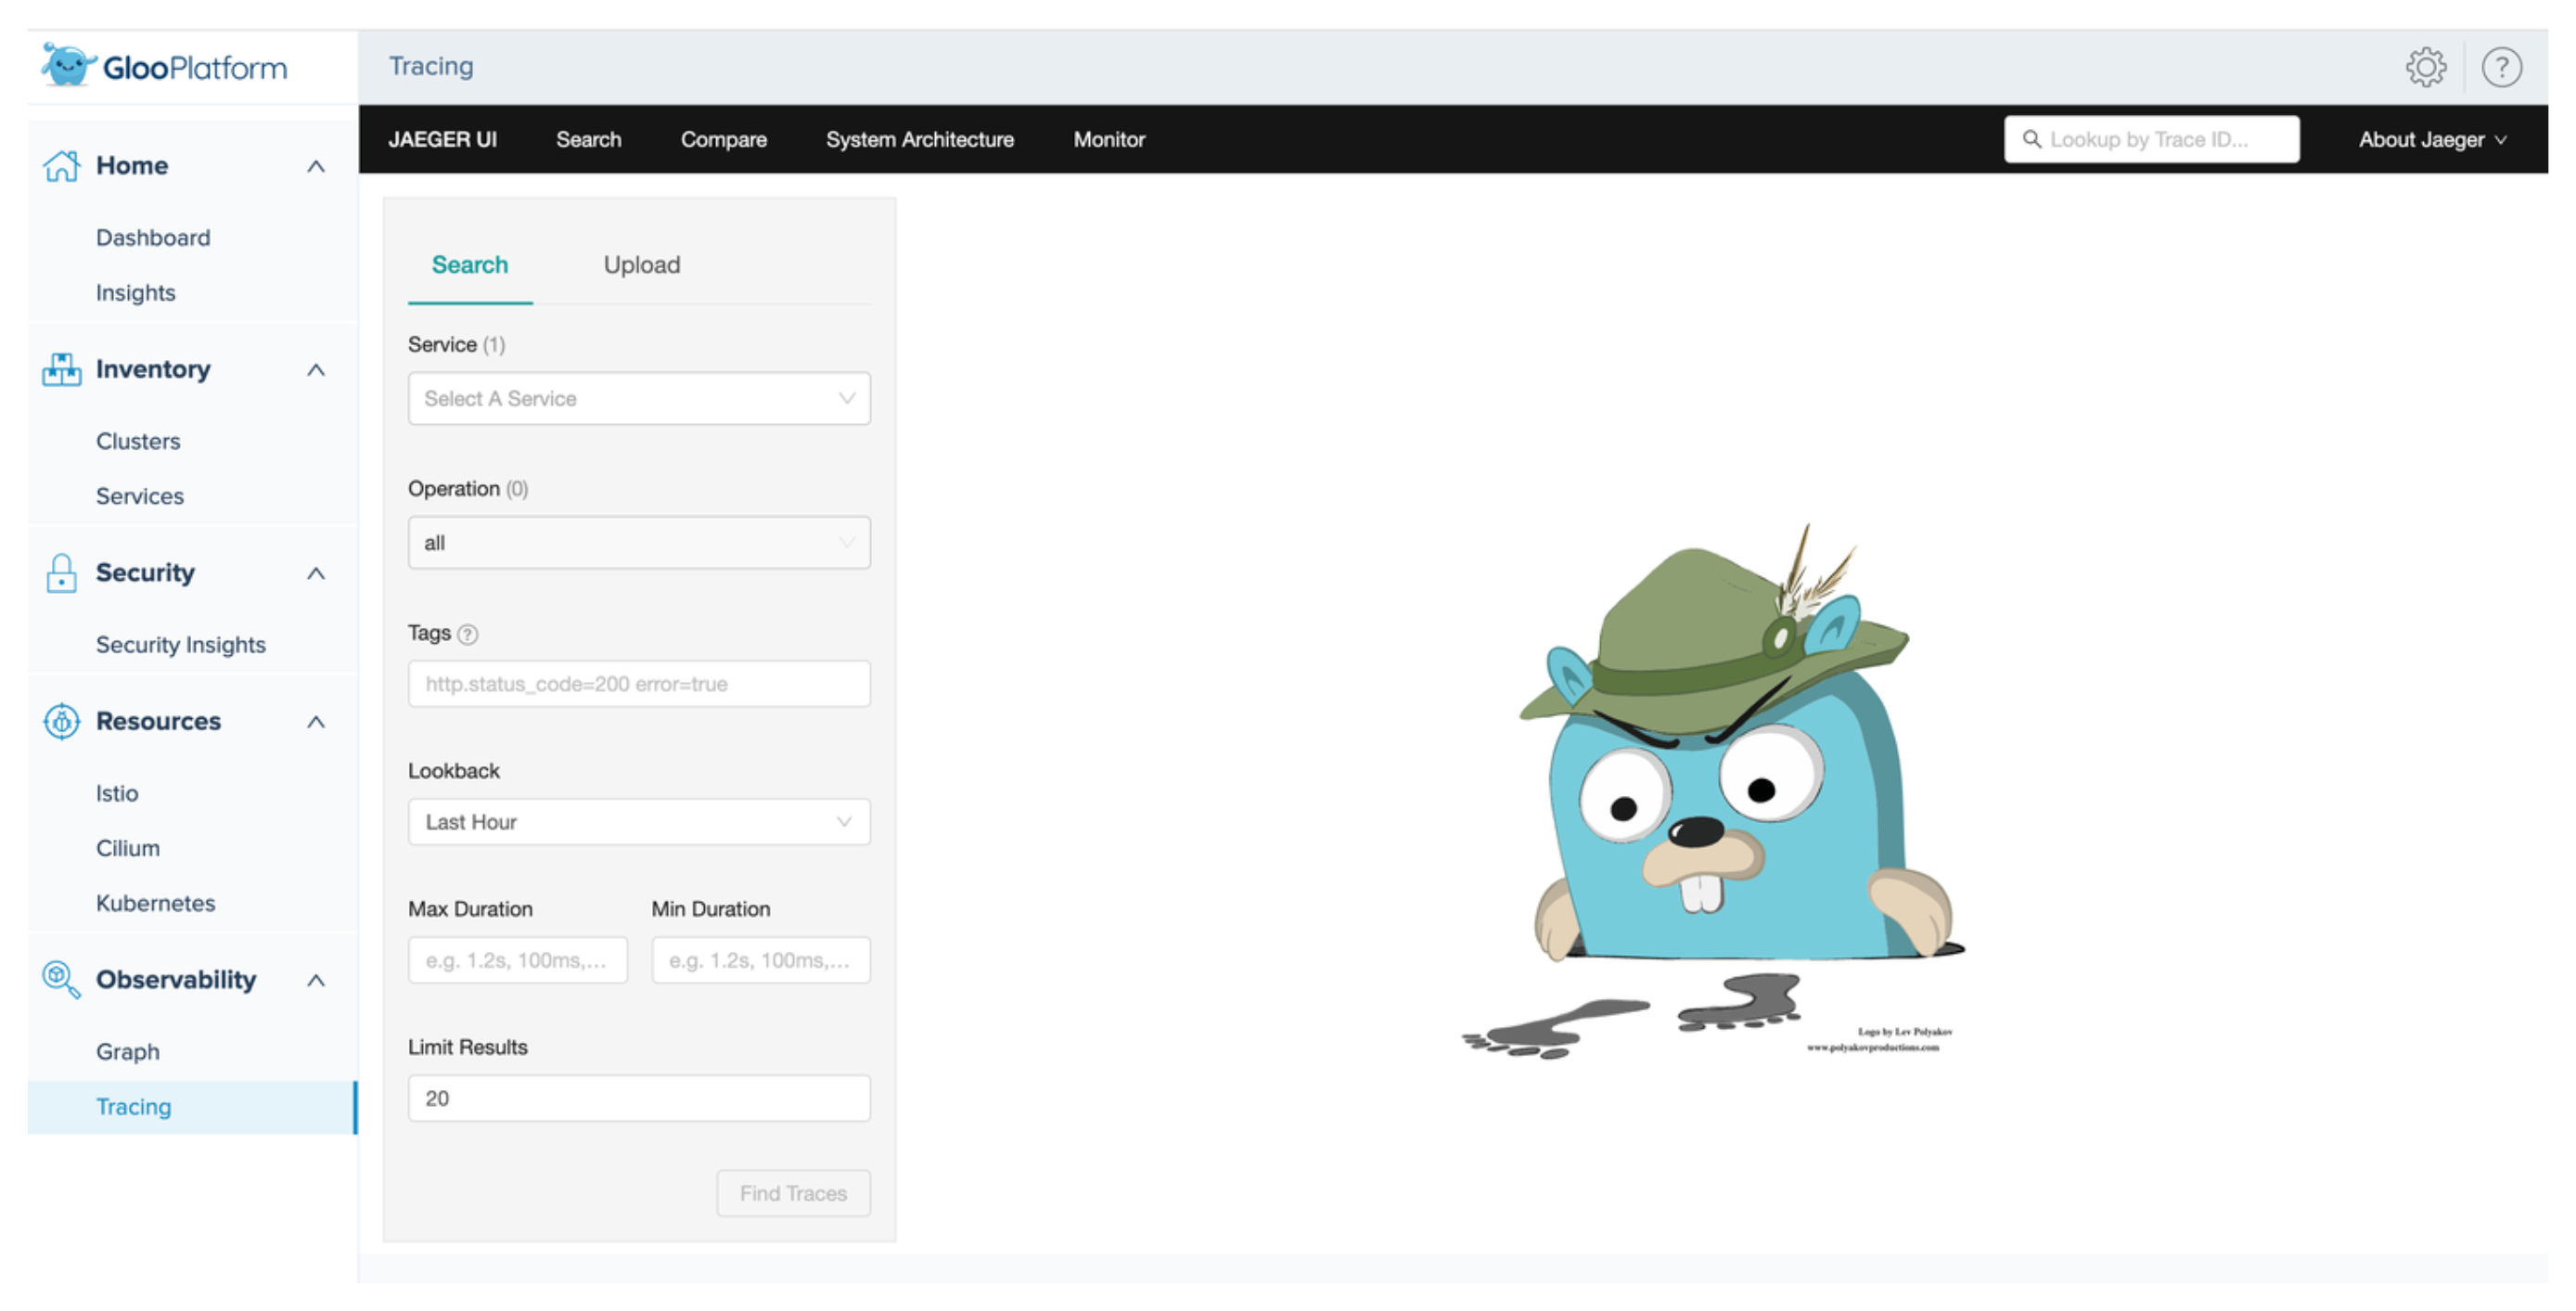
The Gloo telemetry pipeline integrates with Jaeger as the tracing platform. Jaeger is an open source tool that helps you follow the path of a request as it is forwarded between microservices. The chain of events and interactions are then captured by the Gloo telemetry pipeline and visualized in the Jaeger UI that is embedded in the Gloo UI. You can use this data to troubleshoot issues in your microservices and identify bottlenecks. You can also forward the traces from the Gloo telemetry gateway to your own Jaeger tracing platform.


Request tracing is not set up in the Gloo telemetry pipeline by default. To capture traces for Istio-enabled workloads, you must instrument your workloads to generate traces and to send them to the Gloo telemetry collector agent so that they can be forwarded to the Gloo telemetry gateway and the built-in or a custom Jaeger instance.
For more information, see Add Istio request traces.