Single cluster
Deploy Gloo Mesh Core to gain valuable insights into your Istio service mesh.
Gloo Mesh Core deploys alongside your Istio installation in a single-cluster environment, and gives you instant insights into your Istio service mesh through a custom dashboard. You can follow this guide to quickly get started with Gloo Mesh Core. To learn more about the benefits and architecture, see About. To customize your installation with Helm instead, see the advanced installation guide.
Before you begin
Install the following command-line (CLI) tools.
kubectl, the Kubernetes command line tool. Download thekubectlversion that is within one minor version of the Kubernetes clusters you plan to use.meshctl, the Solo command line tool.curl -sL https://run.solo.io/meshctl/install | GLOO_MESH_VERSION=v2.6.0-rc2 sh - export PATH=$HOME/.gloo-mesh/bin:$PATH
Create or use an existing Kubernetes cluster, and save the cluster name in an environment variable.
- The cluster name must be alphanumeric with no special characters except a hyphen (-), lowercase, and begin with a letter (not a number).
export CLUSTER_NAME=<cluster_name>Set your Gloo Mesh Core license key as an environment variable. If you do not have one, contact an account representative. If you prefer to specify license keys in a secret instead, see Licensing. To check your license’s validity, you can run
meshctl license check --key $(echo ${GLOO_MESH_CORE_LICENSE_KEY} | base64 -w0).export GLOO_MESH_CORE_LICENSE_KEY=<license_key>Create a YAML file with the following values to configure the TLS connection between the Gloo management server and agent. The following example uses
My tokenas your relay identity token value, but you can use any string value. The relay token is used by the Gloo agent when establishing the first connection to the Gloo management server. Only when the relay identity token that the agent presents matches the relay token that the Gloo management server uses, initial trust is established and the Gloo agent and management server proceed with establishing a simple TLS connection. In a simple TLS setup, only the management server presents a certificate to authenticate its identity. The identity of the agent is not verified.cat > values.yaml <<EOF glooMgmtServer: extraEnvs: RELAY_DISABLE_CLIENT_CERTIFICATE_AUTHENTICATION: value: "true" RELAY_TOKEN: value: "My token" glooAgent: extraEnvs: RELAY_DISABLE_SERVER_CERTIFICATE_VALIDATION: value: "true" RELAY_TOKEN: value: "My token" EOF
Install Gloo Mesh Core
Install all Gloo Mesh Core components in the same cluster as your Istio service mesh.
Install Gloo Mesh Core in your cluster. This command uses a basic profile to create a
gloo-meshnamespace and install the Gloo control and data plane components. For more information, check out the CLI install profiles.meshctl install --profiles gloo-core-single-cluster \ --set common.cluster=$CLUSTER_NAME \ --set licensing.glooMeshCoreLicenseKey=$GLOO_MESH_CORE_LICENSE_KEY \ --chart-values-file values.yamlVerify that your Gloo Mesh Core setup is correctly installed. If not, try debugging the relay connection. Note that this check might take a few seconds to verify that:
- Your Gloo product license is valid and current.
- The Gloo CRDs are installed at the correct version.
- The management plane pods in the management cluster are running and healthy.
- The Gloo agent is running and connected to the management server.
meshctl checkExample output:
  🟢 License status

INFO  gloo-mesh-core enterprise license expiration is 25 Aug 24 10:38 CDT
INFO  No GraphQL license module found for any product

🟢 CRD version check

🟢 Gloo deployment status

Namespace | Name                           | Ready | Status
gloo-mesh | gloo-mesh-mgmt-server          | 1/1   | Healthy
gloo-mesh | gloo-mesh-redis                | 1/1   | Healthy
gloo-mesh | gloo-mesh-ui                   | 1/1   | Healthy
gloo-mesh | gloo-telemetry-collector-agent | 3/3   | Healthy
gloo-mesh | prometheus-server              | 1/1   | Healthy

🟢 Mgmt server connectivity to workload agents

Cluster | Registered | Connected Pod
test    | true       | gloo-mesh/gloo-mesh-mgmt-server-558cddbbd7-rf2hv

Connected Pod                                    | Clusters
gloo-mesh/gloo-mesh-mgmt-server-558cddbbd7-rf2hv | 1
Deploy Istio
Check whether an Istio control plane already exists.
kubectl get pods -n istio-system
- If an
istiodpod exists, such as in this example output, you already installed an Istio control plane. Continue to the next step.NAME READY STATUS RESTARTS AGE istiod-1-22-b65676555-g2vmr 1/1 Running 0 57s - If no
istiodpod exists, you can use Gloo Mesh Core to quickly install and manage a service mesh for you. For more information about service mesh lifecycle management with Gloo, check out Service mesh lifecycle and Solo distributions of Istio.
Deploy a sample app
To analyze your service mesh with Gloo Mesh Core, be sure to include your services in the mesh.
Explore the UI
Use the Gloo UI to evaluate the health and efficiency of your service mesh. You can review the analysis and insights for your service mesh, such as recommendations to harden your Istio environment and steps to implement them in your environment.
Launch the dashboard
Open the Gloo UI. The Gloo UI is served from the
gloo-mesh-uiservice on port 8090. You can connect by using themeshctlorkubectlCLIs.- meshctl: For more information, see the CLI documentation.
meshctl dashboard - kubectl:
- Port-forward the
gloo-mesh-uiservice on 8090.kubectl port-forward -n gloo-mesh svc/gloo-mesh-ui 8090:8090 - Open your browser and connect to http://localhost:8090.
- Port-forward the
- meshctl: For more information, see the CLI documentation.
Review your Dashboard for an at-a-glance overview of your Gloo Mesh Core environment. Environment insights, health, status, inventories, security, and more are summarized in the following cards:
- Analysis and Insights: Gloo Mesh Core recommendations for how to improve your Istio setup.
- Gloo and Istio health: A status check of the Gloo Mesh Core and Istio installations in your cluster.
- Certificates Expiry: Validity timelines for your root and intermediate Istio certificates.
- Cluster Services: Inventory of services in your Gloo Mesh Core setup, and whether those services are in a service mesh or not.
- Istio FIPS: FIPS compliance checks for the
istiodcontrol plane and Istio data plane workloads. - Zero Trust: Number of service mesh workloads that receive only mutual TLS (mTLS)-encrypted traffic, and number of external services that are accessed from the mesh.
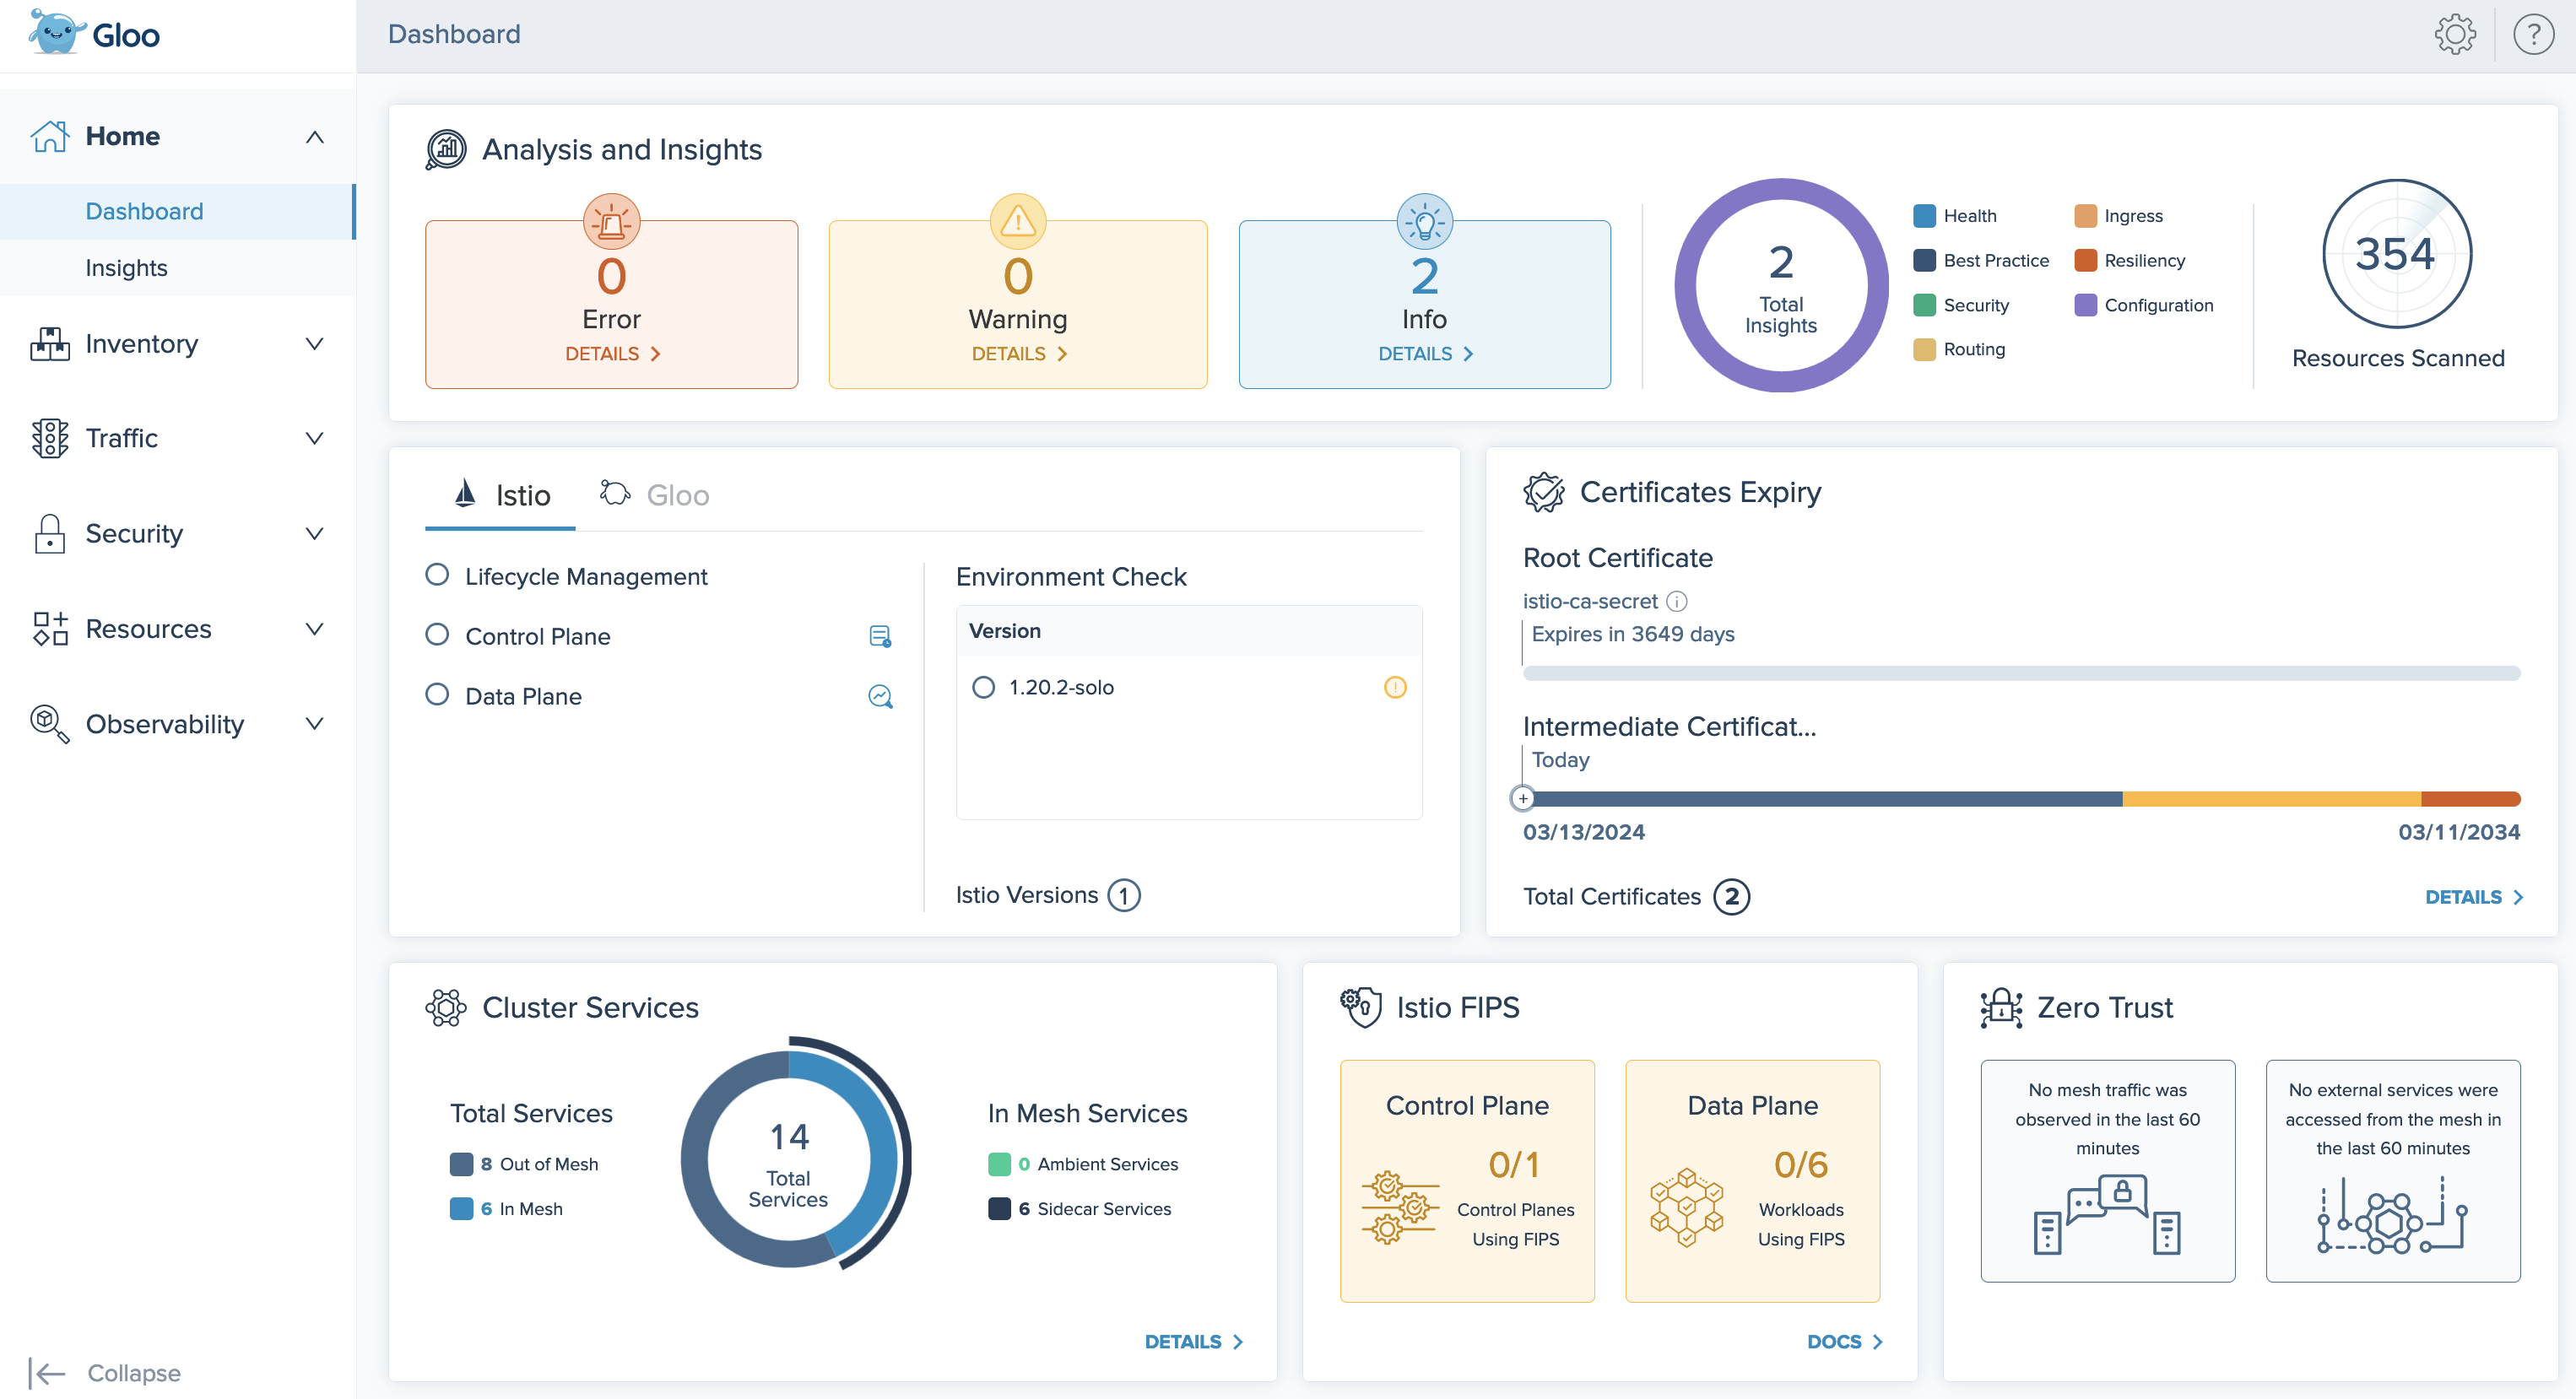
Figure: Gloo UI dashboard
Check insights
Review the insights for your environment. Gloo Mesh Core comes with an insights engine that automatically analyzes your Istio setups for health issues. Then, Gloo shares these issues along with recommendations to harden your Istio setups. The insights give you a checklist to address issues that might otherwise be hard to detect across your environment.
On the Analysis and Insights card of the dashboard, you can quickly see a summary of the insights for your environment, including how many insights are available at each severity level, and the type of insight.
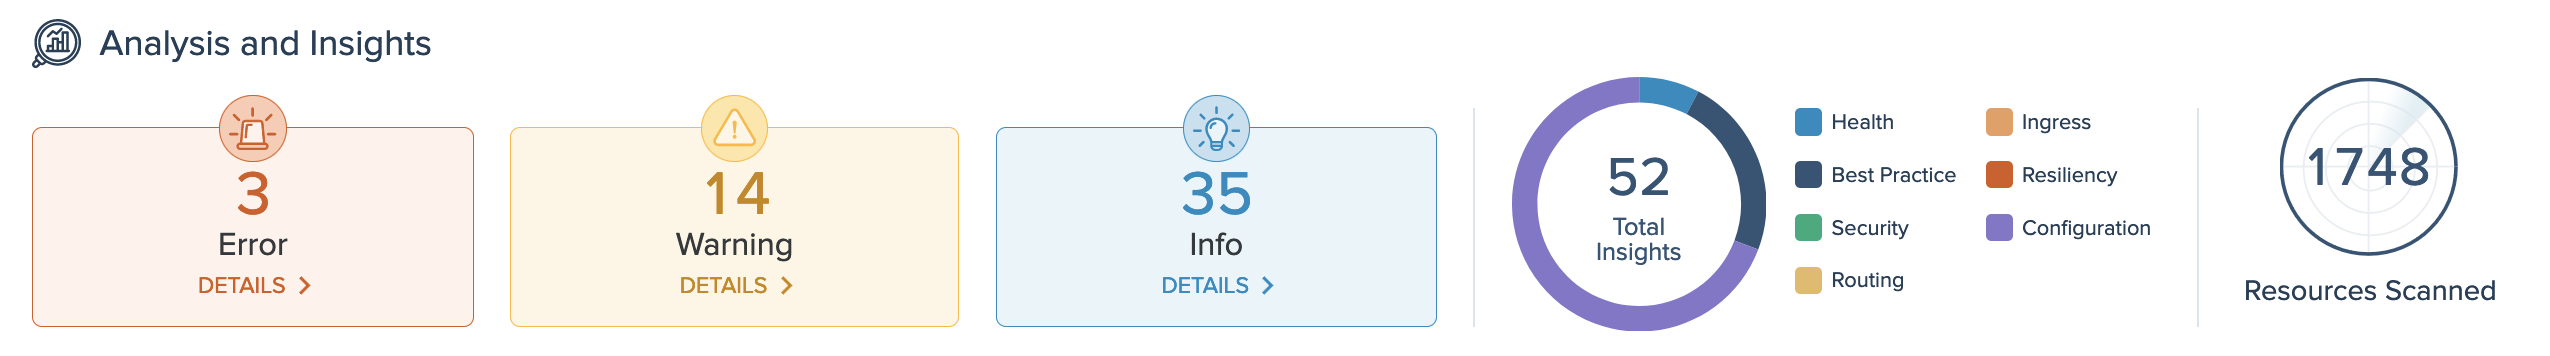
Figure: Insights and analysis card View the list of insights by clicking the Details button, or go to the Insights page.
On the Insights page, you can view recommendations to harden your Istio setup, and steps to implement them in your environment. Gloo Mesh Core analyzes your setup, and returns individual insights that contain information about errors and warnings in your environment, best practices you can use to improve your configuration and security, and more.
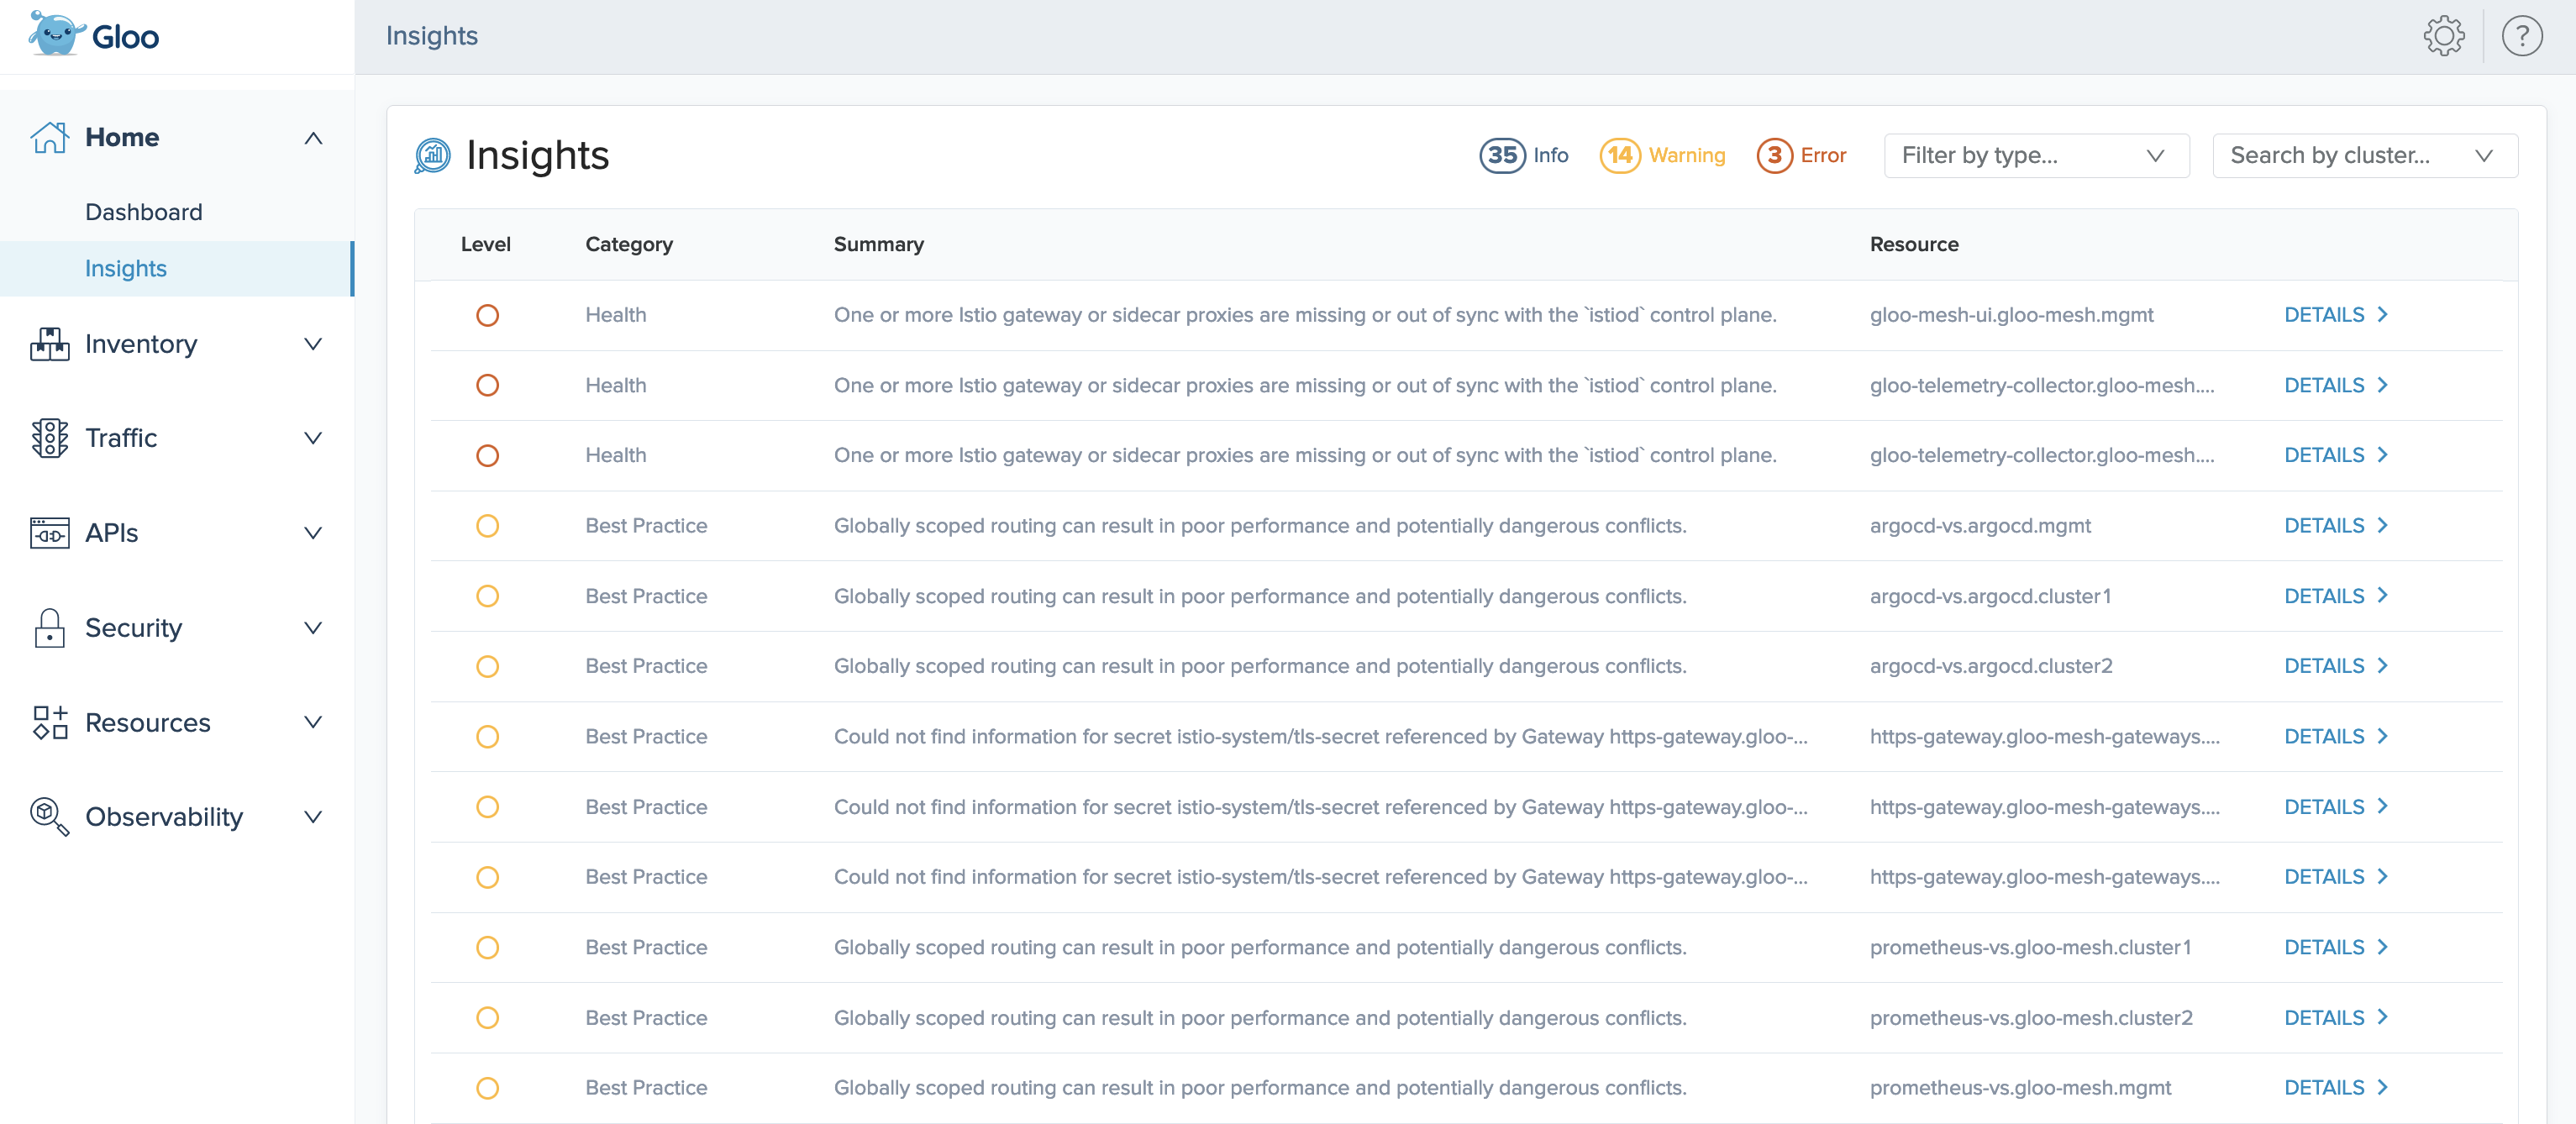
Figure: Insights page On an insight that you want to resolve, click Details. The details modal shows more data about the insight, such as the time when it was last observed in your environment, and if applicable, the extended settings or configuration that the insight applies to.
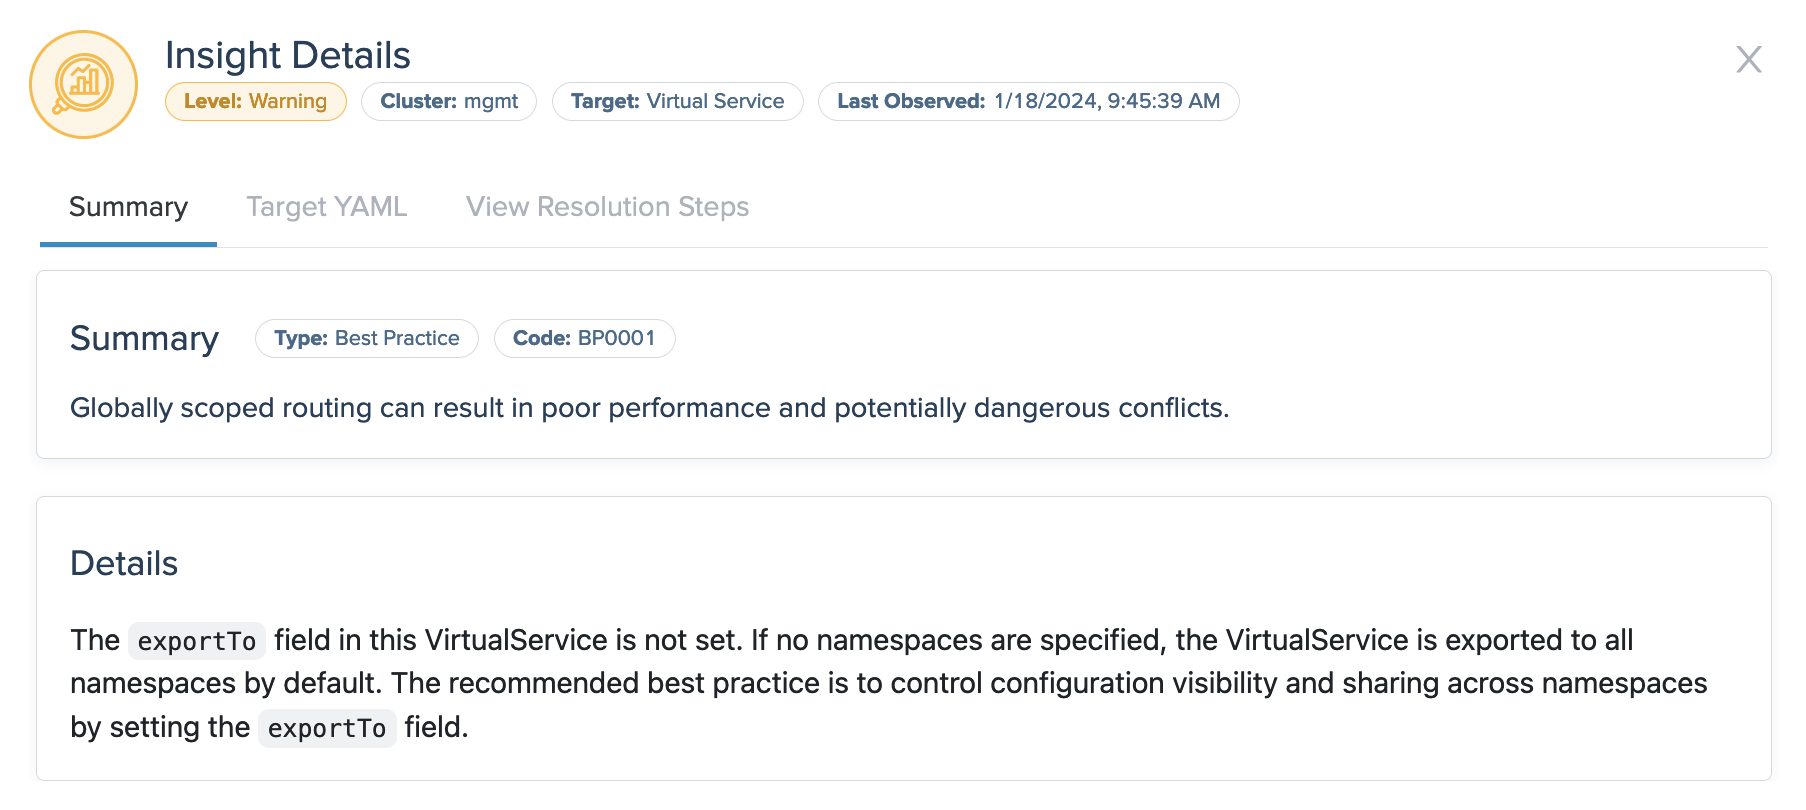
Figure: Example insight Click the Target YAML tab to see the resource file that the insight references, and click the View Resolution Steps tab to see guidance such as steps for fixing warnings and errors in your resource configuration or recommendations for improving your security and setup.
Next steps
Now that you have Gloo Mesh Core and Istio up and running, check out some of the following resources to learn more about Gloo Mesh Core and expand your service mesh capabilities.
Istio:
- Find out more about hardened Istio
n-4version support built into Solo distributions of Istio. - Check out the Istio docs to configure and deploy Istio routing resources.
- Monitor and observe your Istio environment with Gloo Mesh Core’s built-in telemetry tools.
- When it’s time to upgrade Istio, use Gloo Mesh Core to upgrade managed Istio installations.
For ambient installations, see Upgrade ambient service meshes.
Gloo Mesh Core:
- Customize your Gloo Mesh Core installation with a Helm-based setup.
Help and support:
- Talk to an expert to get advice or build out a proof of concept.
- Join the #gloo-mesh channel in the Solo.io community slack.
- Try out one of the Gloo workshops.
Cleanup
If you no longer need this quick-start Gloo Mesh Core environment, you can follow the steps in the uninstall guide.