This doc set is for users of the Gloo Mesh Gateway product to set up an Istio ingress gateway. For users of the Gloo Gateway product to set up an ingress gateway with the Kubernetes Gateway API instead, see the Gloo Gateway docs.
Add Istio request traces
Add request traces to your Gloo telemetry pipeline to observe traffic requests in Jaeger.
The Gloo telemetry pipeline integrates with Jaeger as the tracing platform. Jaeger is an open source tool that helps you follow the path of a request as it is forwarded between microservices. The chain of events and interactions are then captured by the Gloo telemetry pipeline and visualized in the Jaeger UI that is embedded in the Gloo UI. You can use this data to troubleshoot issues in your microservices and identify bottlenecks. You can also forward the traces from the Gloo telemetry gateway to your own Jaeger tracing platform.
This guide assumes that you use the same names for components like clusters, workspaces, and namespaces as in the getting started. If you have different names, make sure to update the sample configuration files in this guide.
Instrument Istio workloads to collect traces by updating your Istio installation. The steps to update Istio vary depending on how you installed Istio.
If you use Gloo-managed Istio and gateway proxies, follow the steps in the Istio lifecycle manager upgrade guide. In the istioOperatorSpec.meshConfig section, add the following configuration to set a sampling rate of 100% of requests. The traces are forwarded to the Gloo telemetry collector agents. For more information about the sampling rate, custom tag, and maximum path length settings, see the Istio tracing configuration docs.
Verify that your configuration is applied in the cluster.
  export REVISION=$(kubectl get pod -L app=istiod -n istio-system -o jsonpath='{.items[0].metadata.labels.istio\.io/rev}')
kubectl get istiooperator istiod-control-plane -n gm-iop-$REVISION -o yaml
Restart the Istio workloads that you want to collect traces for. For example, if you deployed the Bookinfo sample app as part of the Get started guide, you can restart the product page app with the following command.
Refer to the Istio documentation for instructions on how to update your Istio installation. The following example meshConfig options set a sampling rate of 100% of requests. These traces are sent to the Gloo telemetry collector agent.
For more information about the sampling rate, custom tag, and maximum path length settings, see the Istio tracing configuration docs.
Restart the Istio workloads that you want to collect traces for. For example, if you deployed the Bookinfo sample app as part of the Get started guide, you can restart the product page app with the following command.
Step 2: Enable the Jaeger UI and add traces to the pipeline link
Now that your traces are enabled for Istio workloads, you can configure the Gloo telemetry pipeline to collect the traces and provide them to the built-in Jaeger instance that is embedded in to the Gloo UI or forward the traces to your own Jaeger tracing platform.
info
This guide walks you through how to set up tracing with either the built-in or your own Jaeger platform. Use the built-in Jaeger instance testing or demo purposes. If you plan to set up tracing for your production environment, create your own custom tracing pipeline in the Gloo telemetry pipeline to forward traces to a tracing platform that is managed by your organization and hardened for production. Alternatively, you can send production traces to a SaaS backend. Use the steps in Bring your own Jaeger instance as a guide to integrate your own tracing platform.
During your Gloo Mesh Gateway installation, you can enable Jaeger as the tracing platform for your Gloo environment and embed the Jaeger UI in to the Gloo UI.
Get your current installation Helm values, and save them in a file.
  helm get values gloo-platform -n gloo-mesh -o yaml > gloo-single.yaml
open gloo-single.yaml
Add the following settings to enable Jaeger and the built-in traces/istio pipeline. The traces/istio pipeline is set up on the Gloo collector agent and collects traces from Istio-enabled workloads. Traces are sent to the built-in Jaeger tracing platform.
Get the Helm values files for your current version.
Get your current values for the management cluster.
  helm get values gloo-platform -n gloo-mesh -o yaml --kube-context $MGMT_CONTEXT > mgmt-plane.yaml
open mgmt-plane.yaml
Get your current values for the workload clusters.
  helm get values gloo-platform -n gloo-mesh -o yaml --kube-context $REMOTE_CONTEXT > data-plane.yaml
open data-plane.yaml
In the Helm values file for the management cluster, enable the built-in Jaeger platform and the traces/jaeger pipeline to forward traces from the telemetry gateway to the built-in Jaeger platform. Because a Gloo telemetry collector agent is also deployed to the management cluster, you must enable the traces/istio pipeline on the collector for traces to be collected in the management cluster.
In the Helm values file for the workload cluster, enable the traces/istio pipeline to pick up traces from Istio-enabled workloads and forward them to the Gloo telemetry gateway.
Verify that your settings are applied in the management cluster.
Verify that you see a gloo-jaeger deployment in your cluster.
kubectl get deployment gloo-jaeger -n gloo-mesh --context $MGMT_CONTEXT
Verify that the tracing settings were added to the Gloo telemetry collector and gateway configmaps.
  kubectl get configmap gloo-telemetry-collector-config -n gloo-mesh -o yaml --context $MGMT_CONTEXT
kubectl get configmap gloo-telemetry-gateway-config -n gloo-mesh -o yaml --context $MGMT_CONTEXT
Perform a rollout restart of the telemetry gateway deployment and the telemetry collector daemon set to force your configmap changes to be applied to the telemetry gateway and collector agent pods.
Instead of using the built-in Jaeger instance, you can configure the Gloo UI to point to your Jaeger instance instead.
Install or use an existing Jaeger instance. For example, you might follow the Jaeger documentation to set up Jaeger in your cluster. Do not use the jaeger.enabled setting in the Helm values file as this setting enables the built-in Jaeger instance.
Get your current installation Helm values, and save them in a file.
  helm get values gloo-platform -n gloo-mesh -o yaml > gloo-single.yaml
open gloo-single.yaml
In the Helm chart for your management cluster, add the endpoint, port, and base path for your Jaeger instance in the glooUi section to embed the Jaeger UI into the Gloo UI, and disable the Jaeger UI that is automatically built in to Gloo Mesh Gateway. Note that your Jaeger platform must be served from a path that is different from / as this path is reserved for the built-in Jaeger instance in Gloo Mesh Gateway.
To pick up traces from workloads and send them to your Jaeger instance, enable the built-in traces/istio pipeline and add an extra exporter.
Get the Helm values files for your current version.
Get your current values for the management cluster.
  helm get values gloo-platform -n gloo-mesh -o yaml --kube-context $MGMT_CONTEXT > mgmt-plane.yaml
open mgmt-plane.yaml
Get your current values for the workload clusters.
  helm get values gloo-platform -n gloo-mesh -o yaml --kube-context $REMOTE_CONTEXT > data-plane.yaml
open data-plane.yaml
In the Helm chart for your management cluster, add the endpoint, port, and base path for your Jaeger instance in the glooUi section to embed the Jaeger UI into the Gloo UI and disable the Jaeger UI that is automatically built in to Gloo Mesh Gateway. Note that your Jaeger platform must be served from a path that is different from / as this path is reserved for the built-in Jaeger instance in Gloo Mesh Gateway.
To forward traces from the Gloo telemetry gateway to your Jaeger instance, set up an extra exporter on the Gloo telemetry gateway with the details of your Jaeger endpoint, and add that exporter to the default traces/jaeger pipeline in your Helm values file. For more information about how to set up the exporter, see the OTLP gRPC exporter documentation.
To collect traces from workloads in the management cluster, enable the traces/istio pipeline in the Gloo telemetry collector agent.
In the Helm value file for the workload cluster, enable the default traces/istio pipeline in your Helm values file to collect traces from Istio-enabled workloads. The traces/istio pipeline is configured on the Gloo collector agents and sends traces to the Gloo telemetry gateway in the management cluster.
Verify that your settings are applied in the management cluster.
Verify that the tracing settings were added to the Gloo telemetry collector and gateway configmaps.
  kubectl get configmap gloo-telemetry-collector-config -n gloo-mesh -o yaml --context $MGMT_CONTEXT
kubectl get configmap gloo-telemetry-gateway-config -n gloo-mesh -o yaml --context $MGMT_CONTEXT
Perform a rollout restart of the telemetry gateway deployment and the telemetry collector daemon set to force your configmap changes to be applied to the telemetry gateway and collector agent pods.
Open the Gloo UI and verify that traces are collected for your Istio workloads.
Open the Gloo UI.
meshctl dashboard
meshctl dashboard --kubecontext $MGMT_CONTEXT
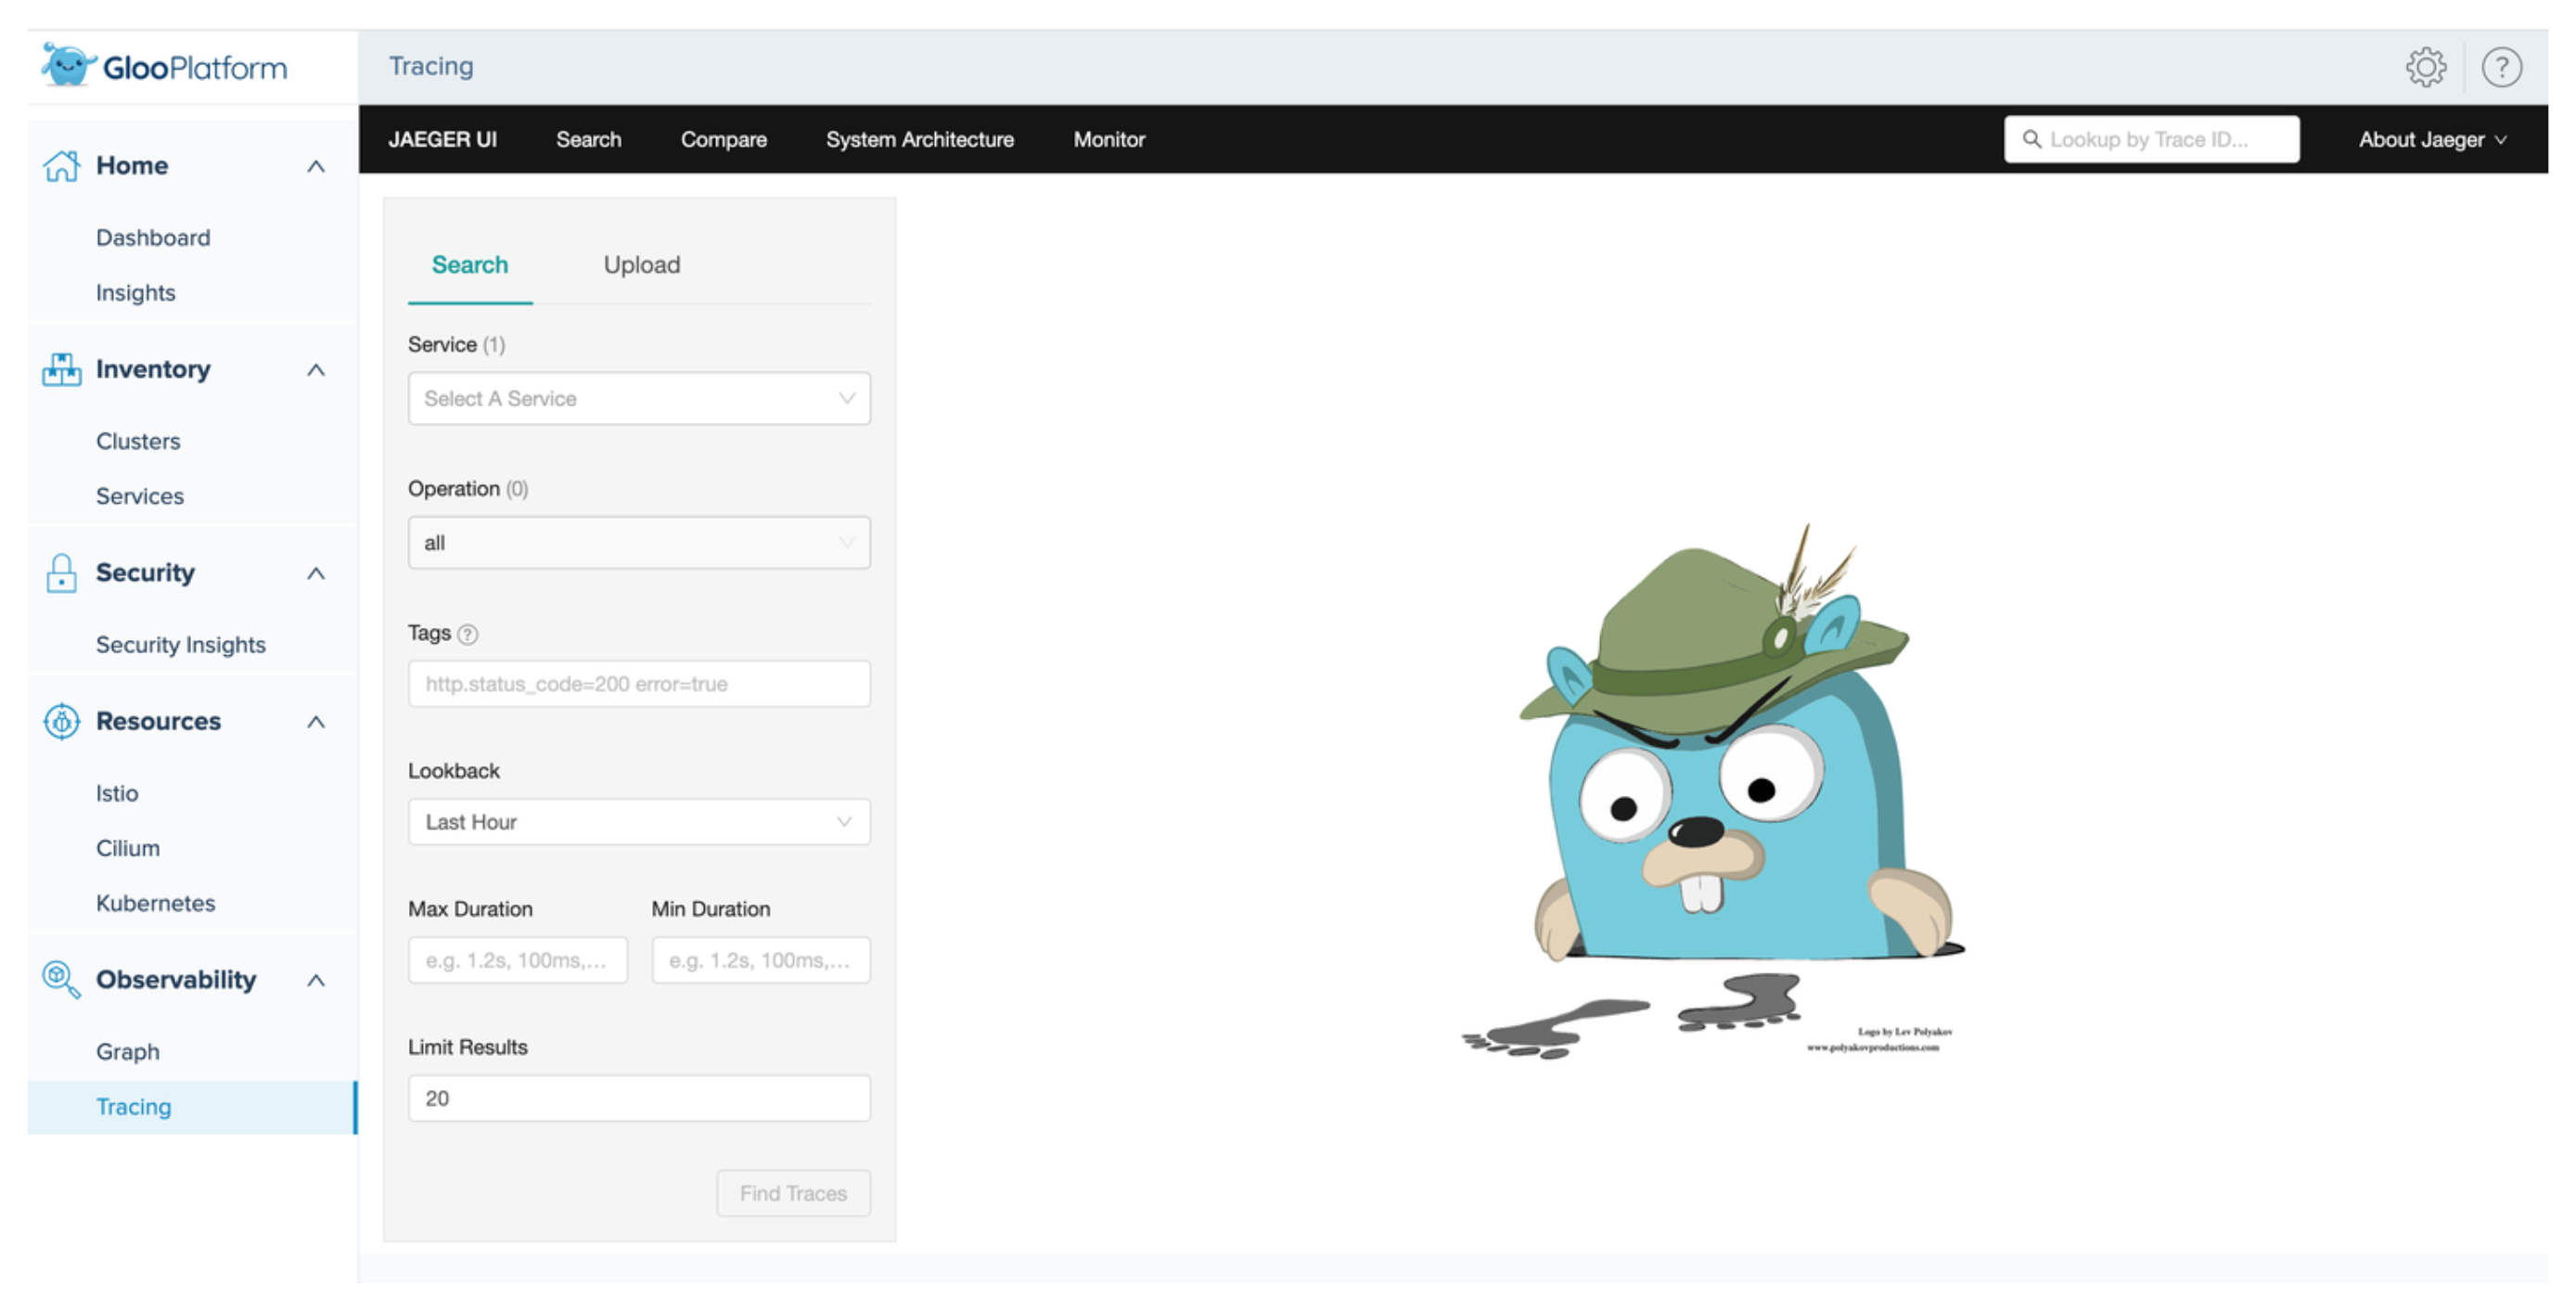
From the menu, select Observability > Tracing and verify that the Jaeger UI opens.
Figure: Jaeger UI
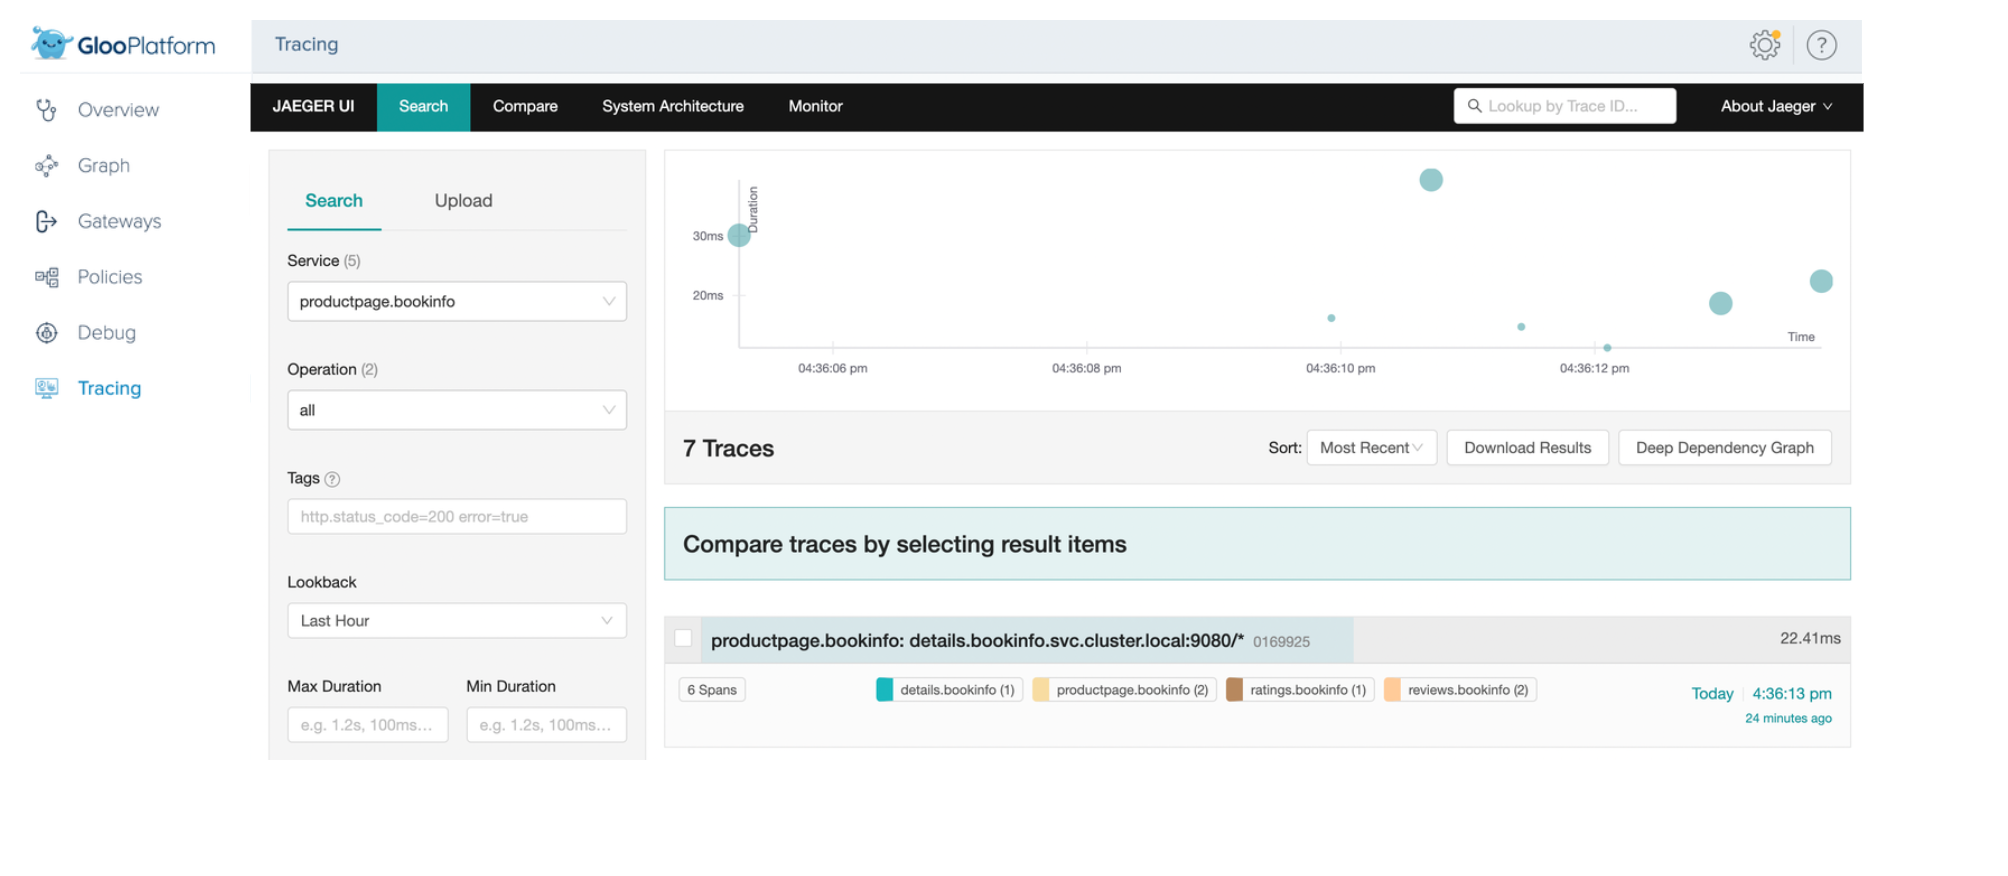
Send a few sample requests to your Istio workloads. Each request produces Istio traces that are sent to the Jaeger instance that you configured. For example, if you deployed the Bookinfo sample app from the Get started guide, use the following steps to produce traces.