Monitor Portal analytics
Check that your Gloo Platform Portal resources are running as expected.
Monitoring helps you verify that the different components you set up for Gloo Platform Portal are running as expected. For example, you can monitor the status of the portal server, portal frontend app, ingress gateway, external auth server, rate limiter, and backing Redis database. Additionally, you can monitor the status of the Gloo custom resources you configured Portal with, including route tables and policies. You can also enable Gloo Platform to log analytics about your portal API products.
Review API usage analytics
Review usage information about the API products that are exposed in your portal. You can review information such as total requests, total users, total services, and error rates.
About analytics
As an API product owner, you can collect analytics about your API usage. This way, you can identify ways to better monetize your API products based on actual usage. You can enable various Gloo Platform features to enable analytics for API products that your portal exposes.
Review the following diagram and description of Portal API Analytics.
When the end user queries one of your APIs, your Gloo Gateway handles the request. You can enable the gateway to generate access logs. This way, the Open Telemetry (OTel) metrics pipeline that you set up can store the access logs in a Clickhouse storage database. As the Portal admin, you can then view usage information for your API products in the Gloo UI through a Grafana dashboard.
The API analytics you can collect from the access logs include the following:
- Total requests of a consumer: Count of all requests from one user email address.
- Average error rate: Percentage of requests with error status codes.
- Total consumers: Count of all requests from distinct user email addresses.
- Total services: Count of all services that receive traffic from users.
Gloo components for Portal analytics
When you install Gloo Platform, you can choose to set up add-ons that extend the functionality of your environment. To use collect API usage analytics for your developer portal, you must install several add-ons and other components as follows. In multicluster setups, you install add-ons in each workload cluster.
- Basic Gloo Platform management and agent installation, including the Istio ingress gateway.
- Portal add-on, including the external auth and rate limiting servers. For more information, see Install Portal.
- OpenTelemetry for log collection. For more information, see Set up the Gloo OpenTelemetry pipeline.
- Clickhouse for storing the access logs.
- Access log format for portal usage analytics in the Istio ingress gateway. For more information, see View access logs.
Before you begin
-
Create or use an existing Kubernetes or OpenShift cluster, and save the name of the cluster as an environment variable. Note: The cluster name must be alphanumeric with no special characters except a hyphen (-), lowercase, and begin with a letter (not a number).
export CLUSTER_NAME=<cluster_name>
-
Set your Gloo Gateway license key as an environment variable. If you do not have one, contact an account representative. If you prefer to specify license keys in a secret instead, see Licensing.
export GLOO_GATEWAY_LICENSE_KEY=<gloo-gateway-license-key>
-
Set the Gloo Gateway version as an environment variable. The latest version is used as an example. You can find other versions in the Changelog documentation. Append ‘-fips’ for a FIPS-compliant image, such as ‘2.4.5-fips’. Do not include
v
before the version number.export GLOO_VERSION=2.4.5
Step 1: Set up Gloo Platform components for portal usage analytics
Follow along with the options to set up the required Portal components to collect API usage analytics:
- Configuring the settings during an initial Gloo Platform installation
- Upgrading an existing installation
Set up Portal during Gloo Platform installation
Set up the required Portal components as part of your initial Gloo Platform installation.
-
Add and update the Helm repository for Gloo Platform.
helm repo add gloo-platform https://storage.googleapis.com/gloo-platform/helm-charts helm repo update
-
Apply the Gloo Platform CRDs to your cluster by creating a
gloo-platform-crds
Helm release. Note: If you plan to manually deploy and manage your Istio installation in workload clusters rather than using the Solo Istio lifecycle manager, include the--set installIstioOperator=false
flag to ensure that the Istio operator CRD is not managed by this Gloo CRD Helm release.helm install gloo-platform-crds gloo-platform/gloo-platform-crds \ --namespace=gloo-mesh \ --create-namespace \ --version $GLOO_VERSION
-
Create a secret with the password to use to store access logs in Clickhouse. This example setup uses the base64-encoded
password
for the value of password. Note that this secret must be in each cluster and namespace where you deploy the Gloo OTel pipeline.cat << EOF | kubectl apply -f - apiVersion: v1 kind: Secret metadata: name: clickhouse-auth namespace: gloo-mesh type: Opaque data: # password = password password: cGFzc3dvcmQ= EOF
-
Create a Helm values file for your Gloo Platform installation.
touch gloo-gateway-single.yaml open gloo-gateway-single.yaml
-
In the Helm values file, include the components needed for Portal analytics and save the file.
clickhouse: enabled: true glooAgent: enabled: true relay: serverAddress: gloo-mesh-mgmt-server.gloo-mesh:9900 glooMgmtServer: serviceType: ClusterIP registerCluster: true enabled: true createGlobalWorkspace: true glooUi: enabled: true istioInstallations: controlPlane: enabled: true installations: - istioOperatorSpec: meshConfig: # Enable access logging to /dev/stdout accessLogFile: /dev/stdout # Encoding for the access log (TEXT or JSON). Default value is TEXT. accessLogEncoding: JSON # If empty, the default log format is used. # See the default log format at https://istio.io/latest/docs/tasks/observability/logs/access-log/#default-access-log-format # To change the format, see https://www.envoyproxy.io/docs/envoy/latest/configuration/observability/access_log/usage#format-rules accessLogFormat: | { "timestamp": "%START_TIME%", "server_name": "%REQ(:AUTHORITY)%", "response_duration": "%DURATION%", "request_command": "%REQ(:METHOD)%", "request_uri": "%REQ(X-ENVOY-ORIGINAL-PATH?:PATH)%", "request_protocol": "%PROTOCOL%", "status_code": "%RESPONSE_CODE%", "client_address": "%DOWNSTREAM_REMOTE_ADDRESS_WITHOUT_PORT%", "x_forwarded_for": "%REQ(X-FORWARDED-FOR)%", "bytes_sent": "%BYTES_SENT%", "bytes_received": "%BYTES_RECEIVED%", "user_agent": "%REQ(USER-AGENT)%", "downstream_local_address": "%DOWNSTREAM_LOCAL_ADDRESS%", "requested_server_name": "%REQUESTED_SERVER_NAME%", "request_id": "%REQ(X-REQUEST-ID)%", "response_flags": "%RESPONSE_FLAGS%", "route_name": "%ROUTE_NAME%", "upstream_cluster": "%UPSTREAM_CLUSTER%", "upstream_host": "%UPSTREAM_HOST%", "upstream_local_address": "%UPSTREAM_LOCAL_ADDRESS%", "upstream_service_time": "%REQ(x-envoy-upstream-service-time)%", "upstream_transport_failure_reason": "%UPSTREAM_TRANSPORT_FAILURE_REASON%", "correlation_id": "%REQ(X-CORRELATION-ID)%", "user_id": "%DYNAMIC_METADATA(envoy.filters.http.ext_authz:userId)%", "api_id": "%DYNAMIC_METADATA(io.solo.gloo.apimanagement:api_id)%", "api_product_id": "%DYNAMIC_METADATA(io.solo.gloo.apimanagement:api_product_id)%", "api_product_name": "%DYNAMIC_METADATA(io.solo.gloo.apimanagement:api_product_name)%", "usage_plan": "%DYNAMIC_METADATA(envoy.filters.http.ext_authz:usagePlan)%", "custom_metadata": "%DYNAMIC_METADATA(io.solo.gloo.apimanagement.custom_metadata)%" } revision: auto enabled: true northSouthGateways: - enabled: true installations: - gatewayRevision: auto istioOperatorSpec: {} name: istio-ingressgateway telemetryCollector: enabled: true presets: logsCollection: enabled: true storeCheckpoints: true config: exporters: otlp: endpoint: gloo-telemetry-gateway.gloo-mesh:4317 telemetryCollectorCustomization: pipelines: logs/istio_access_logs: enabled: true prometheus: enabled: true redis: deployment: enabled: true telemetryGateway: enabled: true service: type: ClusterIP extraEnvs: - name: CLICKHOUSE_PASSWORD valueFrom: secretKeyRef: key: password name: clickhouse-auth telemetryGatewayCustomization: pipelines: logs/clickhouse: enabled: true extraExporters: clickhouse: password: "${env:CLICKHOUSE_PASSWORD}"
For more information, see the Istio on OpenShift documentation.
-
Elevate the permissions of the following service accounts that will be created. These permissions allow the ingress gateway proxy to make use of a user ID that is normally restricted by OpenShift.
oc adm policy add-scc-to-group anyuid system:serviceaccounts:istio-system oc adm policy add-scc-to-group anyuid system:serviceaccounts:gloo-mesh-gateways # Update revision as needed oc adm policy add-scc-to-group anyuid system:serviceaccounts:gm-iop-1-18-3
-
Create the
gloo-mesh-gateways
project, and create a NetworkAttachmentDefinition custom resource for the project.kubectl create ns gloo-mesh-gateways cat <<EOF | oc -n gloo-mesh-gateways create -f - apiVersion: "k8s.cni.cncf.io/v1" kind: NetworkAttachmentDefinition metadata: name: istio-cni EOF
-
Elevate the permissions of the service account in each project where you want to deploy workloads.
oc adm policy add-scc-to-group anyuid system:serviceaccounts:<project>
-
Create a NetworkAttachmentDefinition custom resource for each project where you want to deploy workloads.
cat <<EOF | oc -n <project> create -f - apiVersion: "k8s.cni.cncf.io/v1" kind: NetworkAttachmentDefinition metadata: name: istio-cni EOF
-
Prepare the
gloo-gateway-single
values file.clickhouse: enabled: true glooAgent: enabled: true floatingUserId: true relay: serverAddress: gloo-mesh-mgmt-server.gloo-mesh:9900 glooMgmtServer: enabled: true floatingUserId: true registerCluster: true serviceType: ClusterIP createGlobalWorkspace: true glooUi: enabled: true floatingUserId: true istioInstallations: controlPlane: enabled: true installations: - clusters: null istioOperatorSpec: components: # Openshift requires the Istio CNI feature to be enabled cni: enabled: true namespace: kube-system k8s: overlays: - kind: DaemonSet name: istio-cni-node patches: - path: spec.template.spec.containers[0].securityContext.privileged value: true pilot: k8s: env: - name: PILOT_ENABLE_K8S_SELECT_WORKLOAD_ENTRIES value: "false" - name: PILOT_SKIP_VALIDATE_TRUST_DOMAIN value: "true" meshConfig: accessLogFile: /dev/stdout accessLogEncoding: JSON defaultConfig: envoyAccessLogService: address: gloo-mesh-agent.gloo-mesh:9977 holdApplicationUntilProxyStarts: true proxyMetadata: ISTIO_META_DNS_AUTO_ALLOCATE: "true" ISTIO_META_DNS_CAPTURE: "true" outboundTrafficPolicy: mode: ALLOW_ANY rootNamespace: istio-system accessLogFormat: | { "timestamp": "%START_TIME%", "server_name": "%REQ(:AUTHORITY)%", "response_duration": "%DURATION%", "request_command": "%REQ(:METHOD)%", "request_uri": "%REQ(X-ENVOY-ORIGINAL-PATH?:PATH)%", "request_protocol": "%PROTOCOL%", "status_code": "%RESPONSE_CODE%", "client_address": "%DOWNSTREAM_REMOTE_ADDRESS_WITHOUT_PORT%", "x_forwarded_for": "%REQ(X-FORWARDED-FOR)%", "bytes_sent": "%BYTES_SENT%", "bytes_received": "%BYTES_RECEIVED%", "user_agent": "%REQ(USER-AGENT)%", "downstream_local_address": "%DOWNSTREAM_LOCAL_ADDRESS%", "requested_server_name": "%REQUESTED_SERVER_NAME%", "request_id": "%REQ(X-REQUEST-ID)%", "response_flags": "%RESPONSE_FLAGS%", "route_name": "%ROUTE_NAME%", "upstream_cluster": "%UPSTREAM_CLUSTER%", "upstream_host": "%UPSTREAM_HOST%", "upstream_local_address": "%UPSTREAM_LOCAL_ADDRESS%", "upstream_service_time": "%REQ(x-envoy-upstream-service-time)%", "upstream_transport_failure_reason": "%UPSTREAM_TRANSPORT_FAILURE_REASON%", "correlation_id": "%REQ(X-CORRELATION-ID)%", "user_id": "%DYNAMIC_METADATA(envoy.filters.http.ext_authz:userId)%", "api_id": "%DYNAMIC_METADATA(io.solo.gloo.apimanagement:api_id)%", "api_product_id": "%DYNAMIC_METADATA(io.solo.gloo.apimanagement:api_product_id)%", "api_product_name": "%DYNAMIC_METADATA(io.solo.gloo.apimanagement:api_product_name)%", "usage_plan": "%DYNAMIC_METADATA(envoy.filters.http.ext_authz:usagePlan)%", "custom_metadata": "%DYNAMIC_METADATA(io.solo.gloo.apimanagement.custom_metadata)%" } name: istio-ingressgateway namespace: istio-system # Openshift-specific installation (https://istio.io/latest/docs/setup/additional-setup/config-profiles/) # Note: This profile is currently required to install the istio-cni profile: openshift values: # CNI options for OpenShift cni: cniBinDir: /var/lib/cni/bin cniConfDir: /etc/cni/multus/net.d chained: false cniConfFileName: "istio-cni.conf" excludeNamespaces: - istio-system - kube-system logLevel: info sidecarInjectorWebhook: injectedAnnotations: k8s.v1.cni.cncf.io/networks: istio-cni revision: auto eastWestGateways: null enabled: true northSouthGateways: - enabled: true installations: - clusters: null gatewayRevision: auto istioOperatorSpec: {} name: istio-ingressgateway namespace: gloo-mesh-gateways prometheus: enabled: true redis: deployment: enabled: true floatingUserId: true telemetryCollector: config: exporters: otlp: endpoint: gloo-telemetry-gateway.gloo-mesh:4317 enabled: true presets: logsCollection: enabled: true storeCheckpoints: true telemetryCollectorCustomization: pipelines: logs/istio_access_logs: enabled: true telemetryGateway: enabled: true service: type: ClusterIP extraEnvs: - name: CLICKHOUSE_PASSWORD valueFrom: secretKeyRef: key: password name: clickhouse-auth telemetryGatewayCustomization: pipelines: logs/clickhouse: enabled: true extraExporters: clickhouse: password: "${env:CLICKHOUSE_PASSWORD}"
Note: When you use the settings in this profile to install Gloo Platform in OpenShift 4.11 and later, you might see warnings for the pods and containers which violate the OpenShift
PodSecurity "restricted:v1.24"
profile, due to the elevated permissions required by Istio. You can ignore these warnings. For more info, see this article.
-
-
Create another Helm values file for the add-ons that you need.
touch gloo-gateway-addons.yaml open gloo-gateway-addons.yaml
-
In the Helm values file, include including the external auth service, rate limiter, and portal server, and save the file. The following example also sets up the local Redis instance to be used for backing storage for the servers. For more backing storage options such as to bring your own Redis with auth, see Portal server.
common: addonNamespace: gloo-mesh-addons extAuthService: enabled: true extAuth: apiKeyStorage: name: redis enabled: true config: host: "redis.gloo-mesh-addons:6379" db: 0 secretKey: "ThisIsSecret" glooPortalServer: enabled: true apiKeyStorage: redis: enabled: true address: redis.gloo-mesh-addons:6379 configPath: /etc/redis-client-config/config.yaml secretKey: "ThisIsSecret" rateLimiter: enabled: true
-
Install the Gloo Platform control plane and data plane components in your cluster, including the customizations in your Helm values file.
helm install gloo-platform gloo-platform/gloo-platform \ --namespace gloo-mesh \ --version $GLOO_VERSION \ --values gloo-gateway-single.yaml \ --set common.cluster=$CLUSTER_NAME \ --set licensing.glooGatewayLicenseKey=$GLOO_GATEWAY_LICENSE_KEY
-
Install the Gloo Platform add-ons in a separate Helm release.
helm install gloo-agent-addons gloo-platform/gloo-platform \ --namespace gloo-mesh-addons \ --create-namespace \ --version $GLOO_VERSION \ --set common.cluster=$CLUSTER_NAME \ --values gloo-gateway-addons.yaml
- Elevate the permissions of the
gloo-telemetry-collector
and thegloo-mesh-addons
service account that will be created.oc adm policy add-scc-to-group anyuid system:serviceaccounts:gloo-mesh-addons oc adm policy add-scc-to-user hostmount-anyuid -z gloo-telemetry-collector -n gloo-mesh
- Create the
gloo-mesh-addons
project, and create a NetworkAttachmentDefinition custom resource for the project.kubectl create ns gloo-mesh-addons cat <<EOF | oc -n gloo-mesh-addons create -f - apiVersion: "k8s.cni.cncf.io/v1" kind: NetworkAttachmentDefinition metadata: name: istio-cni EOF
- Create the add-ons release.
helm install gloo-agent-addons gloo-platform/gloo-platform \ --namespace gloo-mesh-addons \ --version $GLOO_VERSION \ --set common.cluster=$CLUSTER_NAME \ --values gloo-gateway-addons.yaml
- Elevate the permissions of the
-
Verify that Portal and the related components are installed.
meshctl check
In the example output, make sure that the portal, external auth, and rate limiting servers and all of the core Gloo Platform components are healthy.
🟢 Gloo Platform License Status INFO gloo-gateway enterprise license expires on 05 Nov 23 14:18 EST 🟢 CRD Version check 🟢 Gloo Platform Deployment Status Namespace | Name | Ready | Status gloo-mesh | gloo-mesh-agent | 1/1 | Healthy gloo-mesh | gloo-mesh-mgmt-server | 1/1 | Healthy gloo-mesh | gloo-mesh-redis | 1/1 | Healthy gloo-mesh | gloo-mesh-ui | 1/1 | Healthy gloo-mesh | gloo-telemetry-gateway | 1/1 | Healthy gloo-mesh | prometheus-server | 1/1 | Healthy gloo-mesh-addons | ext-auth-service | 1/1 | Healthy gloo-mesh-addons | gloo-mesh-portal-server | 1/1 | Healthy gloo-mesh-addons | rate-limiter | 1/1 | Healthy gloo-mesh-addons | redis | 1/1 | Healthy gloo-mesh | gloo-telemetry-collector-agent | 3/3 | Healthy 🟢 Mgmt server connectivity to workload agents Cluster | Registered | Connected Pod cluster1 | true | gloo-mesh/gloo-mesh-mgmt-server-65bd557b95-v8qq6
-
Verify that the gateway proxy service is created and assigned an external IP address. It might take a few minutes for the load balancer to deploy.
kubectl get svc -n gloo-mesh-gateways
Example output:
NAME TYPE CLUSTER-IP EXTERNAL-IP PORT(S) AGE istio-ingressgateway LoadBalancer 10.XX.XXX.XXX 35.XXX.XXX.XXX 15021:30826/TCP,80:31257/TCP,443:30673/TCP,15443:30789/TCP 48s
Now that your Gloo Platform components for Portal are installed, set up Grafana.
Set up Portal by upgrading Gloo Platform
Set up the required Portal components by upgrading your existing Gloo Platform installation.
The following steps upgrade an existing Helm release to make sure that the required external auth, rate limiting, and portal servers are set up. The steps do not upgrade the Gloo Platform management server or agent versions or otherwise change the components.
-
Check the Helm releases in your cluster. Depending on your installation method, you either have only a main installation release (such as
gloo-platform
), or a main installation and a separate add-ons release (such asgloo-agent-addons
), in addition to your CRDs release.helm list --all-namespaces
Example of separate releases for platform and add-ons:
NAME NAMESPACE REVISION UPDATED STATUS CHART gloo-agent-addons gloo-mesh-addons 1 2023-09-01 13:29:03.136686 -0400 EDT deployed gloo-platform-2.4.0 gloo-platform gloo-mesh 1 2023-09-01 13:26:56.061102 -0400 EDT deployed gloo-platform-2.4.0 gloo-platform-crds gloo-mesh 1 2023-09-01 13:23:56.061102 -0400 EDT deployed gloo-platform-crds-2.4.0
-
Get your current installation values.
-
If you have only one release for your installation, get those values. Note that if you migrated from the legacy Helm charts, your Helm release might be named
gloo-mgmt
orgloo-mesh-enterprise
instead.helm get values gloo-platform -n gloo-mesh > gloo-gateway-single.yaml open gloo-gateway-single.yaml
-
If you have a separate add-ons release, get those values.
helm get values gloo-agent-addons -n gloo-mesh-addons > gloo-agent-addons.yaml open gloo-agent-addons.yaml
-
-
Delete the first line that contains
USER-SUPPLIED VALUES:
, and save the file. -
Add or edit the following settings for the required add-ons, including the external auth, rate limiting, and portal servers. The following example also sets up the local Redis instance to be used for backing storage for the servers. For more backing storage options, see Portal backing databases.
Note that the analytics enablement is only in the
gloo-platform
Helm values file.gloo-platform
Helm values file: Update the values file, such as to match the following example.clickhouse
to store the access logs.istioInstallations
with the Portal access log formats.telemetryCollector
to collect access logs.telemetryCollectorCustomization
to enable the Istio access logs pipeline.telemetryGateway
to enable the Gloo telemetry gateway, including to refer to the secret with the Clickhouse password that you previously created.telemetryGatewayCustomization
to set up the Clickhouse logs pipeline, including the Clickhouse password.
gloo-agent-addons
Helm values file: Update the values file to include the external auth service, rate limiter, and portal server.
gloo-platform
Helm values file:common: cluster: $CLUSTER_NAME clickhouse: enabled: true glooAgent: enabled: true relay: serverAddress: gloo-mesh-mgmt-server.gloo-mesh:9900 glooMgmtServer: serviceType: ClusterIP registerCluster: true enabled: true createGlobalWorkspace: true glooUi: enabled: true istioInstallations: controlPlane: enabled: true installations: - istioOperatorSpec: meshConfig: # Enable access logging to /dev/stdout accessLogFile: /dev/stdout # Encoding for the access log (TEXT or JSON). Default value is TEXT. accessLogEncoding: JSON # If empty, the default log format is used. # See the default log format at https://istio.io/latest/docs/tasks/observability/logs/access-log/#default-access-log-format # To change the format, see https://www.envoyproxy.io/docs/envoy/latest/configuration/observability/access_log/usage#format-rules accessLogFormat: | { "timestamp": "%START_TIME%", "server_name": "%REQ(:AUTHORITY)%", "response_duration": "%DURATION%", "request_command": "%REQ(:METHOD)%", "request_uri": "%REQ(X-ENVOY-ORIGINAL-PATH?:PATH)%", "request_protocol": "%PROTOCOL%", "status_code": "%RESPONSE_CODE%", "client_address": "%DOWNSTREAM_REMOTE_ADDRESS_WITHOUT_PORT%", "x_forwarded_for": "%REQ(X-FORWARDED-FOR)%", "bytes_sent": "%BYTES_SENT%", "bytes_received": "%BYTES_RECEIVED%", "user_agent": "%REQ(USER-AGENT)%", "downstream_local_address": "%DOWNSTREAM_LOCAL_ADDRESS%", "requested_server_name": "%REQUESTED_SERVER_NAME%", "request_id": "%REQ(X-REQUEST-ID)%", "response_flags": "%RESPONSE_FLAGS%", "route_name": "%ROUTE_NAME%", "upstream_cluster": "%UPSTREAM_CLUSTER%", "upstream_host": "%UPSTREAM_HOST%", "upstream_local_address": "%UPSTREAM_LOCAL_ADDRESS%", "upstream_service_time": "%REQ(x-envoy-upstream-service-time)%", "upstream_transport_failure_reason": "%UPSTREAM_TRANSPORT_FAILURE_REASON%", "correlation_id": "%REQ(X-CORRELATION-ID)%", "user_id": "%DYNAMIC_METADATA(envoy.filters.http.ext_authz:userId)%", "api_id": "%DYNAMIC_METADATA(io.solo.gloo.apimanagement:api_id)%", "api_product_id": "%DYNAMIC_METADATA(io.solo.gloo.apimanagement:api_product_id)%", "api_product_name": "%DYNAMIC_METADATA(io.solo.gloo.apimanagement:api_product_name)%", "usage_plan": "%DYNAMIC_METADATA(envoy.filters.http.ext_authz:usagePlan)%", "custom_metadata": "%DYNAMIC_METADATA(io.solo.gloo.apimanagement.custom_metadata)%" } revision: auto enabled: true northSouthGateways: - enabled: true installations: - gatewayRevision: auto istioOperatorSpec: {} name: istio-ingressgateway telemetryCollector: enabled: true presets: logsCollection: enabled: true storeCheckpoints: true telemetryCollectorCustomization: pipelines: logs/istio_access_logs: enabled: true prometheus: enabled: true redis: deployment: enabled: true telemetryGateway: enabled: true service: type: ClusterIP extraEnvs: - name: CLICKHOUSE_PASSWORD valueFrom: secretKeyRef: key: password name: clickhouse-auth telemetryGatewayCustomization: pipelines: logs/clickhouse: enabled: true extraExporters: clickhouse: password: "${env:CLICKHOUSE_PASSWORD}"
gloo-agent-addons
Helm values file:common: addonNamespace: gloo-mesh-addons extAuthService: enabled: true extAuth: apiKeyStorage: name: redis enabled: true config: host: "redis.gloo-mesh-addons:6379" db: 0 secretKey: "ThisIsSecret" glooPortalServer: enabled: true apiKeyStorage: redis: enabled: true address: redis.gloo-mesh-addons:6379 configPath: /etc/redis-client-config/config.yaml secretKey: "ThisIsSecret" rateLimiter: enabled: true
Update the values file, such as to match the following example.
clickhouse
to store the access logs.extAuthService
to configure the external auth service to share the same backing Redis instance as the Portal server.glooPortalServer
to configure the Portal to share the same backing Redis instance as the external auth service.istioInstallations
with the Portal access log formats.rateLimiter
to enable for usage plans.telemetryCollector
to collect access logs.telemetryCollectorCustomization
to enable the Istio access logs pipeline.telemetryGateway
to enable the Gloo telemetry gateway, including to refer to the secret with the Clickhouse password that you previously created.telemetryGatewayCustomization
to set up the Clickhouse logs pipeline, including the Clickhouse password.
common: cluster: $CLUSTER_NAME clickhouse: enabled: true glooAgent: enabled: true relay: serverAddress: gloo-mesh-mgmt-server.gloo-mesh:9900 glooMgmtServer: serviceType: ClusterIP registerCluster: true enabled: true createGlobalWorkspace: true glooUi: enabled: true istioInstallations: controlPlane: enabled: true installations: - istioOperatorSpec: meshConfig: # Enable access logging to /dev/stdout accessLogFile: /dev/stdout # Encoding for the access log (TEXT or JSON). Default value is TEXT. accessLogEncoding: JSON # If empty, the default log format is used. # See the default log format at https://istio.io/latest/docs/tasks/observability/logs/access-log/#default-access-log-format # To change the format, see https://www.envoyproxy.io/docs/envoy/latest/configuration/observability/access_log/usage#format-rules accessLogFormat: | { "timestamp": "%START_TIME%", "server_name": "%REQ(:AUTHORITY)%", "response_duration": "%DURATION%", "request_command": "%REQ(:METHOD)%", "request_uri": "%REQ(X-ENVOY-ORIGINAL-PATH?:PATH)%", "request_protocol": "%PROTOCOL%", "status_code": "%RESPONSE_CODE%", "client_address": "%DOWNSTREAM_REMOTE_ADDRESS_WITHOUT_PORT%", "x_forwarded_for": "%REQ(X-FORWARDED-FOR)%", "bytes_sent": "%BYTES_SENT%", "bytes_received": "%BYTES_RECEIVED%", "user_agent": "%REQ(USER-AGENT)%", "downstream_local_address": "%DOWNSTREAM_LOCAL_ADDRESS%", "requested_server_name": "%REQUESTED_SERVER_NAME%", "request_id": "%REQ(X-REQUEST-ID)%", "response_flags": "%RESPONSE_FLAGS%", "route_name": "%ROUTE_NAME%", "upstream_cluster": "%UPSTREAM_CLUSTER%", "upstream_host": "%UPSTREAM_HOST%", "upstream_local_address": "%UPSTREAM_LOCAL_ADDRESS%", "upstream_service_time": "%REQ(x-envoy-upstream-service-time)%", "upstream_transport_failure_reason": "%UPSTREAM_TRANSPORT_FAILURE_REASON%", "correlation_id": "%REQ(X-CORRELATION-ID)%", "user_id": "%DYNAMIC_METADATA(envoy.filters.http.ext_authz:userId)%", "api_id": "%DYNAMIC_METADATA(io.solo.gloo.apimanagement:api_id)%", "api_product_id": "%DYNAMIC_METADATA(io.solo.gloo.apimanagement:api_product_id)%", "api_product_name": "%DYNAMIC_METADATA(io.solo.gloo.apimanagement:api_product_name)%", "usage_plan": "%DYNAMIC_METADATA(envoy.filters.http.ext_authz:usagePlan)%", "custom_metadata": "%DYNAMIC_METADATA(io.solo.gloo.apimanagement.custom_metadata)%" } revision: auto enabled: true northSouthGateways: - enabled: true installations: - gatewayRevision: auto istioOperatorSpec: {} name: istio-ingressgateway telemetryCollector: presets: logsCollection: enabled: true storeCheckpoints: true enabled: true telemetryCollectorCustomization: pipelines: logs/istio_access_logs: enabled: true prometheus: enabled: true redis: deployment: enabled: true telemetryGateway: enabled: true service: type: ClusterIP extraEnvs: - name: CLICKHOUSE_PASSWORD valueFrom: secretKeyRef: key: password name: clickhouse-auth telemetryGatewayCustomization: pipelines: logs/clickhouse: enabled: true extraExporters: clickhouse: password: "${env:CLICKHOUSE_PASSWORD}" extAuthService: enabled: true extAuth: apiKeyStorage: # Use the local gloo-mesh-addons Redis for backing storage name: redis enabled: true config: host: "redis.gloo-mesh-addons:6379" # Set to 0 to match the default database for the 'glooPortalServer.apiKeyStorage' configuration db: 0 # Replace with a random string to use to generate hash values for other keys secretKey: "ThisIsSecret" glooPortalServer: enabled: true apiKeyStorage: # Use the local gloo-mesh-addons Redis for backing storage redis: enabled: true address: redis.gloo-mesh-addons:6379 # Path for API key storage config file in the gloo-mesh-addons backing Redis configPath: /etc/redis-client-config/config.yaml # Replace with a random string to use to generate hash values for other keys secretKey: "ThisIsSecret" rateLimiter: enabled: true
-
Upgrade your Helm release with the Helm values that you previously prepared.
- If you have only one release for your installation, upgrade the
gloo-platform
release.helm upgrade gloo-platform gloo-platform/gloo-platform \ --namespace gloo-mesh \ -f gloo-gateway-single.yaml \ --version $GLOO_VERSION
- If you have a separate add-ons release, upgrade the
gloo-agent-addons
release as well.helm upgrade gloo-agent-addons gloo-platform/gloo-platform \ --namespace gloo-mesh-addons \ -f gloo-agent-addons.yaml \ --version $GLOO_VERSION
- If you have only one release for your installation, upgrade the
-
Verify that Portal and the related components are installed.
meshctl check
In the example output, make sure that the portal, external auth, and rate limiting servers and all of the core Gloo Gateway components are healthy.
🟢 Gloo Platform License Status INFO gloo-gateway enterprise license expires on 05 Nov 23 14:18 EST 🟢 CRD Version check 🟢 Gloo Platform Deployment Status Namespace | Name | Ready | Status gloo-mesh | gloo-mesh-agent | 1/1 | Healthy gloo-mesh | gloo-mesh-mgmt-server | 1/1 | Healthy gloo-mesh | gloo-mesh-redis | 1/1 | Healthy gloo-mesh | gloo-mesh-ui | 1/1 | Healthy gloo-mesh | gloo-telemetry-gateway | 1/1 | Healthy gloo-mesh | prometheus-server | 1/1 | Healthy gloo-mesh-addons | ext-auth-service | 1/1 | Healthy gloo-mesh-addons | gloo-mesh-portal-server | 1/1 | Healthy gloo-mesh-addons | rate-limiter | 1/1 | Healthy gloo-mesh-addons | redis | 1/1 | Healthy gloo-mesh | gloo-telemetry-collector-agent | 3/3 | Healthy 🟢 Mgmt server connectivity to workload agents Cluster | Registered | Connected Pod cluster1 | true | gloo-mesh/gloo-mesh-mgmt-server-65bd557b95-v8qq6
Now that your Gloo Platform components for Portal are installed, set up Grafana.
Step 2: Set up Grafana to use Clickhouse
You installed or upgraded Gloo Platform with the add-ons to run the developer portal and collect access logs for your APIs. Now, you can configure a Grafana instance to pull the data stored in Clickhouse.
- Verify that the Clickhouse resources are healthy.
kubectl get all -A -l app.kubernetes.io/name=clickhouse
- Install or upgrade Grafana to use the Clickhouse database, such as with the following commands. Note that the Clickhouse password matches the password of the secret that you previously created.
helm repo add prometheus-community https://prometheus-community.github.io/helm-charts helm repo update helm upgrade --install kube-prometheus-stack \ prometheus-community/kube-prometheus-stack \ --version 30.0.3 \ --namespace monitoring \ --create-namespace \ --set "grafana.additionalDataSources[0].secureJsonData.password=$(kubectl get secret clickhouse-auth -n gloo-mesh -o jsonpath='{.data.password}' | base64 -d)" \ --values - <<EOF grafana: service: type: LoadBalancer plugins: - grafana-clickhouse-datasource additionalDataSources: - name: ClickHouse type: grafana-clickhouse-datasource isDefault: false uid: clickhouse-access-logs jsonData: defaultDatabase: default port: 9000 server: clickhouse.gloo-mesh username: default tlsSkipVerify: true EOF
- Verify that the Grafana deployment and the rest of the Prometheus stack is healthy.
kubectl get pods -n monitoring
If Clickhouse or Grafana are not healthy, try the Debugging steps.
Now that your Gloo Platform components are set up, you can add the Grafana dashboard for portal usage analytics.
Step 3: Add the portal usage analytics dashboard to Grafana
You can use the sample Gloo Platform Portal API analytics dashboard to monitor portal usage.
- Set up port forwarding on your local machine to access the Grafana dashboard.
kubectl port-forward $(kubectl get pods -n monitoring -o name | grep grafana) 8080:3000 -n monitoring
- Open the Grafana dashboard in your web browser.
- Log in to the Grafana dashboard with
admin
as the username, andprom-operator
as the password. These are the default credentials that are set by the Prometheus community chart. You can change these credentials when you log in to Grafana. - Import the Gloo Platform Portal API analytics dashboard.
- Download the JSON file that holds the configuration for the Gloo Platform Portal API analytics dashboard.
- From the Grafana menu, select
+
> Import. - Click Upload JSON file and select the file for the API analytics dashboard that you downloaded.
- Click Import to open the API analytics dashboard.
Good job! You set up the Grafana dashboard to monitor the API usage of your developer portal.
Step 4: Monitor API usage with the Grafana dashboard
With Portal and the related logging components installed, you can monitor the API usage in developer portal.
- Create your API products.
- Prepare usage plans for your API products.
- Configure a developer portal.
- Generate traffic to your API products, either from your users or such as with the following example request to the Tracks API product .
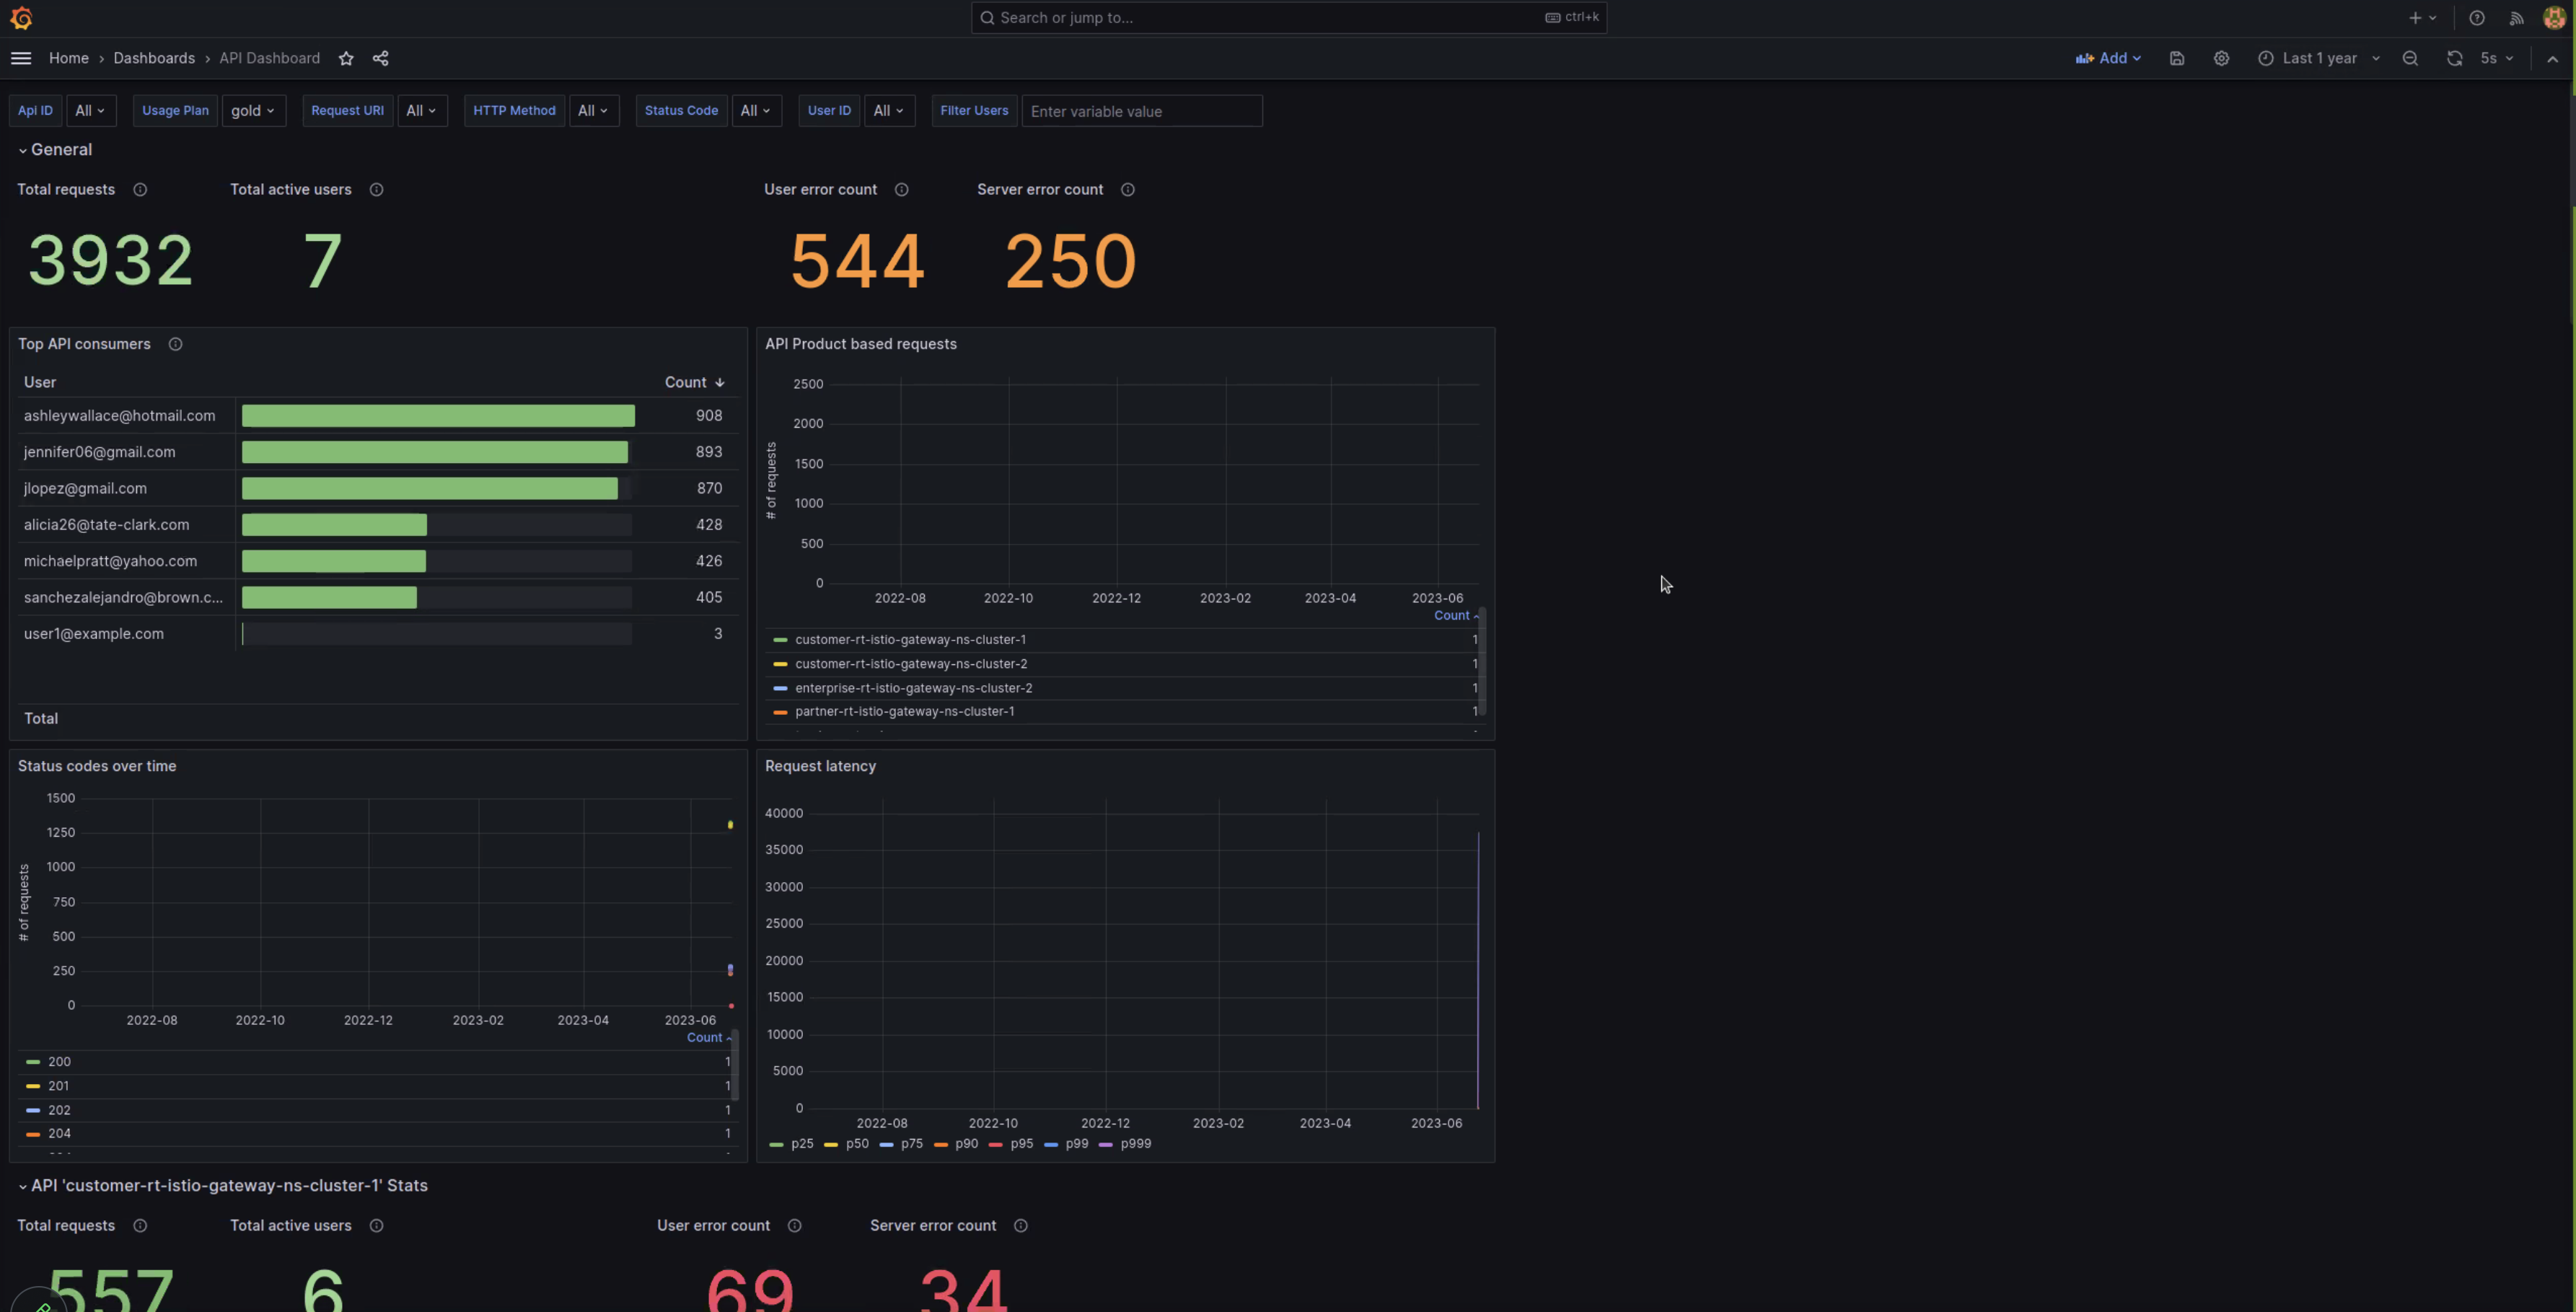
curl -v --resolve api.example.com:80:${INGRESS_GW_IP} http://api.example.com/trackapi/tracks
- Explore the API usage analytics, such as in the following example. You can filter by several properties, such as APIs, usage plans, methods, status codes, and more.
Other monitoring tools
To help you monitor your environment, Gloo Platform provides several tools as follows:
- Gloo UI, which features tabs to help debug your gateways, APIs, portals, and policies.
- Global status reporting on Gloo custom resources, including whether the resource is accepted.
- Logs for the deployments, such as the portal server or ingress gateway.
- API usage analytics for the API products that are exposed in your developer portal.
- Troubleshooting documentation for Gloo Platform, including a debug guide for portal API usage analytics.