Explore the UI
After connecting to the Gloo UI, explore the basic layout. Review your Gloo Mesh Gateway components, Istio workloads, insights, your security posture, and more.
Launch the UI
The Gloo UI is served from the gloo-mesh-ui service on port 8090. When you have access to the management cluster, you can launch the Gloo UI from your local machine. You can connect by using the meshctl or kubectl CLIs.
Open the Gloo UI. The Gloo UI is served from the
gloo-mesh-uiservice on port 8090. You can connect by using themeshctlorkubectlCLIs.- Optional: If authentication is enabled, sign in.
- Review the dashboard.
Home
View the health and performance of your Gloo Mesh Enterprise components and Istio workloads by using the Dashboard.
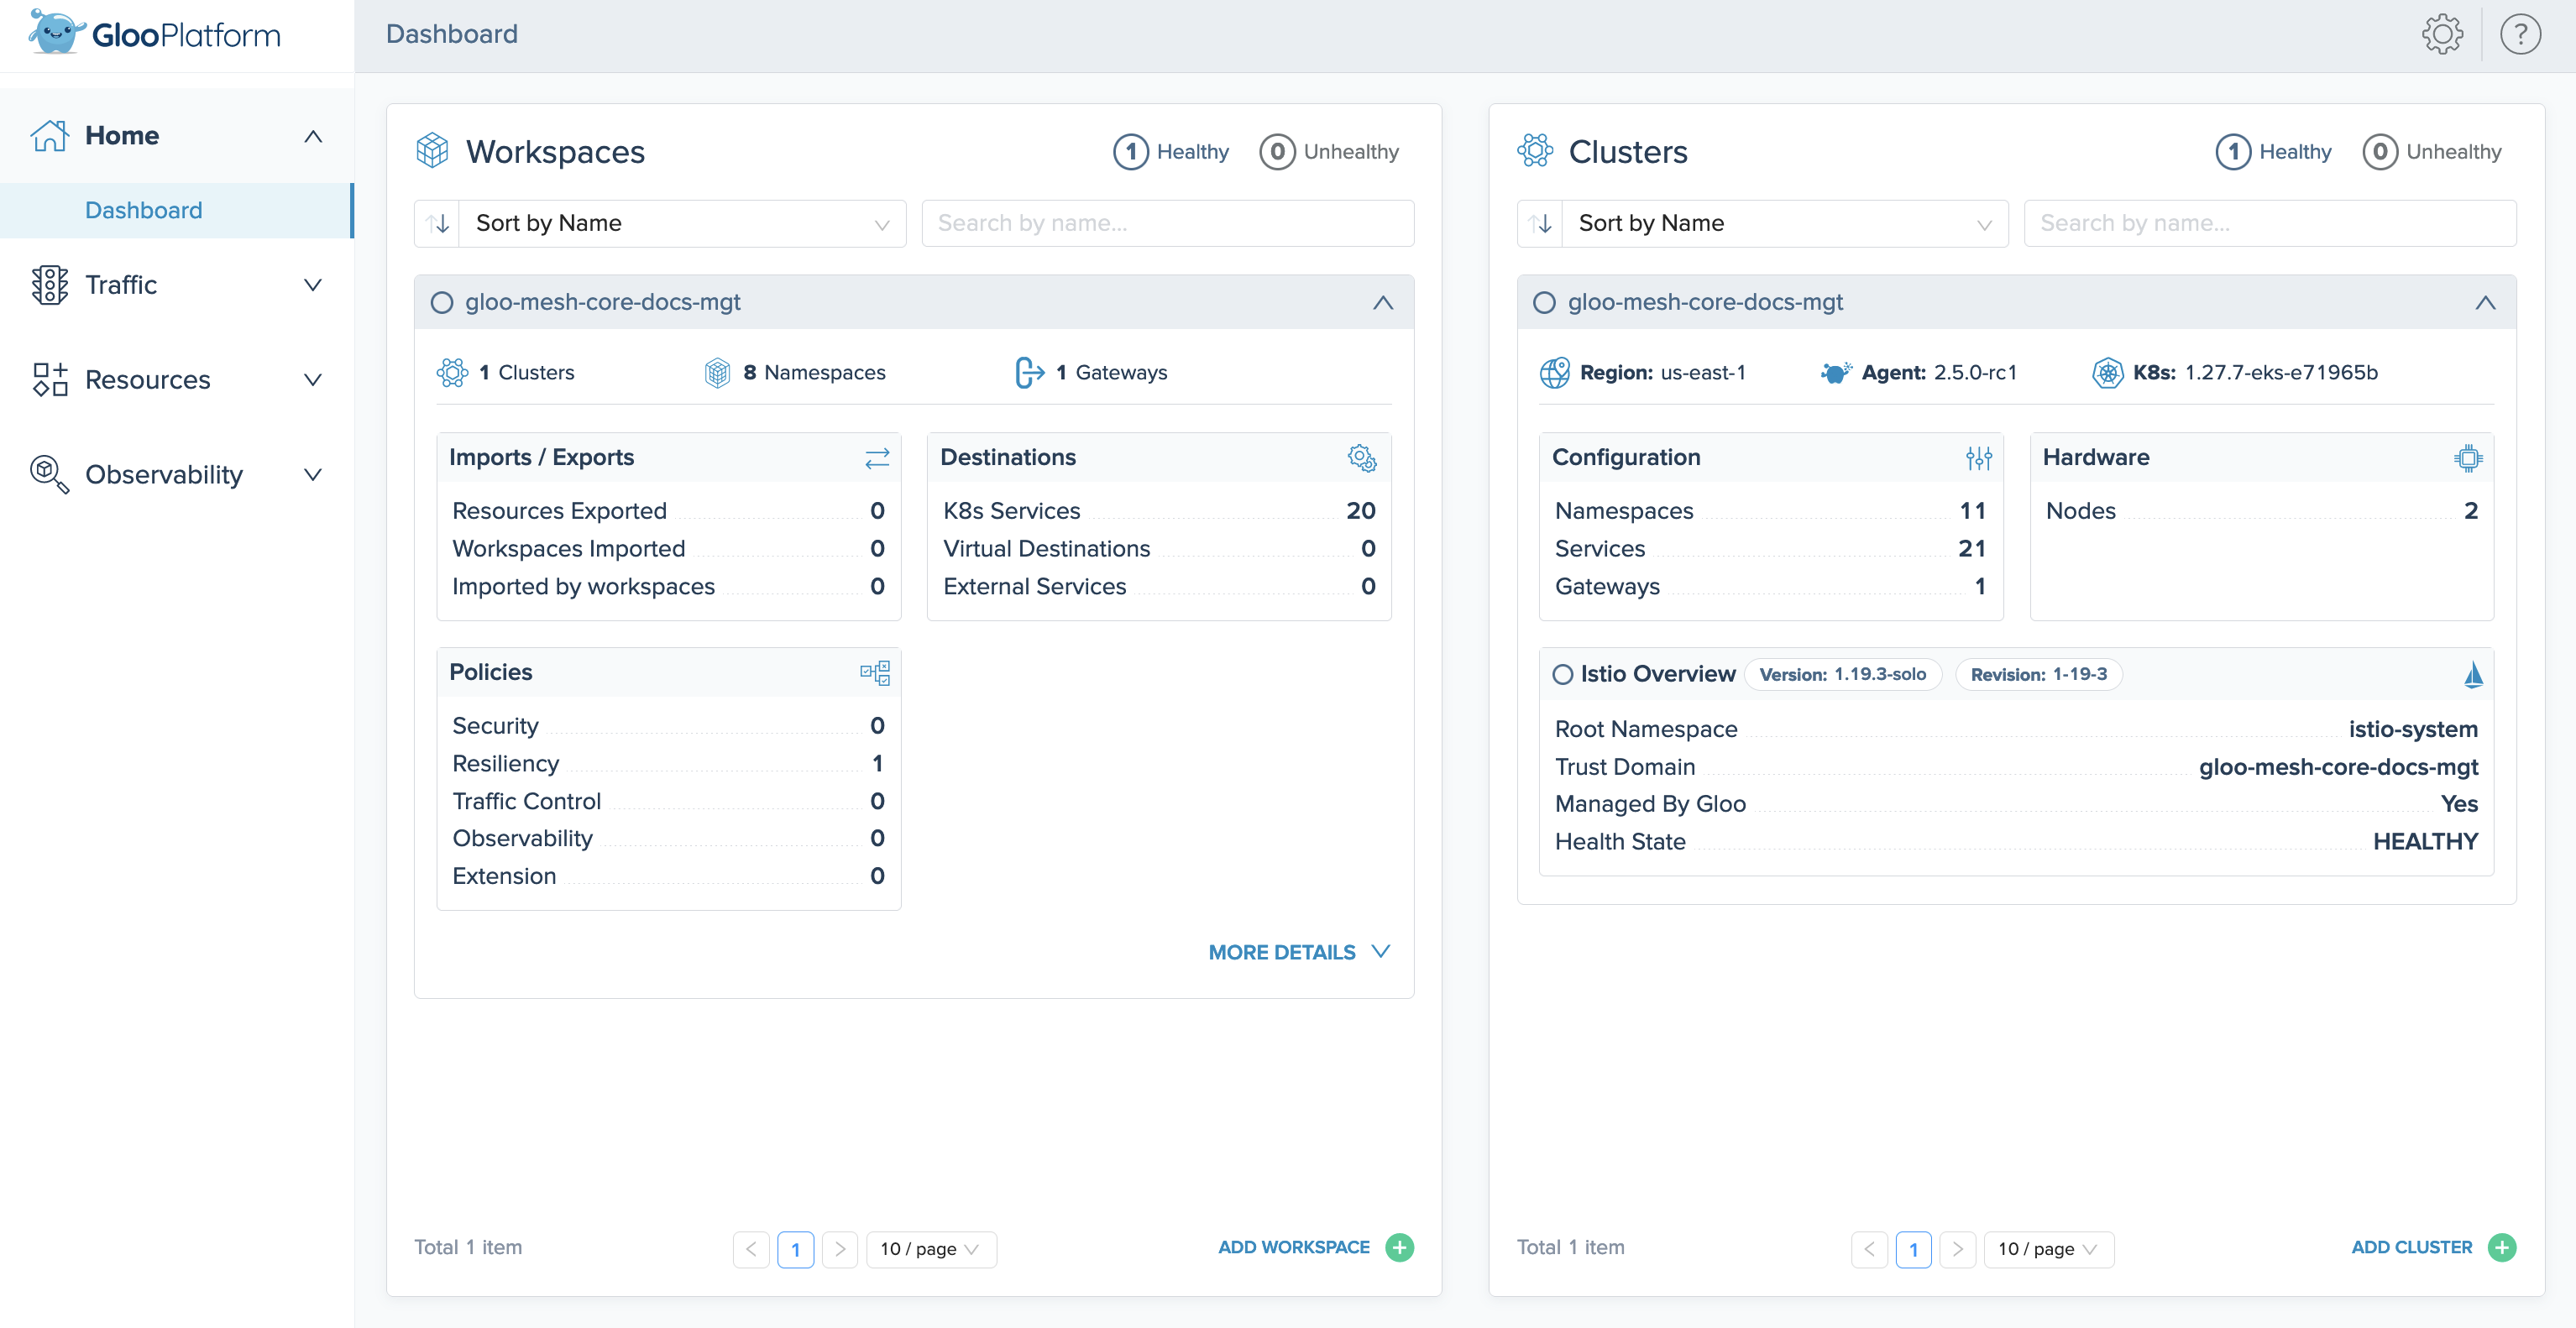
Dashboard
The Dashboard page presents an at-a-glance look at the health of workspaces and clusters that make up your Gloo setup.
In the Workspaces and Clusters panes, you can review a count of the healthy resources, sort by, or search by name for your resources. You can review top-level details about each resource in the resource cards. For more information about workspaces and registered clusters, see the Setup docs.
Traffic
Review the configuration of ingress and egress gateways in your Gloo environment.
Gateways
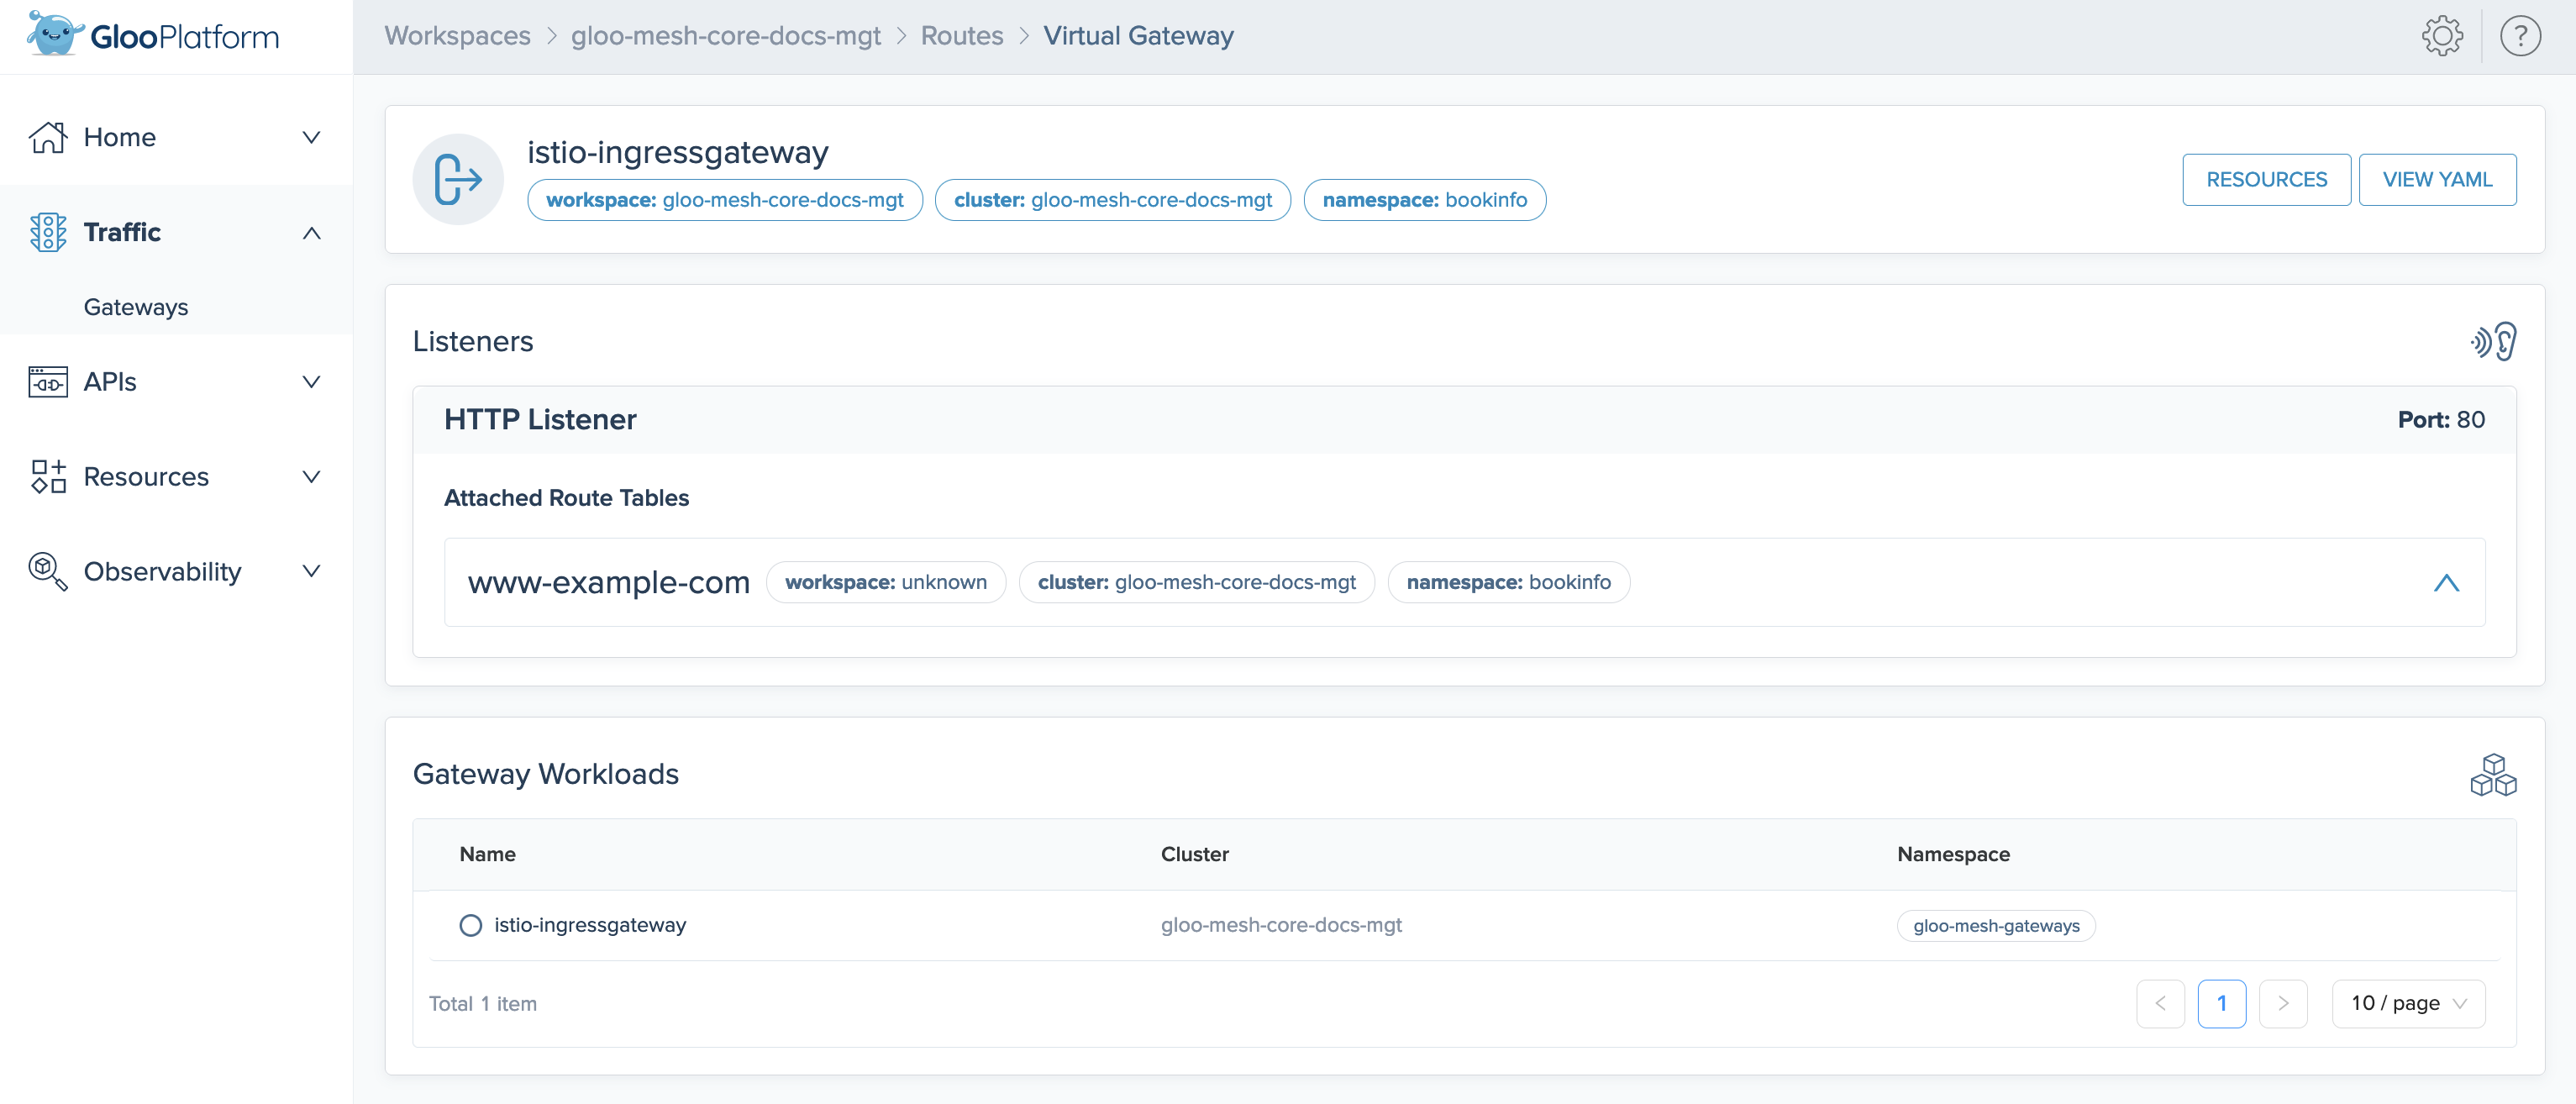
Virtual gateways consistently configure traffic into and across your environment. Click a gateway to view its details. The details are organized into the following areas. For more information, see Configure gateway listeners in the Gloo Mesh Gateway docs.
- Metadata, including the workspace, cluster, namespace, and YAML configuration file.
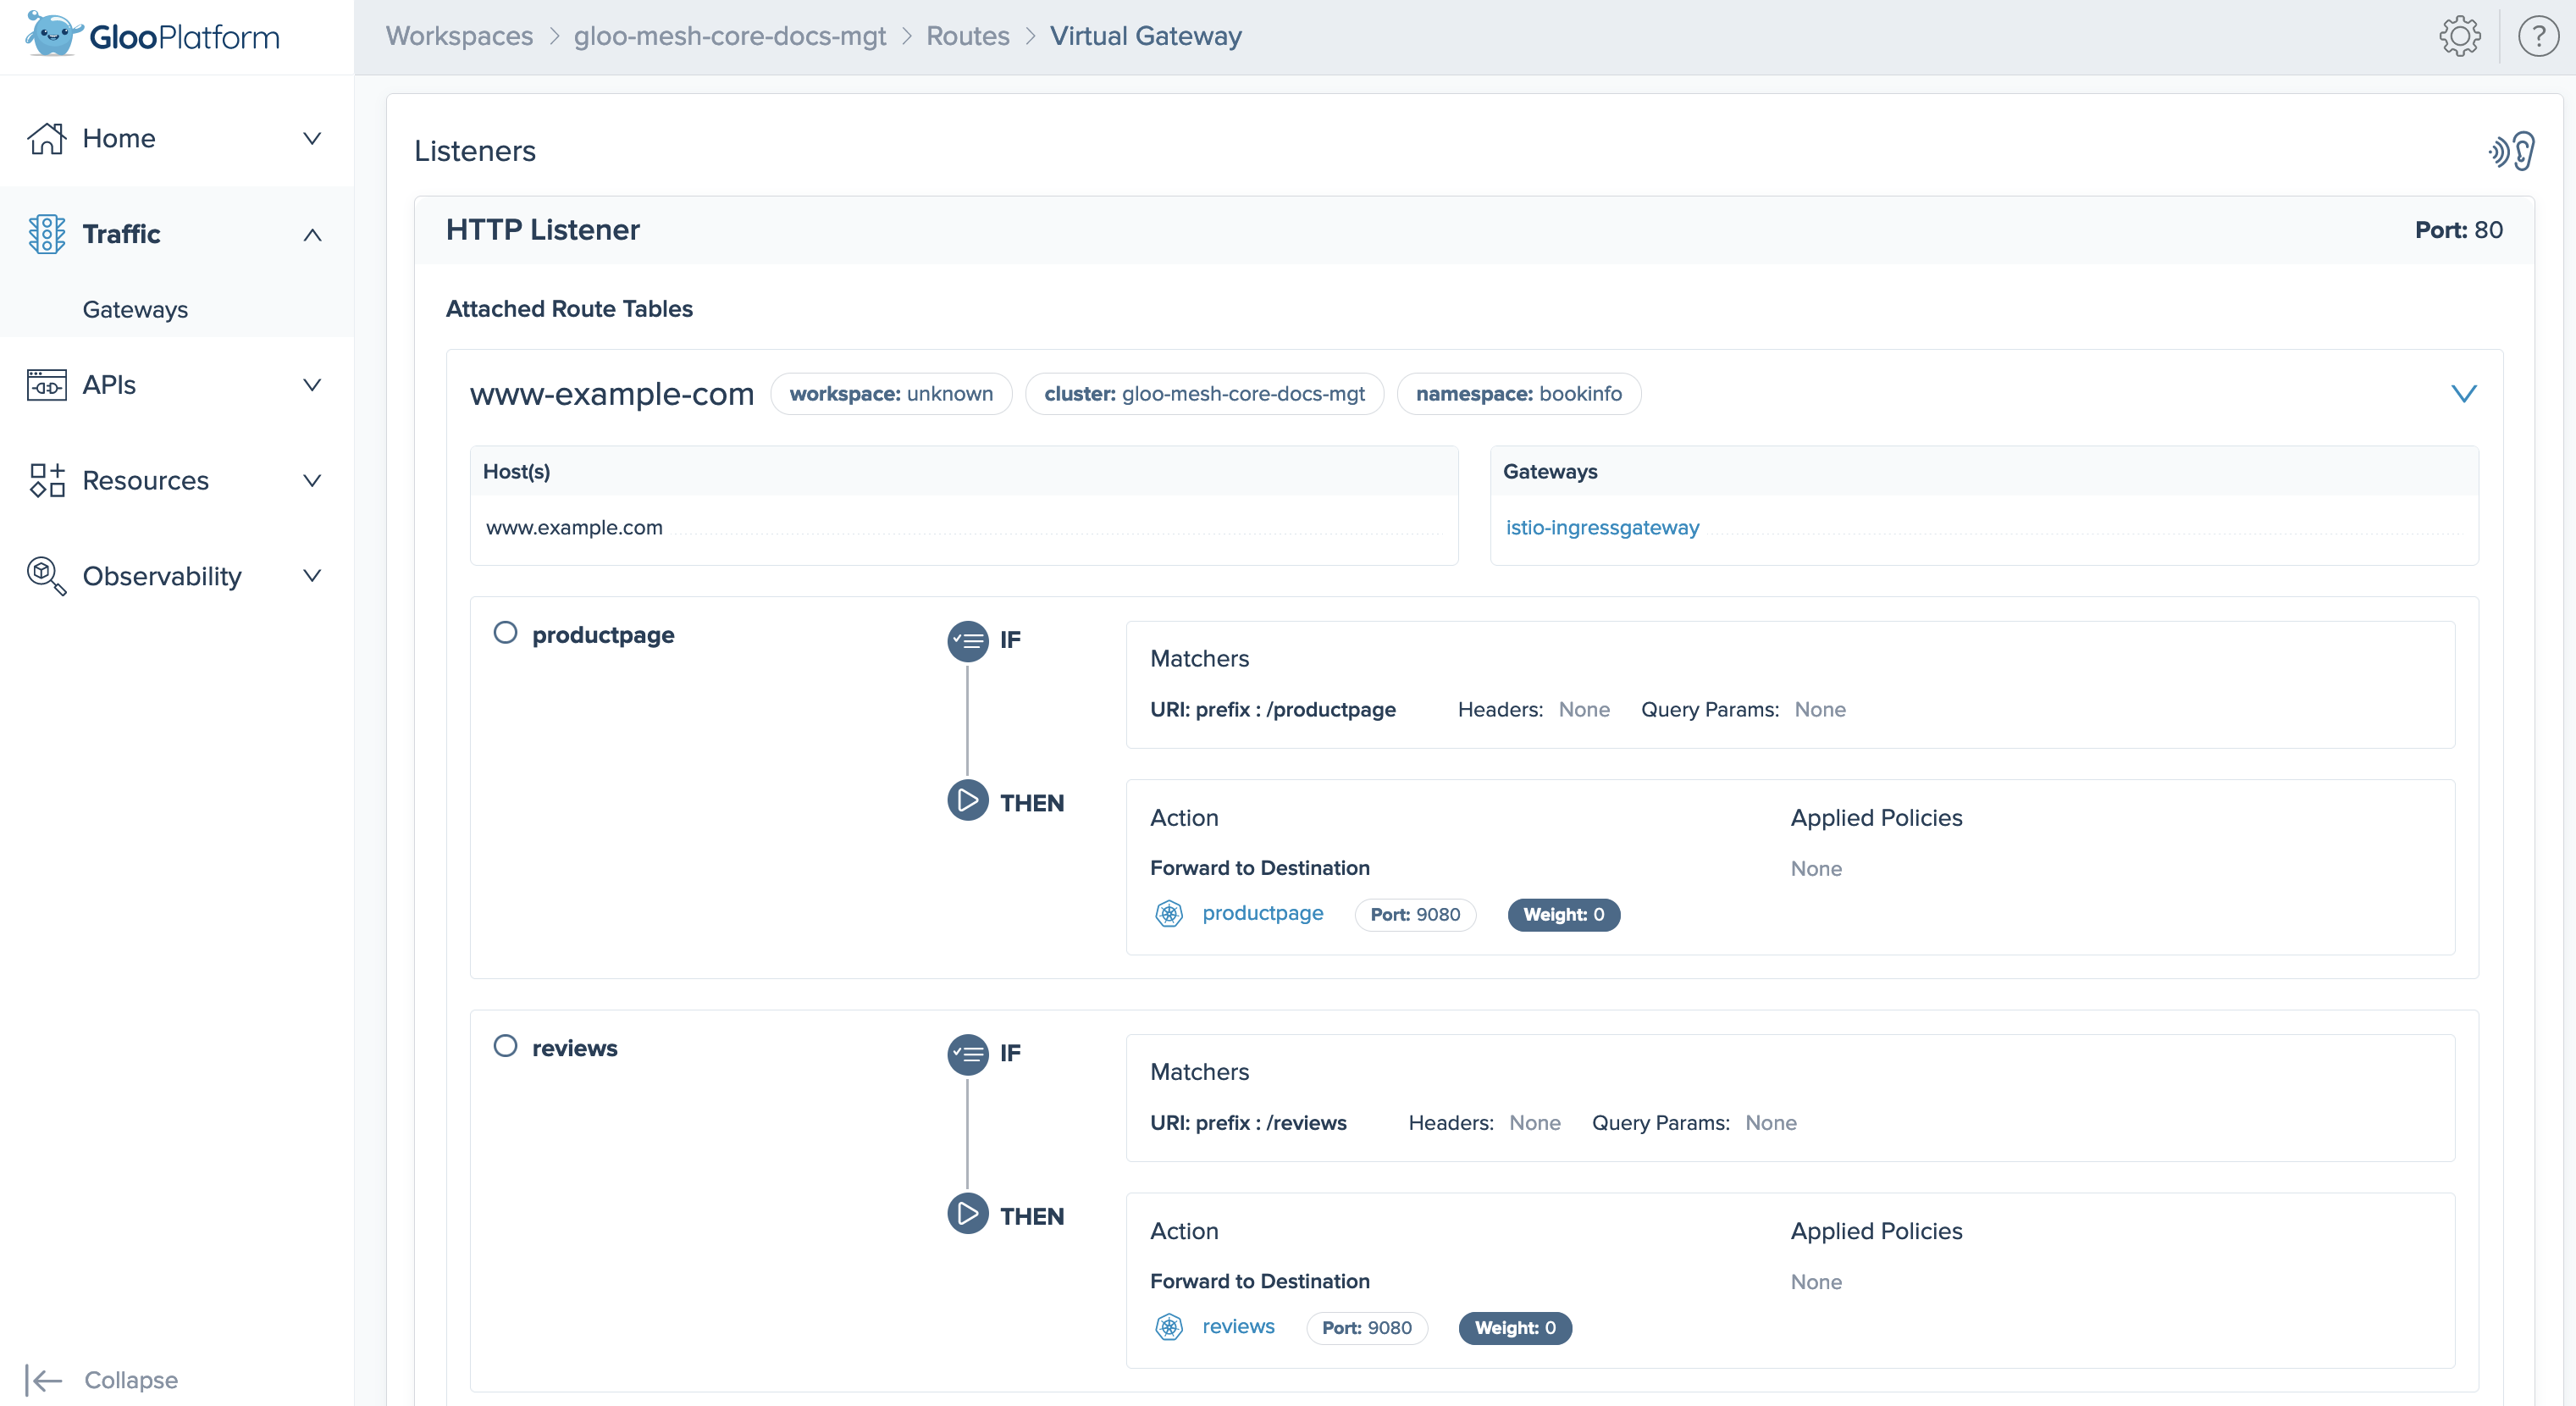
- Listeners for HTTP and HTTPS traffic, organized into attached route tables that configure what paths the gateway listens on. Expand a route table to view more details, such as the if-then routing matchers and actions.
- Gateway Workloads to review the health of gateway deployments.
Gateway details page
Route table expanded details
Portals
In Gloo Mesh Gateway, you can expose your APIs in user-facing developer portals. This way, your end users can browse through your API products, see the usage plans you offer per product, review the OpenAPI docs, and even generate API keys to securely access your APIs. For more information, see the Portal in the Gloo Mesh Gateway docs.
To view more details, click a portal.
- Published APIs are the API products that are exposed in your developer portal. These API products are route table that you can also review in the APIs tab, to see more information such as the OpenAPI spec and paths. For more information, see Bundle your APIs into API products.
- Usage Plans are the rate limiting and external auth policies that are associated with the portal. You create different plans depending on your product and pricing strategies for your APIs. For example, you might have bronze, silver, and gold usage plans, or a “freemium” plan. For more information, see Prepare usage plans.
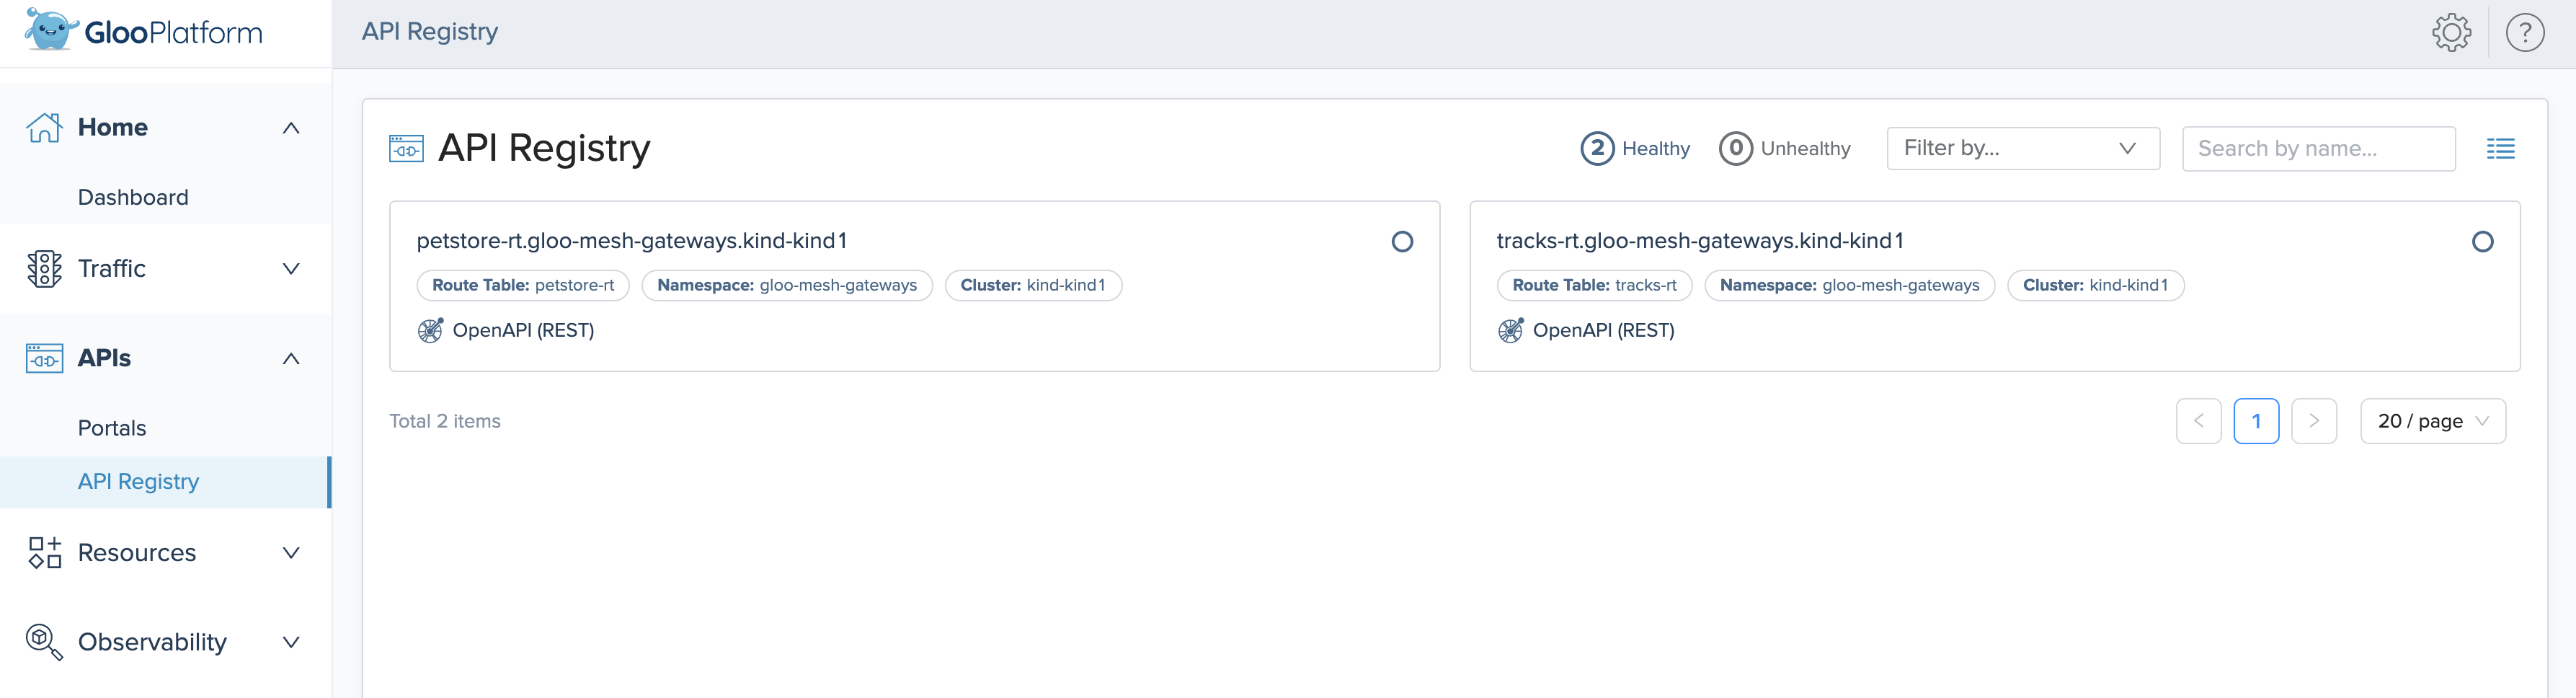
API Registry
From the API Registry page, you can review route tables that are backed by the following types of APIs:
- REST APIs that you bundle together into API product to use with Gloo Portal.
- GraphQL APIs that you use with Gloo GraphQL.
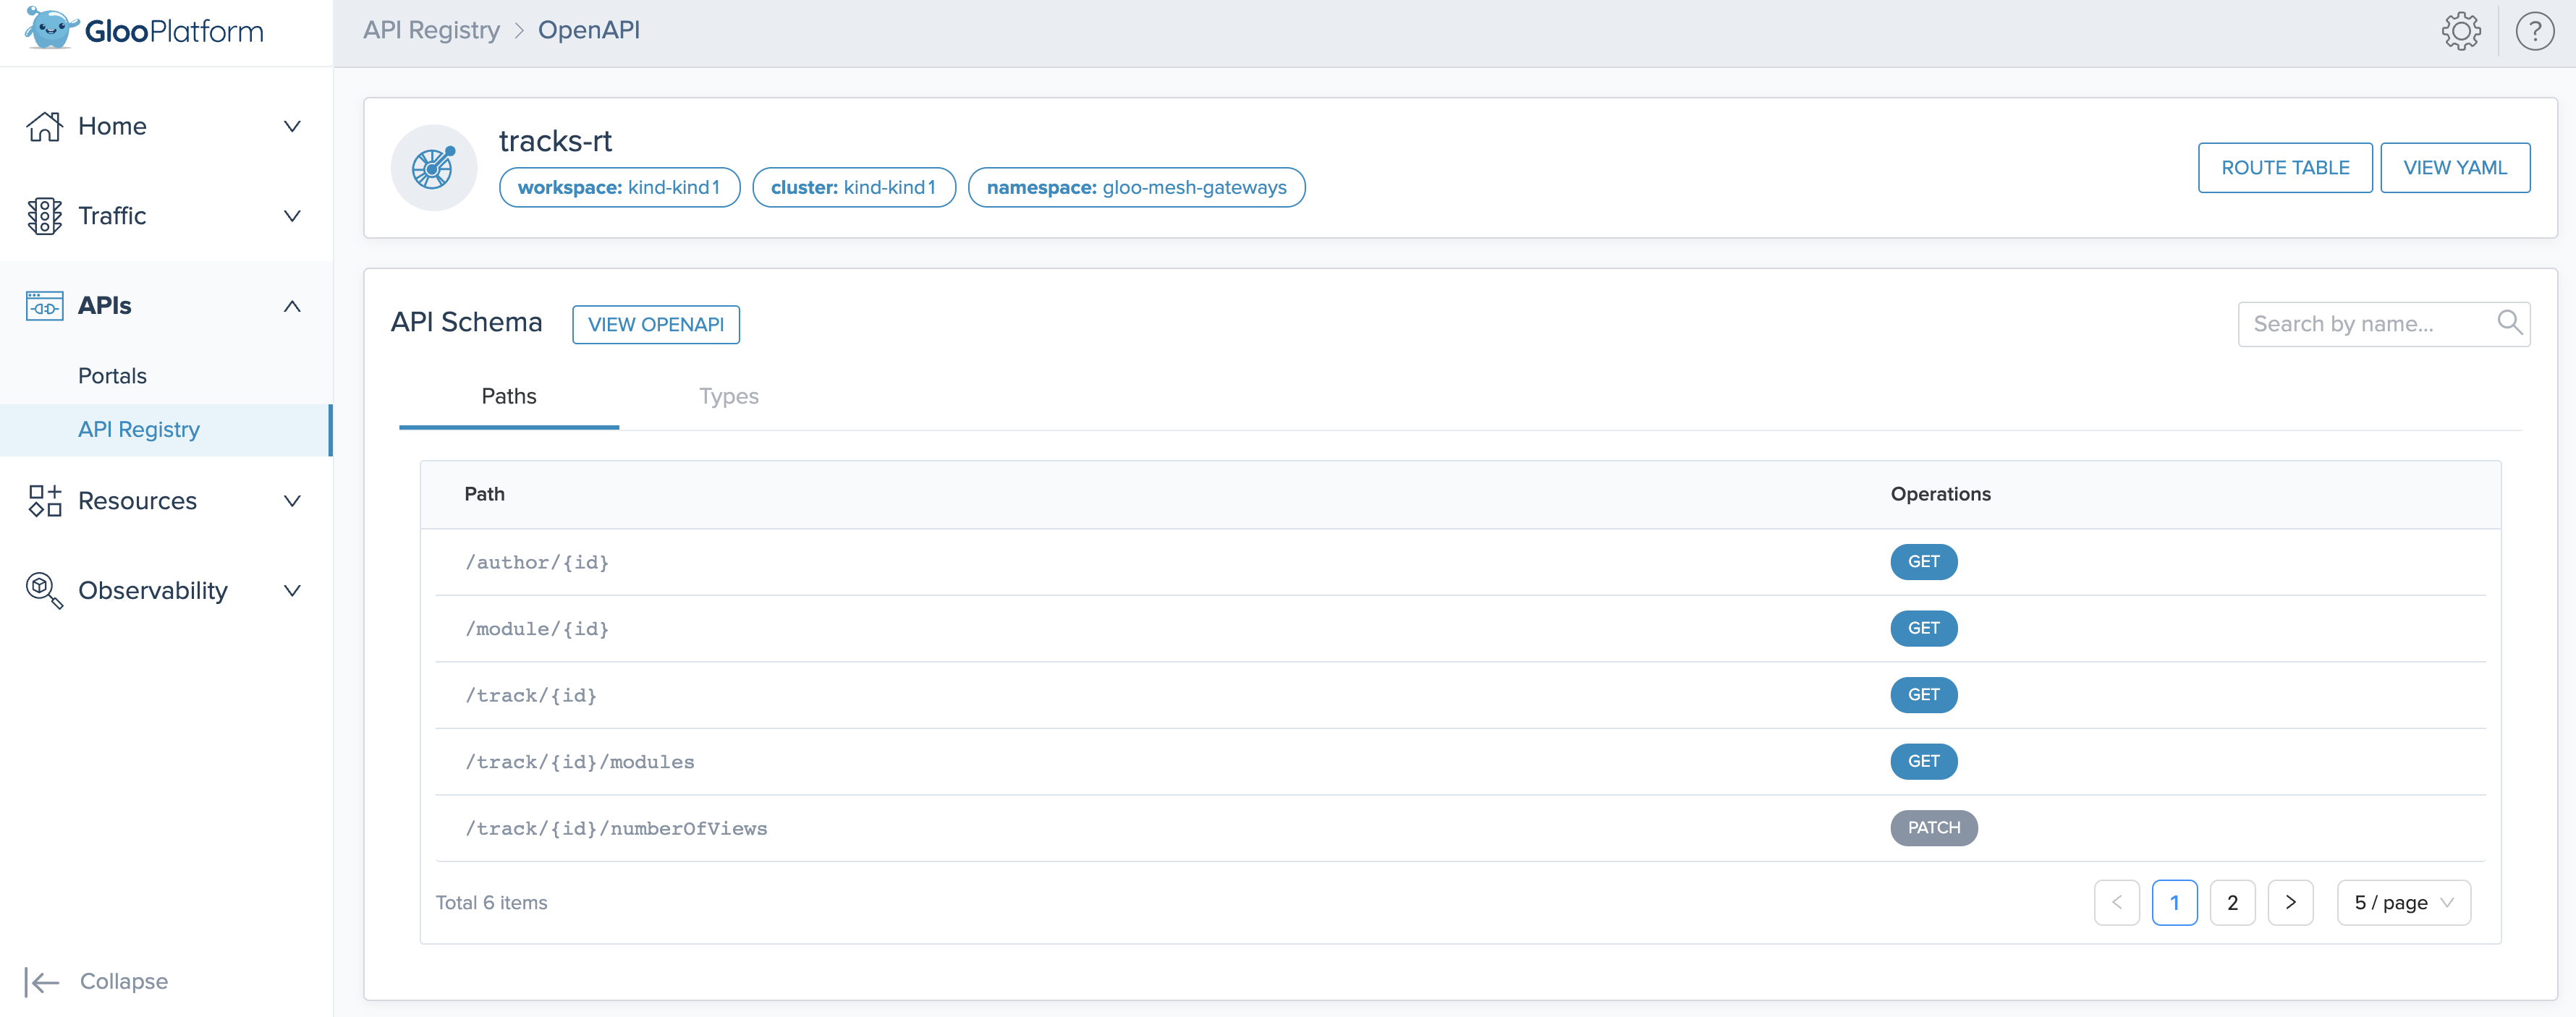
To review the details of the APIs in your route table, click the route table. Then, you can review the OpenAPI schema and paths, as well as other information such as the portals and gateways that the APIs are exposed on or the backing destinations.
APIs page
API route table details
Resources
Find an overview of resources that are deployed in your cluster and use the filter options in the Gloo UI to find the resource that you need.
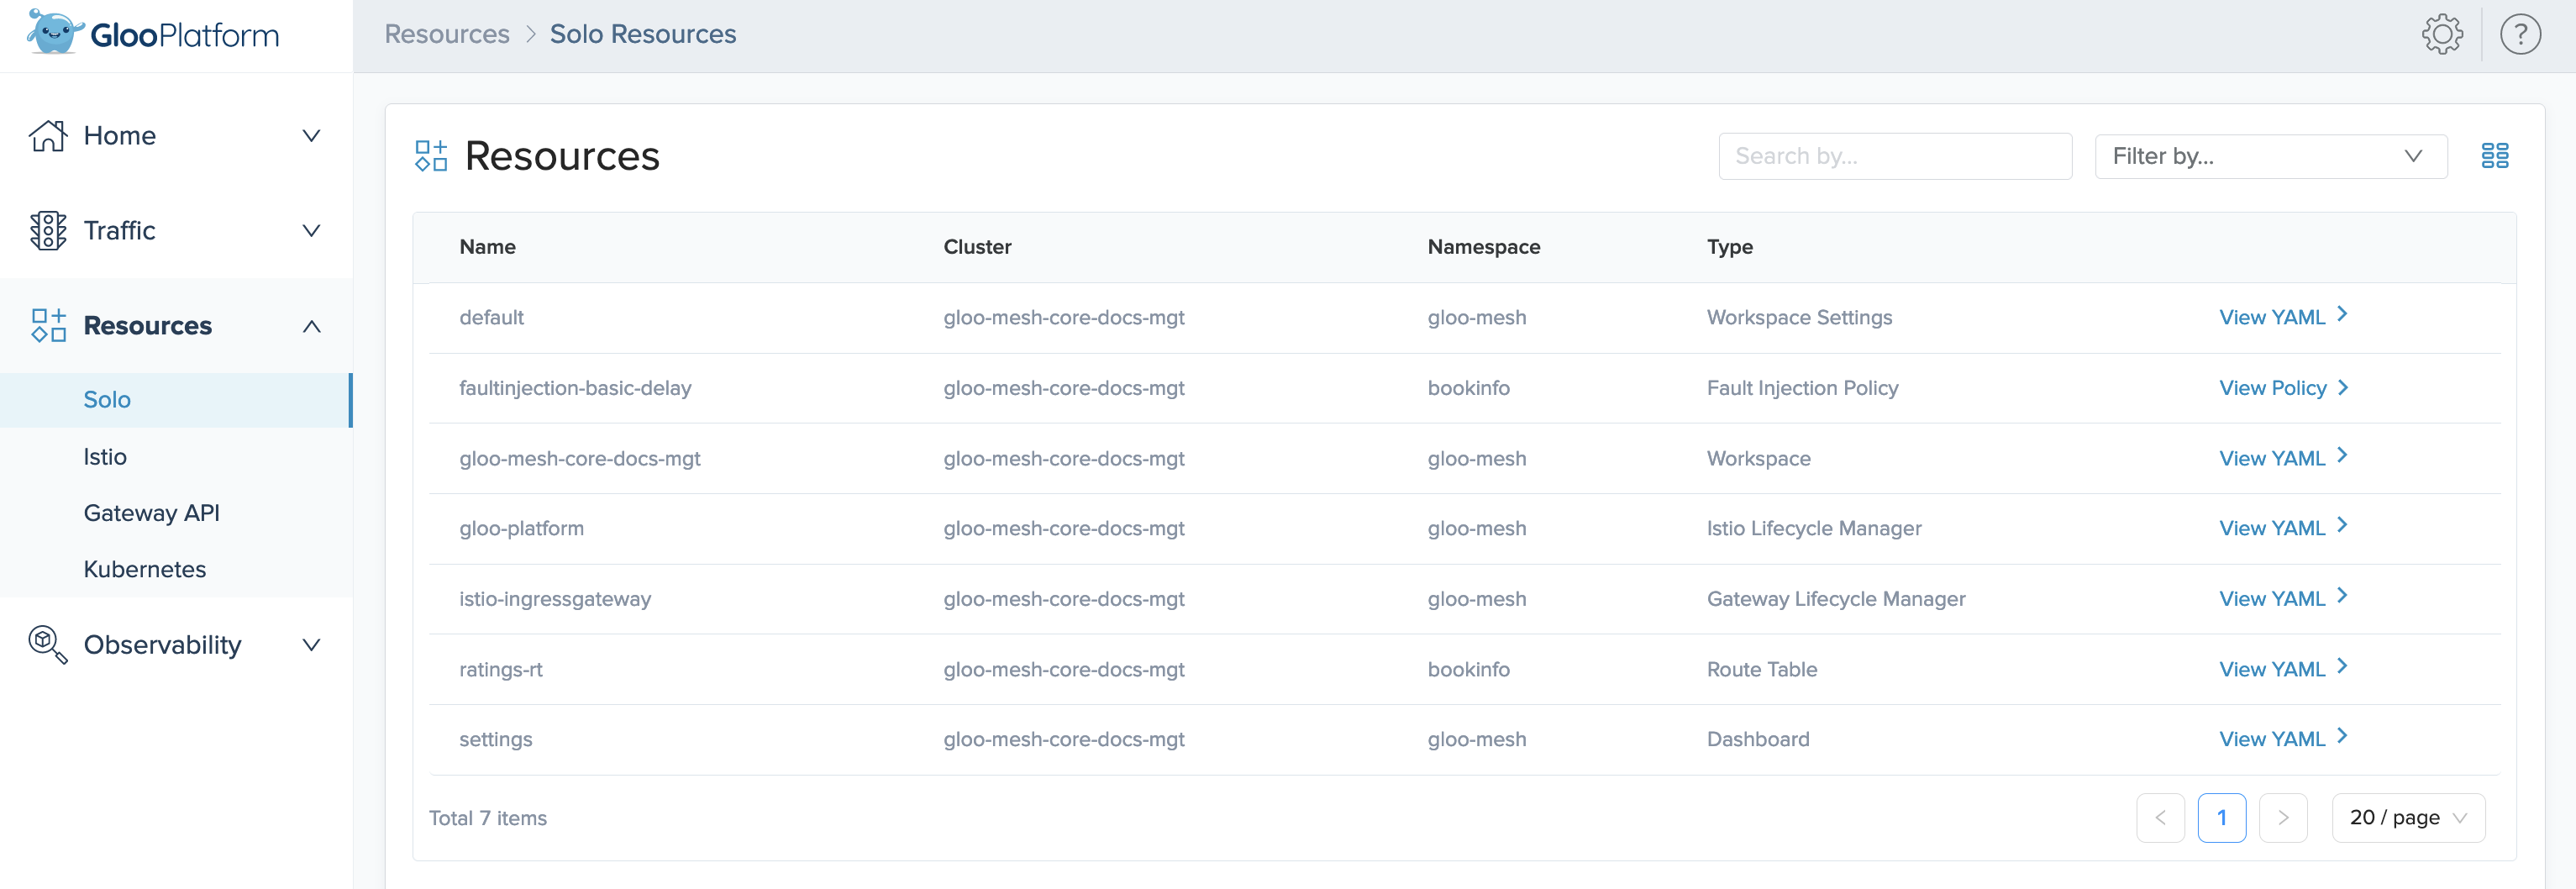
Solo
View the Gloo resources in your Gloo Mesh Enterprise environment, such as policies, workspaces, and route tables. Use the Filter by options to filter the list by resource type. To view the YAML configuration for a resource, click View YAML.
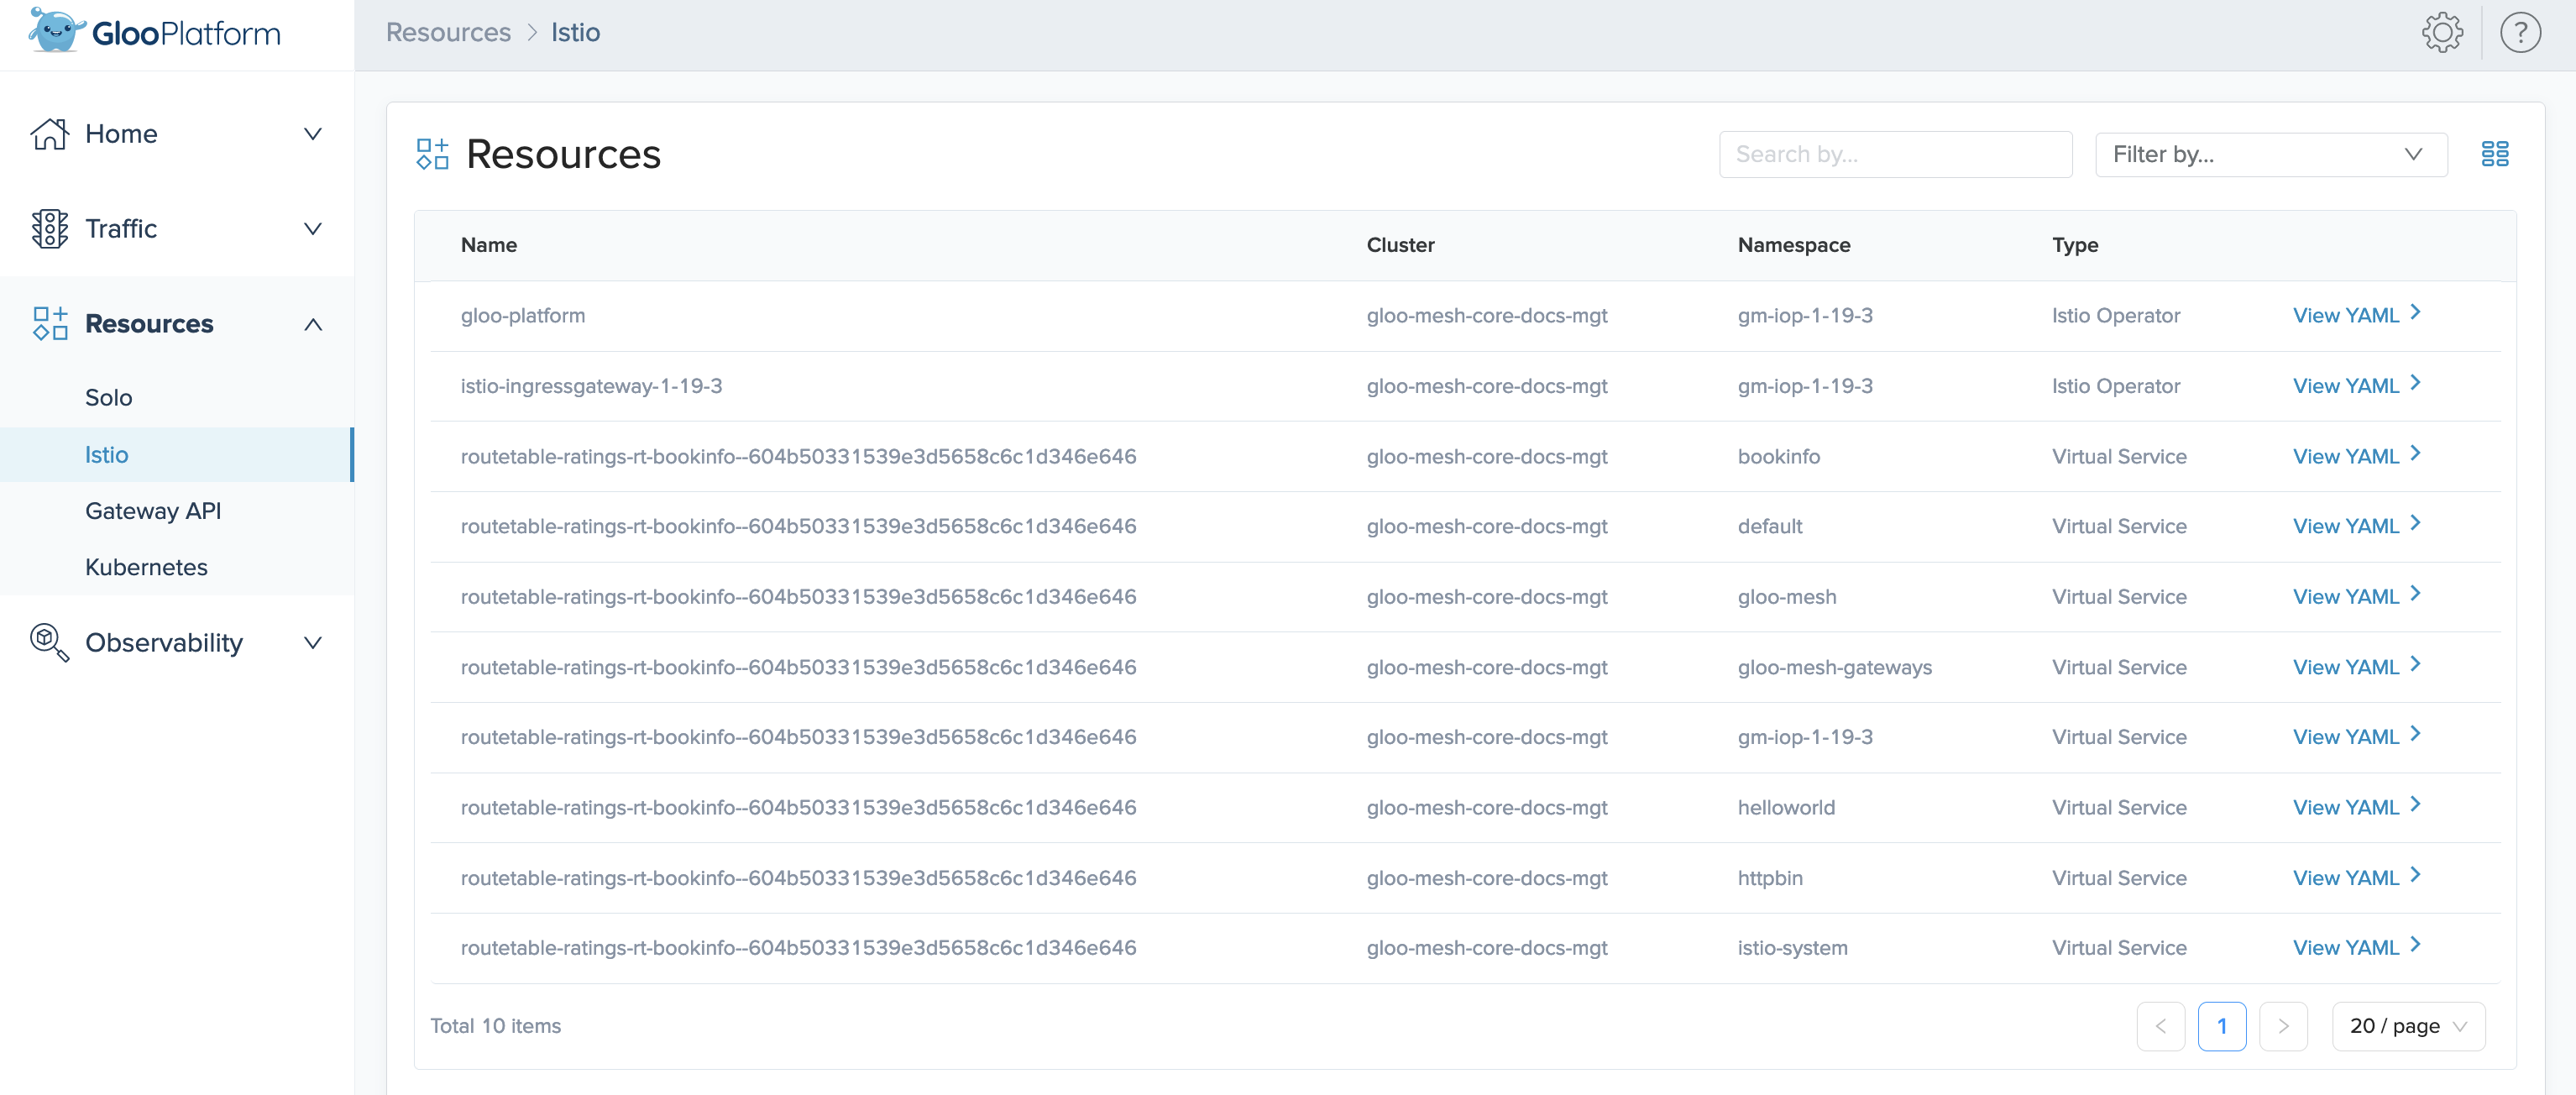
Istio
View the Istio resources in your Gloo Mesh Enterprise environment, such as virtual services, gateways, or Istio operators. Use the Filter by options to filter the list by Istio resource type. To view the YAML configuration for a resource, click View YAML.
Gateway API
View all Kubernetes Gateway API resources in your environment. For more information, see the Kubernetes Gateway API guide in the Istio documentation.
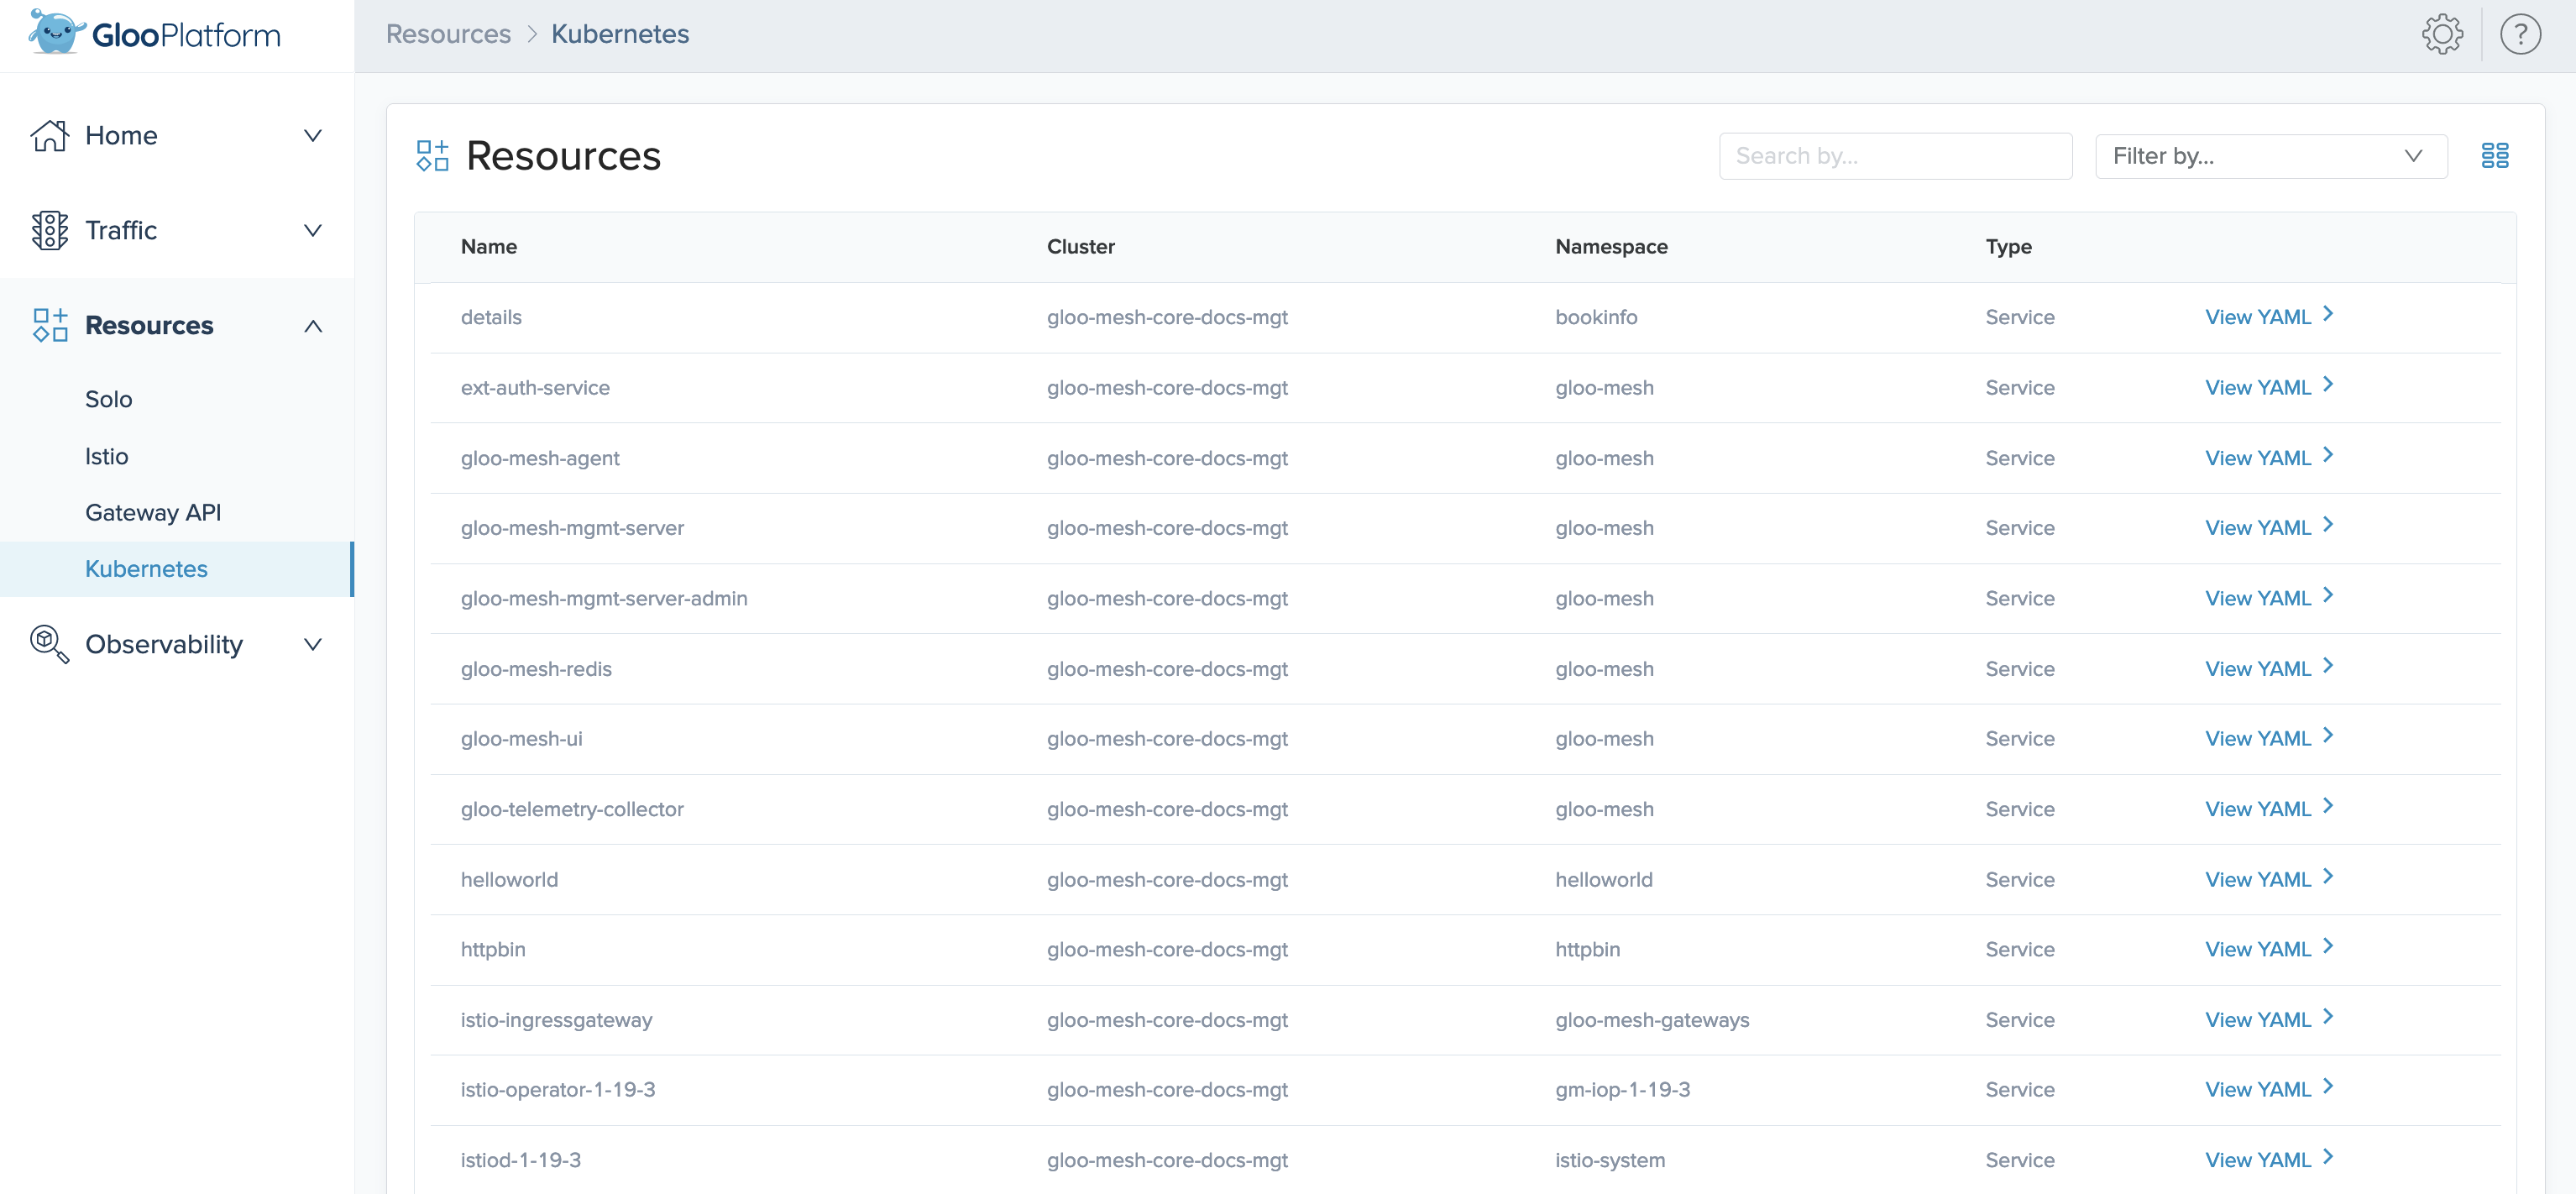
Kubernetes
View all Kubernetes resources in your cluster, such as services, service accounts, secrets, or cluster roles. Use the Filter by options to filter the list by Kubernetes resource type. To view the YAML configuration for a resource, click View YAML.
Observability
The Gloo UI consumes telemetry data from Prometheus and Jaeger and visualizes this data in the Observability section.
Graph
The Gloo UI includes a Graph page to visualize the network traffic that reaches your service mesh. The graph is based on Prometheus metrics that are collected with the Gloo telemetry pipeline.
To populate the Gloo UI graph with data, you must set the telemetryCollector.enabled Helm setting to true in each cluster in your environment. If you installed Gloo Mesh at version 2.5 or later, this setting is enabled by default. If you installed Gloo Mesh in a multicluster environment at version 2.4 or earlier, be sure you enable this setting in the Helm values for your management cluster.
Review the following sections to learn more about the Graph layout.
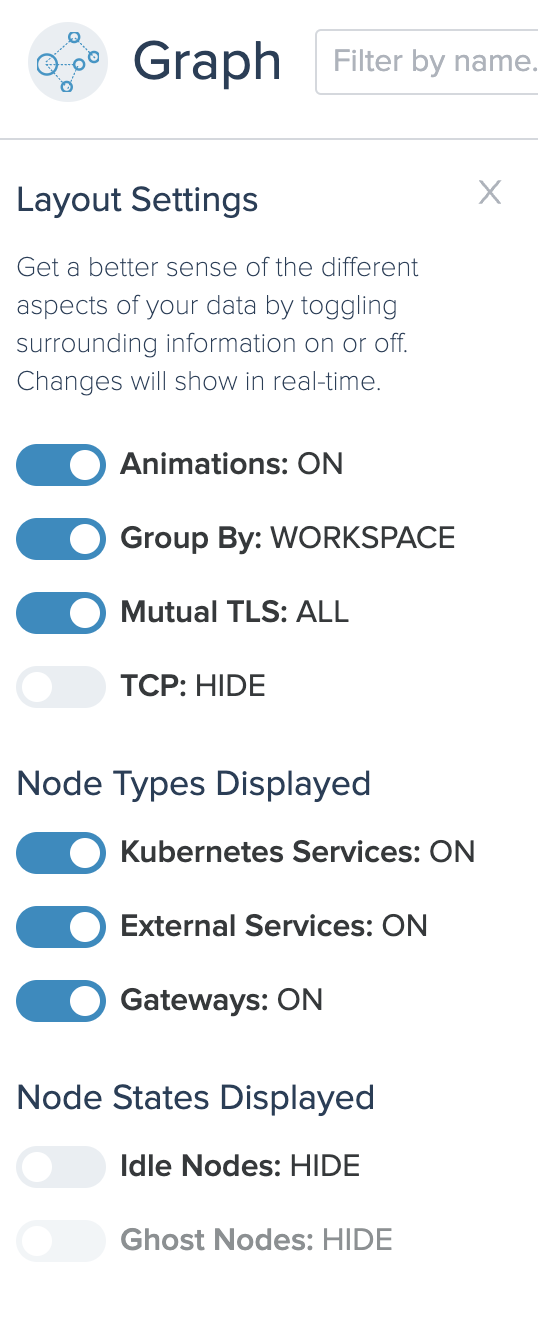
Layout settings
From the footer toolbar, click Layout Settings. Toggle on or off the following settings.
Header, filter, and footer toolbars for navigation
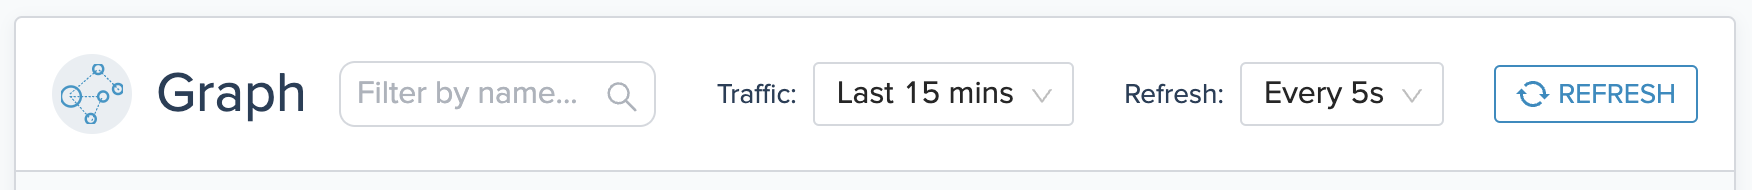
In the Search bar, filter the services that you want to see in the graph. You can choose to include or hide those services.
From the Traffic dropdown, select the range of time that you want the graph to show, such as traffic from the last 15 minutes.
From the Refresh dropdown, select how often you want the graph to refresh the data, such as every 5 seconds. You can also refresh on demand by clicking REFRESH.
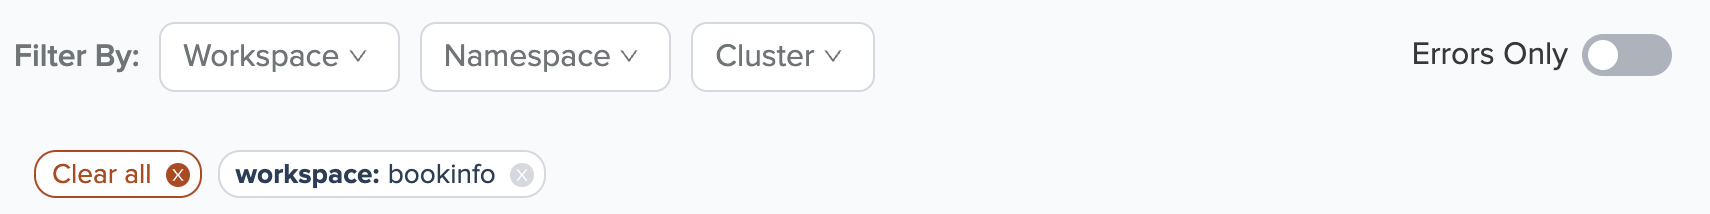
After the header toolbar, you can filter what the graph shows by workspace, namespace, and cluster. Filters work like the logical operator AND, so results must meet all the criteria. For example, if you filter by bookinfo workspace, bookinfo namespace, and cluster1, then the graph shows services that meet all these criteria.
Toggle Errors Only to see services that experienced traffic errors during the traffic time range you selected from the header toolbar.
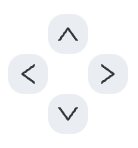
Within the graph views, you can navigate by clicking and dragging whitespace within the main canvas, or by using the navigation arrow buttons, as shown in the following figure.
After the header toolbar, filter, and main canvas, you can choose more viewing options in the footer toolbar.

| # | Icon name | Description |
|---|---|---|
| 1 | Fullscreen | Click to expand your browser to fullscreen. Click again or enter ESC to return to the normal screen size. |
| 2 | Zoom in and out | Zoom in or out on the main view’s canvas. Depending on your mouse settings, you can also scroll to zoom in and out. |
| 3 | Fit to canvas | Click to center and fit the content of the current view to the canvas size. This action might be helpful if you rearranged the nodes and zoomed in. |
| 4 | Networking graph views | Click one of the networking graph views to change how the nodes are displayed in the main canvas. For more information, see Networking views. |
| 5 | View legend | Open the graph legend. For more information, see Legend. |
| 6 | Layout settings | Open the graph layout settings. For more information, see Layout settings. |
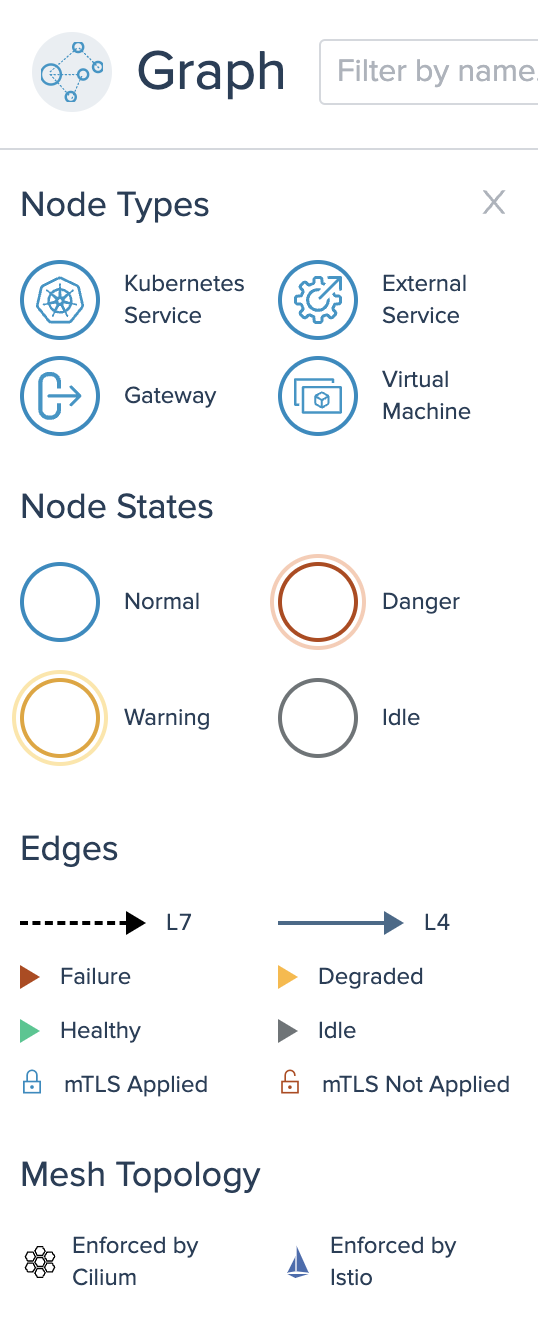
Legend
From the footer toolbar, click Show Legend.
Node Types describes the icons that are used for the application “nodes” of the graph. For example, a node might be a Kubernetes service, Istio gateway, external service, or an attached virtual machine (VM). (Note that nodes represent your apps, not Kubernetes compute nodes.)
Node States and Edges show whether a service’s traffic behaves normally or not, as indicated by a color or icon.
| Color or icon | State | Description |
|---|---|---|
| Blue | Normal | The node sends and responds to traffic as expected. |
| Red | Danger | The node has some sort of failure. For example, a policy might be applied to a route that blocks traffic to a service. |
| Yellow | Warn | The node has some sort of degraded traffic. For example, a policy might be applied to a route that rate limits traffic to a service. Most of the requests are successful, but some are not. |
| Gray | Idle | The node does not yet accept or send traffic. For example, the deployment might be pending. |
| Dashed, black line | L7 | The traffic between nodes is sent over Layer 7 (application). For this traffic, you can apply L7 HTTP/HTTPS Gloo Mesh and Gloo Mesh Gateway policies. |
| Solid, navy line | L4 | The traffic between nodes is sent over Layer 4 (transport). You cannot apply Gloo Mesh Enterprise or Gloo Mesh Gateway policies to Layer 4 traffic as these products operate on Layer 7. |
| Colorful triangles | Failure, Healthy, Degraded, or Idle | The connection is in a state of failure, healthy, degraded, or idle, depending on the color. Try describing the resources in your cluster to troubleshoot further. |
| Blue lock icon | mTLS applied | Service isolation is enabled for the traffic, with communication secured via mTLS. You can change service isolation settings via an access policy for a specific destination, or for the entire workspace via the workspace settings. |
| Istio icon | Enforced by Istio | The traffic connection is enforced by Istio, which indicates that you use Gloo Mesh, or Gloo Mesh Gateway for gateway-only connections. |
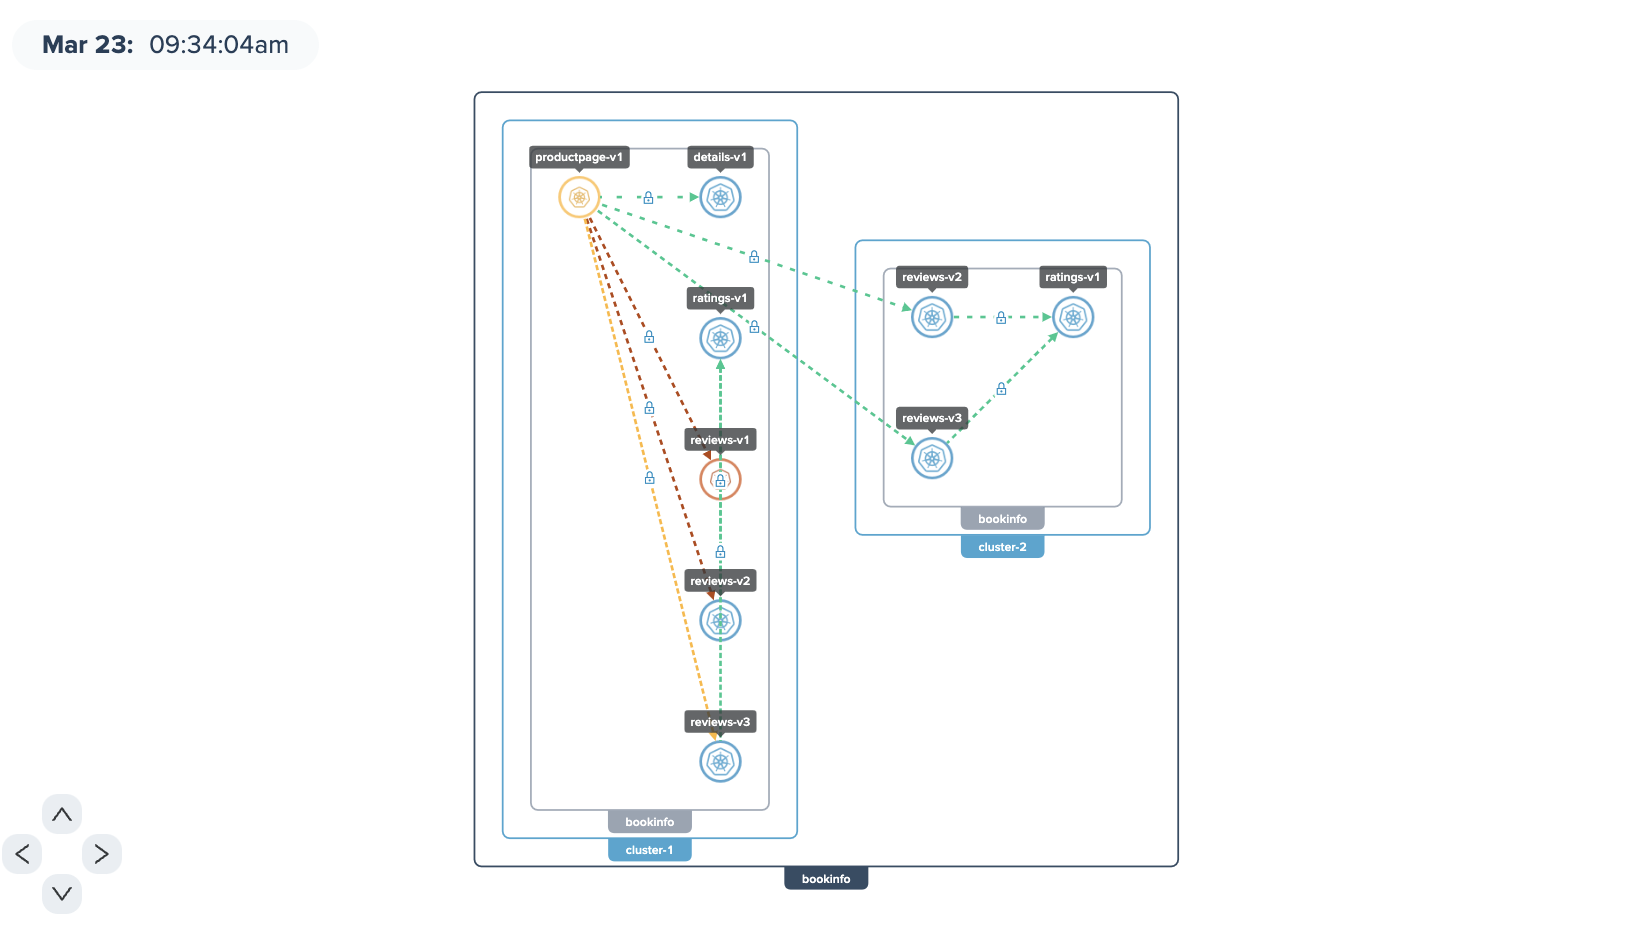
Networking views
Show an architectural view of your app nodes in the main canvas area of the graph. This view organizes the app nodes by the Gloo workspace, Kubernetes namespace, and cluster that you filter for.
To rearrange nodes, click and drag. In this view, your changes are cached so that the canvas setup stays similar when you return to the page. For information on the edge paths, node states, locks, and more, see the Legend tab.
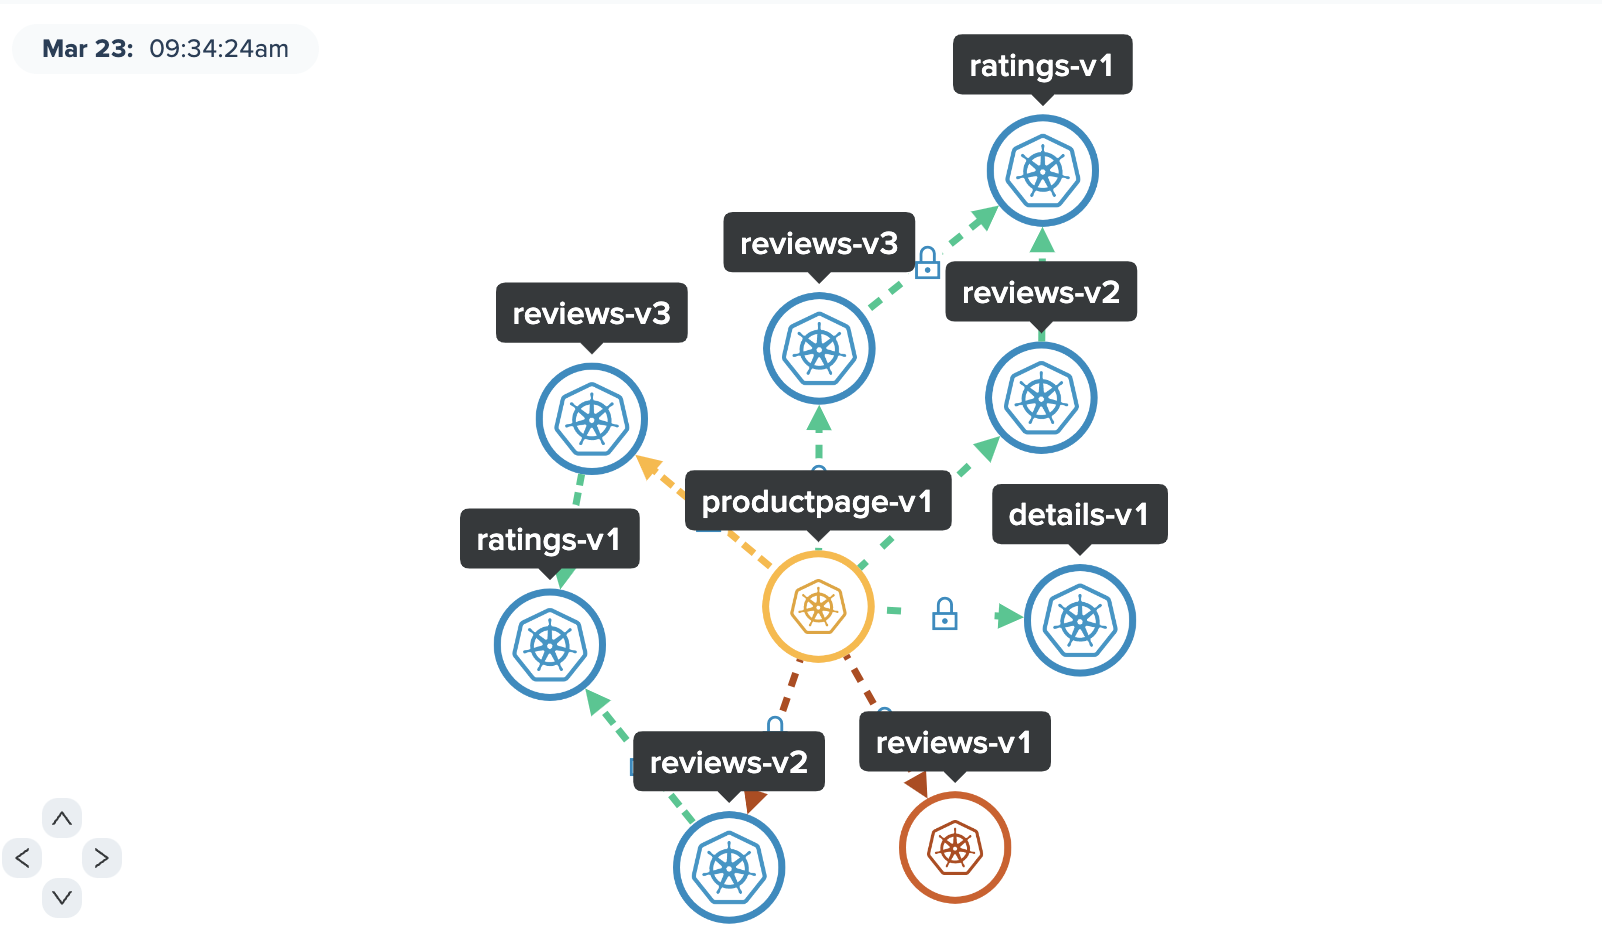
Show a simple view of the app nodes in your environment. Nodes are grouped together in close proximity. This view does not show workspace, namespace, or cluster boundaries. However, those boundaries are still used to show or hide out nodes based on your filters.
To rearrange nodes, click and drag. Note that in this view, your changes are NOT cached. For information on the edge paths, node states, locks, and more, see the Legend tab.
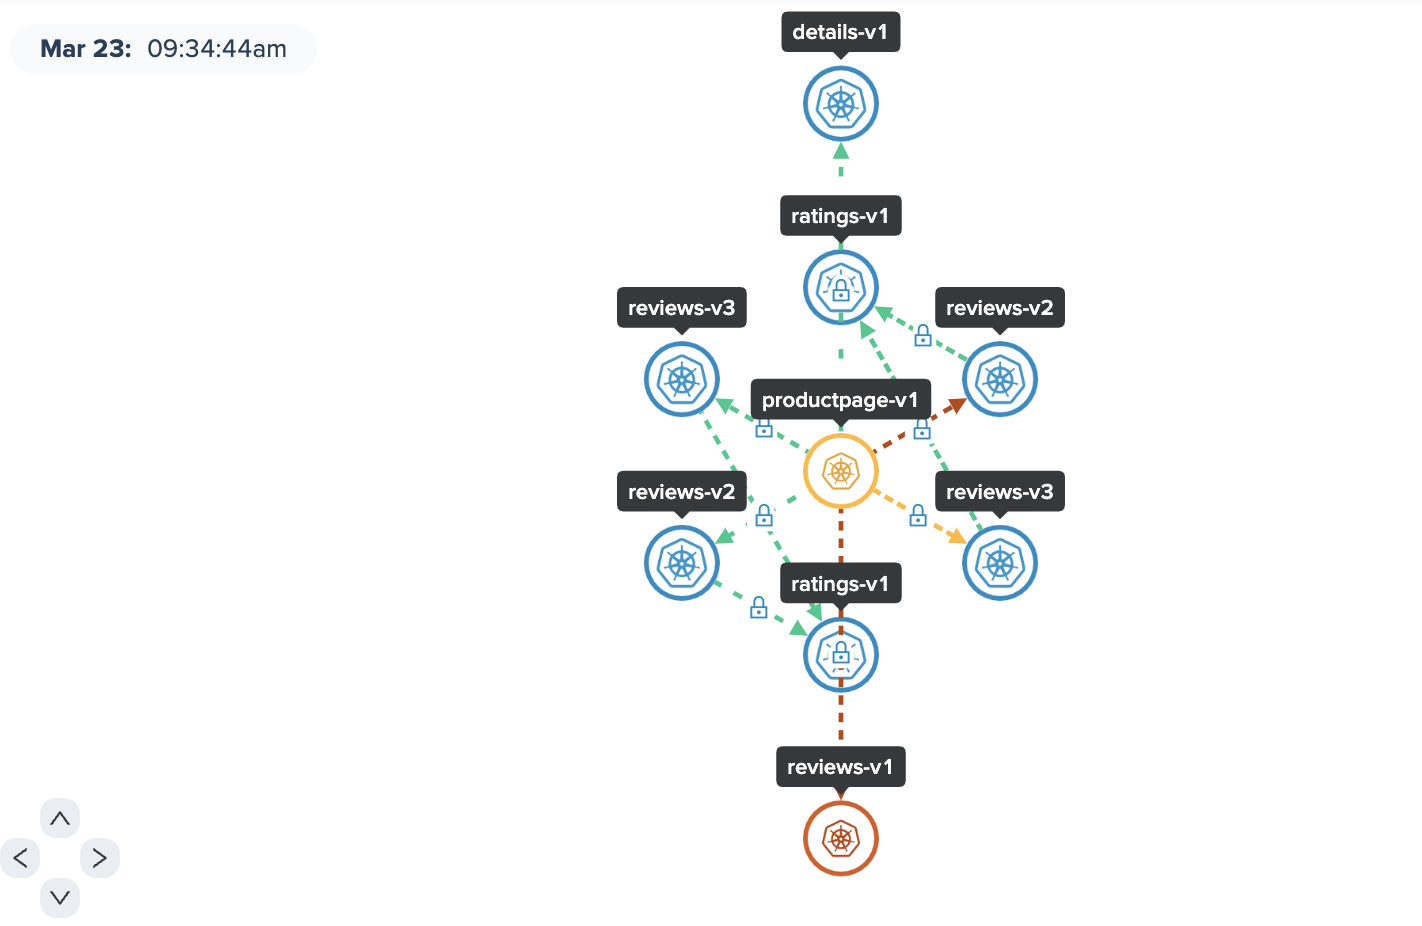
Show a simple view of the app nodes in your environment. Nodes are organized into a vertical chain layout. This view does not show workspace, namespace, or cluster boundaries. However, those boundaries are still used to show or hide out nodes based on your filters.
To rearrange nodes, click and drag. Note that in this view, your changes are NOT cached. For information on the edge paths, node states, locks, and more, see the Legend tab.
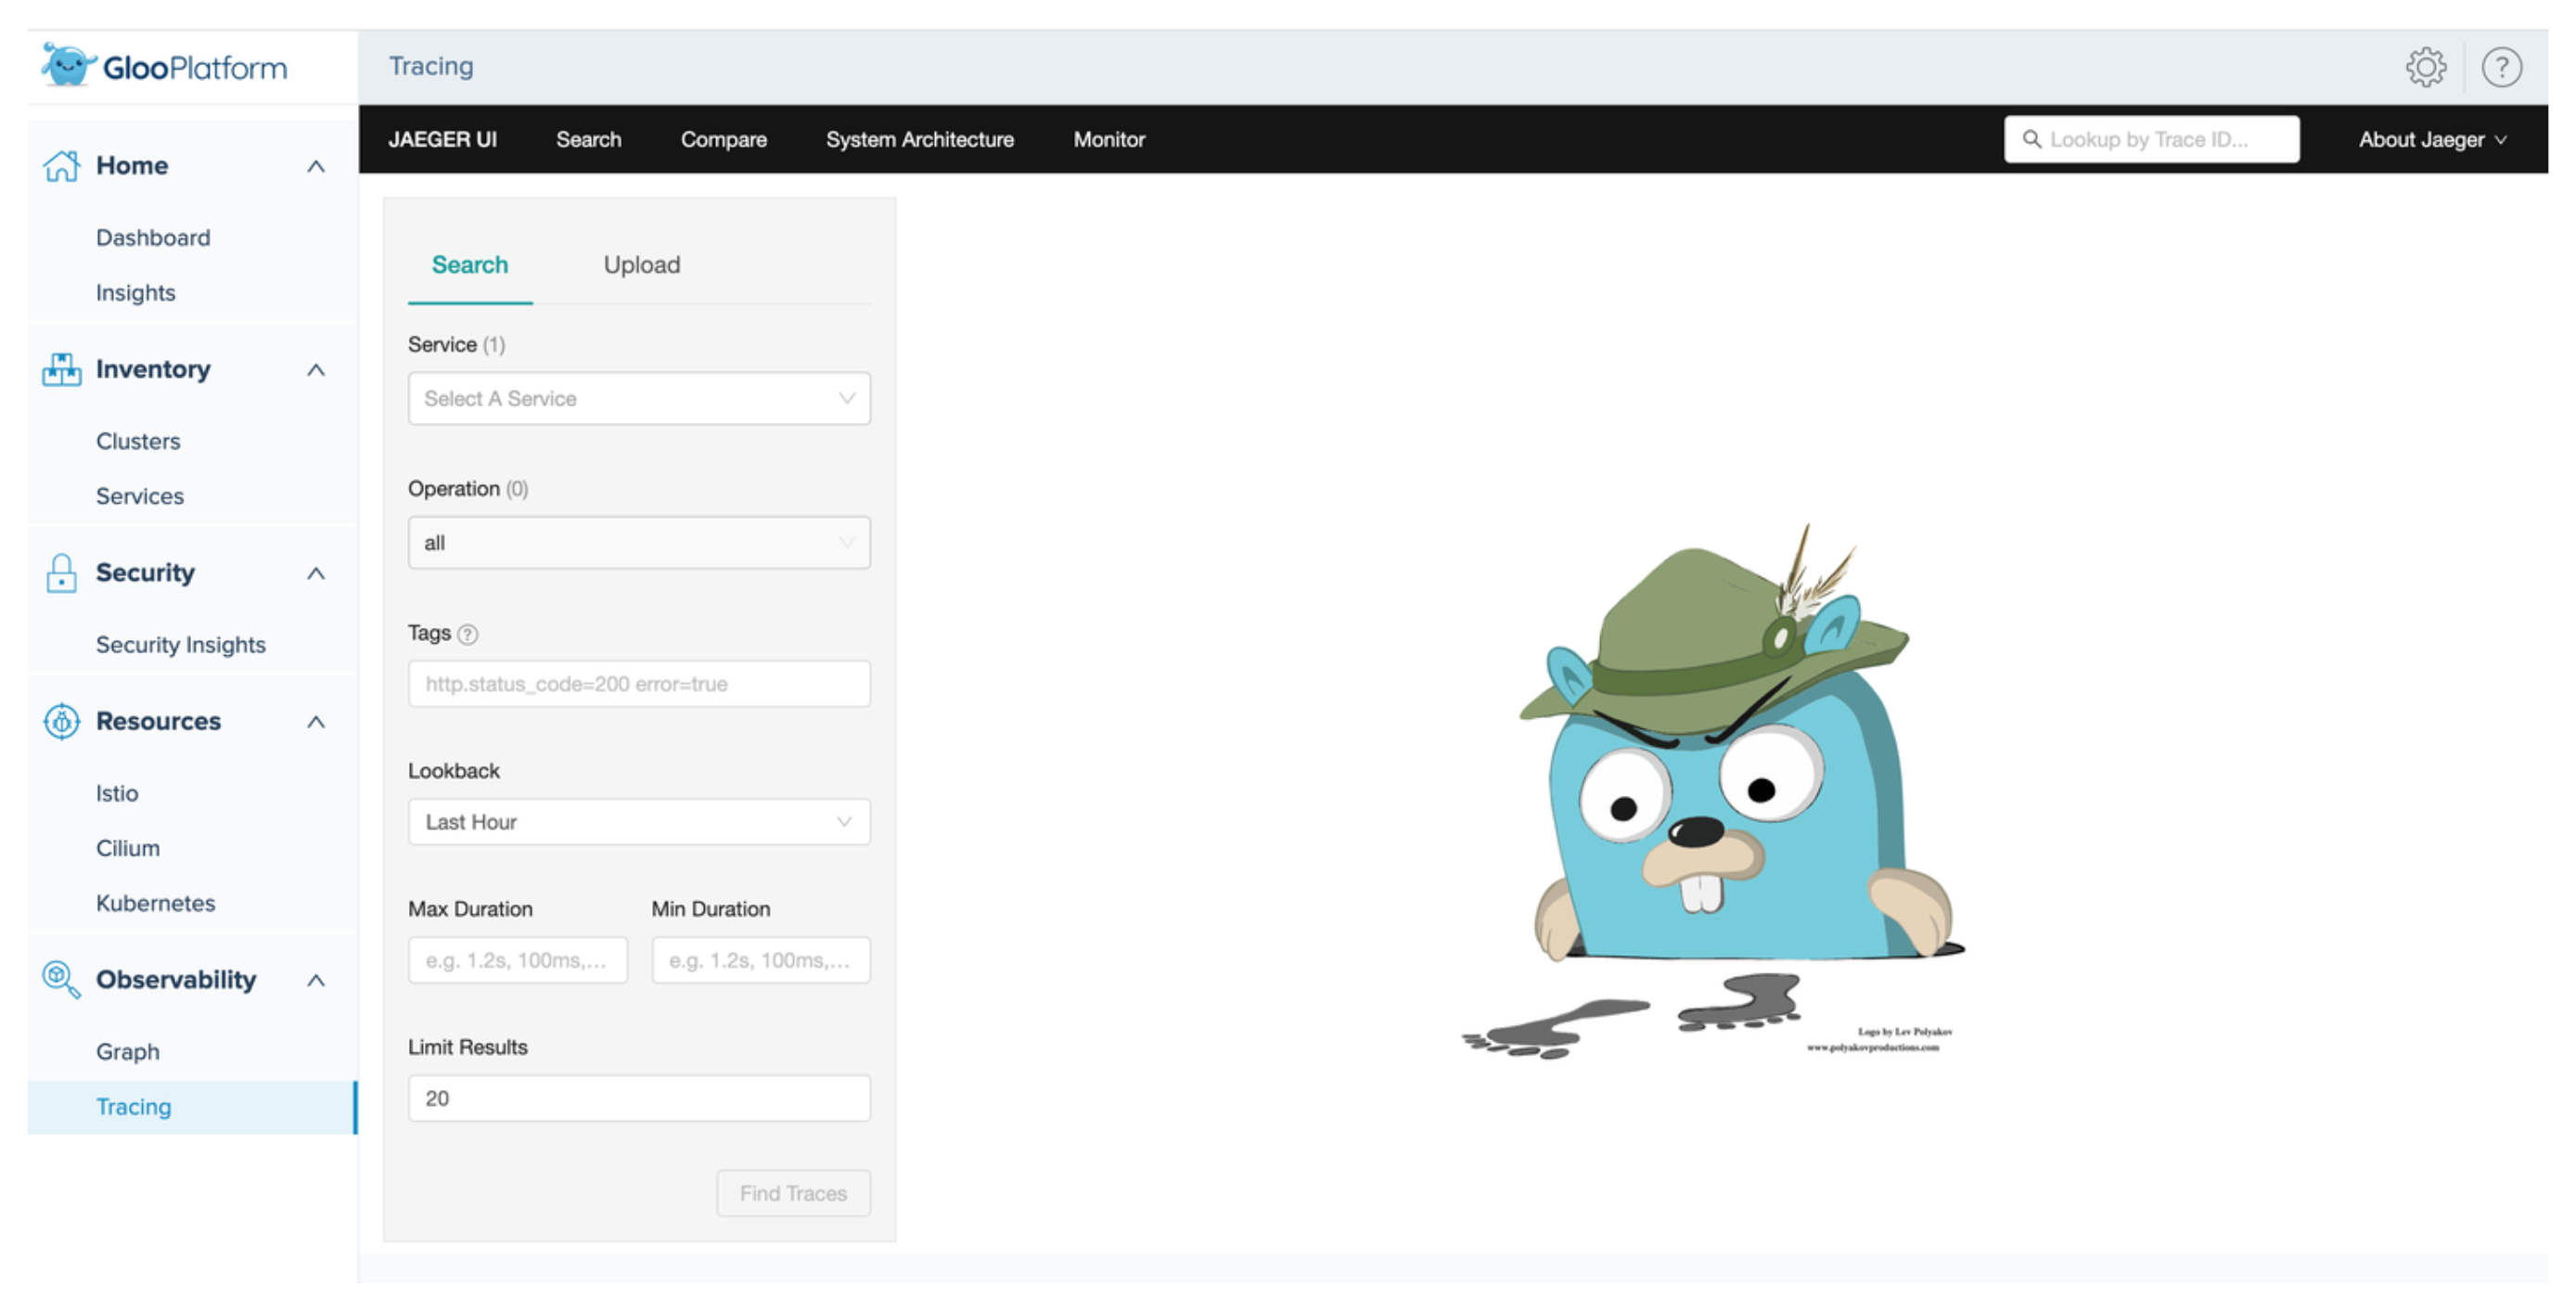
Tracing
Gloo Mesh Enterprise integrates with Jaeger as the tracing platform. Jaeger is an open source tool that helps you follow the path of a request as it is forwarded between microservices. The chain of events and interactions are then captured by the Gloo telemetry pipeline and visualized in the Jaeger UI that is embedded on the Tracing page of the Gloo UI. You can use this data to troubleshoot issues in your microservices and identify bottlenecks.
To access the Jaeger UI through the Gloo UI, you must enable tracing in the Gloo telemetry pipeline and instrument your apps to collect traces. If you have an existing Jaeger instance that you want to use to visualize traces, you can configure the Gloo UI to embed the UI of your Jaeger instance. For more information, see Add Istio request traces.
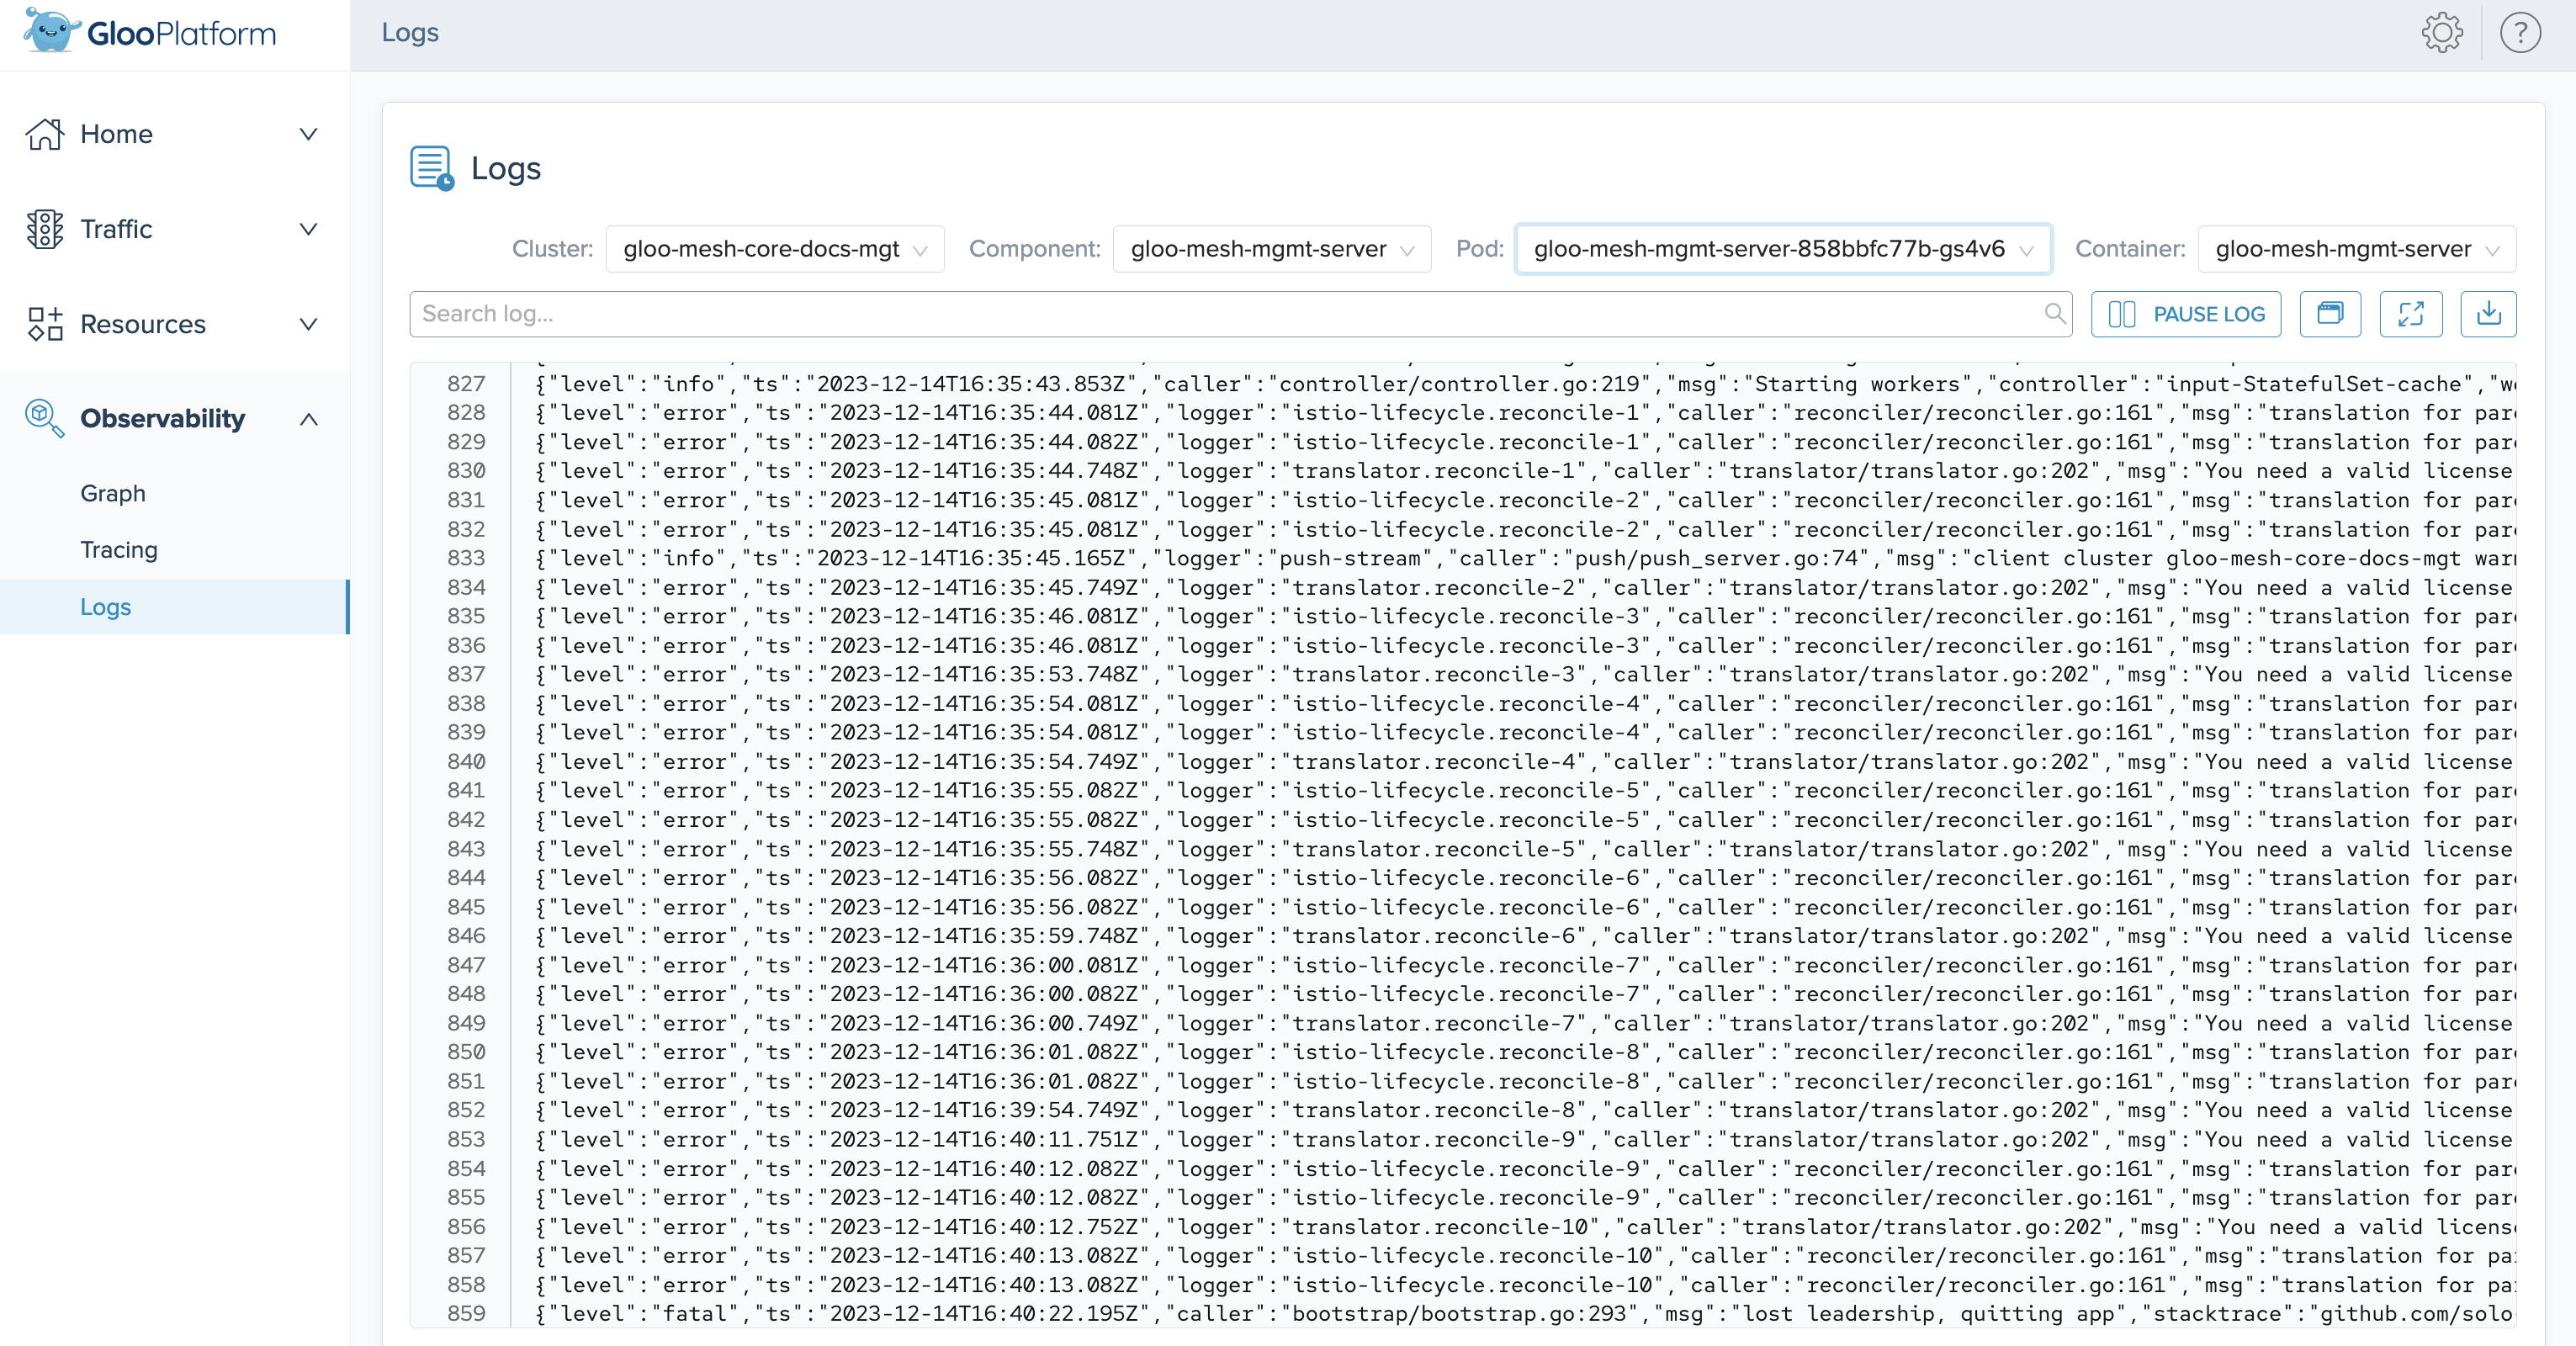
Logs
You can use the Gloo UI log viewer to see the logs of Gloo components, such as the Gloo management server, the Gloo telemetry collector agent, or the Gloo UI. These logs can help you monitor the health of your Gloo components and troubleshoot issues.
To view logs, use the log viewer filter options to select the cluster, Gloo component, pod name, and, if applicable, the container that you want to check the logs for. You can also use the search capability to find logs that match a specific search term, or download the logs so that you can share them with your team.